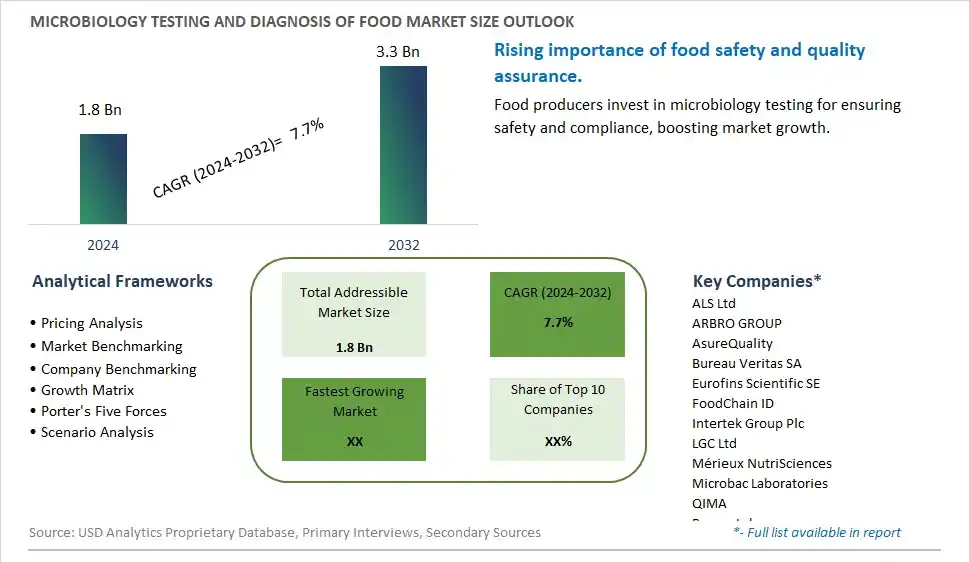
Global Microbiology Testing and Diagnosis of Food Market Size is valued at $1.8 Billion in 2024 and is forecast to register a growth rate (CAGR) of 7.7% to reach $3.3 Billion by 2032.
The global Microbiology Testing and Diagnosis of Food Market Comprehensive Study analyzes and forecasts the market size across 6 regions and 24 countries for diverse segments -By Type (Indicator Microorganisms Testing, Pathogens and Toxins Testing), By Application (Seafood, Meat and Poultry, Processed Food, Fruit and Vegetables, Soft Drinks, Others)
An Introduction to Microbiology Testing and Diagnosis of Food Market
The microbiology testing and diagnosis of food market in 2024 is thriving, driven by the increasing need for food safety and quality assurance in the food industry. Microbiology testing ensures that food products are free from harmful pathogens and meet regulatory standards. The market benefits from advancements in diagnostic technologies and testing methods that improve accuracy and efficiency. The trend towards stringent food safety regulations and increasing consumer awareness of foodborne illnesses is influencing market dynamics. The rise of global food trade and the demand for high-quality, safe food products are further supporting market growth.
Microbiology Testing and Diagnosis of Food Competitive Landscape
The market report analyses the leading companies in the industry including ALS Ltd, ARBRO GROUP, AsureQuality, Bureau Veritas SA, Eurofins Scientific SE, FoodChain ID, Intertek Group Plc, LGC Ltd, Mérieux NutriSciences, Microbac Laboratories, QIMA, Romer Labs, SGS SA, TÜV SÜD, and Others.
Microbiology Testing and Diagnosis of Food Market Dynamics
Microbiology Testing and Diagnosis of Food Market Trend: Increasing Focus on Food Safety and Quality
The most prominent trend in the Microbiology Testing and Diagnosis of Food Market is the increasing focus on food safety and quality. With growing concerns about foodborne illnesses and contamination, there is a heightened demand for rigorous microbiology testing to ensure the safety and quality of food products.
Microbiology Testing and Diagnosis of Food Market Driver: Stringent Food Safety Regulations
A key driver in the Microbiology Testing and Diagnosis of Food Market is stringent food safety regulations. Governments and regulatory bodies are implementing stricter standards and requirements for food safety testing, driving the need for advanced microbiology testing services and technologies.
Microbiology Testing and Diagnosis of Food Market Opportunity: Advancement in Rapid Testing Technologies
One significant opportunity in the Microbiology Testing and Diagnosis of Food Market lies in the advancement in rapid testing technologies. Companies can develop innovative testing methods that provide faster and more accurate results, enabling food producers to ensure safety and compliance more efficiently. By offering cutting-edge testing solutions, manufacturers can attract a wider range of clients and drive market growth.
Microbiology Testing and Diagnosis of Food Market Share Analysis- Largest Segment by Type
The Pathogens and Toxins Testing segment is the largest in the Microbiology Testing and Diagnosis of Food Market by type. This dominance is driven by the high demand for testing food for harmful pathogens and toxins to ensure food safety and protect public health. Pathogens and toxins testing is critical in identifying and controlling foodborne illnesses, which can have severe health consequences and economic impacts. The continuous innovation in testing technologies, including rapid and sensitive methods for detecting pathogens and toxins, enhances the efficiency and reliability of these tests. Additionally, the extensive regulatory requirements for food safety and the growing consumer awareness of foodborne risks further boost the market share of the pathogens and toxins testing segment. The strong emphasis on food safety and the need to prevent foodborne outbreaks reinforce the dominant position of the pathogens and toxins testing segment in the market.
Microbiology Testing and Diagnosis of Food Market Share Analysis- Fastest Growing Segment by Application
The Meat and Poultry segment is poised to grow the fastest in the Microbiology Testing and Diagnosis of Food Market by application over the next five years. This rapid growth is driven by the high risk of contamination in meat and poultry products, which can lead to serious foodborne illnesses. Microbiology testing is crucial in ensuring the safety and quality of meat and poultry by detecting harmful pathogens and toxins. The continuous innovation in testing methods, including rapid and automated technologies, enhances the detection and control of contaminants in meat and poultry products. Additionally, the stringent regulatory requirements for meat and poultry safety and the growing consumer demand for high-quality and safe products support the fast growth of this segment. The influence of food safety incidents and recalls further drives the demand for microbiology testing in the meat and poultry industry.
Microbiology Testing and Diagnosis of Food Market Segmentation
By Type
Indicator Microorganisms Testing
Pathogens and Toxins Testing
By Application
Seafood
Meat and Poultry
Processed Food
Fruit and Vegetables
Soft Drinks
Others
Countries Analyzed
North America (US, Canada, Mexico)
Europe (Germany, UK, France, Spain, Italy, Russia, Rest of Europe)
Asia Pacific (China, India, Japan, South Korea, Australia, South East Asia, Rest of Asia)
South America (Brazil, Argentina, Rest of South America)
Middle East and Africa (Saudi Arabia, UAE, Rest of Middle East, South Africa, Egypt, Rest of Africa)
Microbiology Testing and Diagnosis of Food Companies Profiled in the Study
ALS Ltd
ARBRO GROUP
AsureQuality
Bureau Veritas SA
Eurofins Scientific SE
FoodChain ID
Intertek Group Plc
LGC Ltd
Mérieux NutriSciences
Microbac Laboratories
QIMA
Romer Labs
SGS SA
TÜV SÜD
*- List Not Exhaustive
Chapter 1. TABLE OF CONTENTS
Chapter 2. Introduction to Microbiology Testing and Diagnosis of Food Market
2.1. Market Overview
2.2. Key Statistics and Report Highlights
2.3. Scope of the Comprehensive Study
2.3.1. Market Definition
2.3.2 Countries and Regions Covered
2.3.3 Research Objective
2.3.4 Units, Currency, and Conversions
2.3.5 Industry Value Chain
2.4. Key Market Segments
2.5. Key Companies
2.6. Study Period
Chapter 3. Strategic Analysis Review
3.1. Microbiology Testing and Diagnosis of Food Pricing Analysis and Forecast
3.2. Porter’s Five Forces
3.3. Market Ecosystem
3.4. SWOT Analysis
3.5. Regulatory Scenario
3.3. Effects of Inflation, Russia-Ukraine War, moderating economic growth, and other macroeconomic factors
Chapter 4. Competitive Landscape
4.1. Market Share Analysis
4.1.1. Global Microbiology Testing and Diagnosis of Food Market Share by Company, 2023
4.1.2. Product Offerings of Leading Microbiology Testing and Diagnosis of Food Companies
4.2. Market Entropy
4.2.1. New Product Launches in the Industry
4.2.2. Mergers, Acquisitions, Joint ventures, and Partnerships
4.3. Key Strategies and Best Practices
Chapter 5. Global Market Projections: Best, Reference, and Low Case Scenarios
5.1. Growth Analysis- Case Scenario Definitions
5.2. Low Growth Case Scenario Forecasts
5.3. Reference Growth Case Scenario Forecasts
5.4. High Growth Case Scenario Forecasts
Chapter 6. Market Dynamics
6.1. Microbiology Testing and Diagnosis of Food Market Drivers
6.2. Microbiology Testing and Diagnosis of Food Market Challenges
6.6. Microbiology Testing and Diagnosis of Food Market Opportunities
6.4. Microbiology Testing and Diagnosis of Food Market Trends
Chapter 7. Global Microbiology Testing and Diagnosis of Food Market Outlook Trends
7.1. Global Microbiology Testing and Diagnosis of Food Revenue (USD Million) and CAGR (%) by Type (2021-2032)
7.2. Global Microbiology Testing and Diagnosis of Food Revenue (USD Million) and CAGR (%) by Application (2021-2032)
7.3. Global Microbiology Testing and Diagnosis of Food Revenue (USD Million) and CAGR (%) by Product (2021-2032)
By Type
Indicator Microorganisms Testing
Pathogens and Toxins Testing
By Application
Seafood
Meat and Poultry
Processed Food
Fruit and Vegetables
Soft Drinks
Others
Chapter 8. Global Microbiology Testing and Diagnosis of Food Regional Analysis and Outlook
8.1. Global Microbiology Testing and Diagnosis of Food Revenue (USD Million) By Regions (2021- 2032)
8.2. North America Microbiology Testing and Diagnosis of Food Revenue (USD Million) by Country (2021-2032)
8.2.1. United States Microbiology Testing and Diagnosis of Food Regional Analysis and Outlook
8.2.2. Canada Microbiology Testing and Diagnosis of Food Regional Analysis and Outlook
8.2.3. Mexico Microbiology Testing and Diagnosis of Food Regional Analysis and Outlook
8.3. Europe Microbiology Testing and Diagnosis of Food Revenue (USD Million), by Country (2021-2032)
8.3.1. Germany Microbiology Testing and Diagnosis of Food Regional Analysis and Outlook
8.3.2. France Microbiology Testing and Diagnosis of Food Regional Analysis and Outlook
8.3.3. United Kingdom Microbiology Testing and Diagnosis of Food Regional Analysis and Outlook
8.3.4. Spain Microbiology Testing and Diagnosis of Food Regional Analysis and Outlook
8.3.5. Italy Microbiology Testing and Diagnosis of Food Regional Analysis and Outlook
8.3.6. Russia Microbiology Testing and Diagnosis of Food Regional Analysis and Outlook
8.3.7. Rest of Europe Microbiology Testing and Diagnosis of Food Regional Analysis and Outlook
8.4. Asia Pacific Microbiology Testing and Diagnosis of Food Revenue (USD Million) by Country (2021-2032)
8.4.1. China Microbiology Testing and Diagnosis of Food Regional Analysis and Outlook
8.4.2. Japan Microbiology Testing and Diagnosis of Food Regional Analysis and Outlook
8.4.3. India Microbiology Testing and Diagnosis of Food Regional Analysis and Outlook
8.4.4. South Korea Microbiology Testing and Diagnosis of Food Regional Analysis and Outlook
8.4.5. Australia Microbiology Testing and Diagnosis of Food Regional Analysis and Outlook
8.4.6. South East Asia Microbiology Testing and Diagnosis of Food Regional Analysis and Outlook
8.4.7. Rest of Asia Pacific Microbiology Testing and Diagnosis of Food Regional Analysis and Outlook
8.5. South America Microbiology Testing and Diagnosis of Food Revenue (USD Million), by Country (2021-2032)
8.5.1. Brazil Microbiology Testing and Diagnosis of Food Regional Analysis and Outlook
8.5.2. Argentina Microbiology Testing and Diagnosis of Food Regional Analysis and Outlook
8.5.3. Rest of South America Microbiology Testing and Diagnosis of Food Regional Analysis and Outlook
8.6. Middle East and Africa Microbiology Testing and Diagnosis of Food Revenue (USD Million) by Country (2021-2032)
8.6.1. Middle East Microbiology Testing and Diagnosis of Food Regional Analysis and Outlook
8.6.2. Africa Microbiology Testing and Diagnosis of Food Regional Analysis and Outlook
Chapter 9. North America Microbiology Testing and Diagnosis of Food Analysis and Outlook
9.1. North America Microbiology Testing and Diagnosis of Food Revenue (USD Million) by Segments (2021-2032)
9.1.1. North America Microbiology Testing and Diagnosis of Food Revenue (USD Million) by Type (2021-2032)
9.1.2. North America Microbiology Testing and Diagnosis of Food Revenue (USD Million) by Application (2021-2032)
9.1.3. North America Microbiology Testing and Diagnosis of Food Revenue (USD Million) by Product (2021-2032)
By Type
Indicator Microorganisms Testing
Pathogens and Toxins Testing
By Application
Seafood
Meat and Poultry
Processed Food
Fruit and Vegetables
Soft Drinks
Others
Chapter 10. Europe Microbiology Testing and Diagnosis of Food Analysis and Outlook
10.1. Europe Microbiology Testing and Diagnosis of Food Revenue (USD Million), by Segments (USD Million) (2021-2032)
10.1.1. Europe Microbiology Testing and Diagnosis of Food Revenue (USD Million) by Type (2021-2032)
10.1.2. Europe Microbiology Testing and Diagnosis of Food Revenue (USD Million) by Application (2021-2032)
10.1.3. Europe Microbiology Testing and Diagnosis of Food Revenue (USD Million) by Product (2021-2032)
By Type
Indicator Microorganisms Testing
Pathogens and Toxins Testing
By Application
Seafood
Meat and Poultry
Processed Food
Fruit and Vegetables
Soft Drinks
Others
Chapter 11. Asia Pacific Microbiology Testing and Diagnosis of Food Analysis and Outlook
11.1. Asia Pacific Microbiology Testing and Diagnosis of Food Revenue (USD Million), and Revenue (USD Million) by Segments (2021-2032)
11.1.1. Asia Pacific Microbiology Testing and Diagnosis of Food Revenue (USD Million) by Type (2021-2032)
11.1.2. Asia Pacific Microbiology Testing and Diagnosis of Food Revenue (USD Million) by Application (2021-2032)
11.1.3. Asia Pacific Microbiology Testing and Diagnosis of Food Revenue (USD Million) by Product (2021-2032)
By Type
Indicator Microorganisms Testing
Pathogens and Toxins Testing
By Application
Seafood
Meat and Poultry
Processed Food
Fruit and Vegetables
Soft Drinks
Others
Chapter 12. South America Microbiology Testing and Diagnosis of Food Analysis and Outlook
12.1. South America Microbiology Testing and Diagnosis of Food Revenue (USD Million), by Segments (2021-2032)
12.1.1. South America Microbiology Testing and Diagnosis of Food Revenue (USD Million) by Type (2021-2032)
12.1.2. South America Microbiology Testing and Diagnosis of Food Revenue (USD Million) by Application (2021-2032)
12.1.3. South America Microbiology Testing and Diagnosis of Food Revenue (USD Million) by Product (2021-2032)
By Type
Indicator Microorganisms Testing
Pathogens and Toxins Testing
By Application
Seafood
Meat and Poultry
Processed Food
Fruit and Vegetables
Soft Drinks
Others
Chapter 13. Middle East and Africa Microbiology Testing and Diagnosis of Food Analysis and Outlook
13.1. Middle East and Africa Microbiology Testing and Diagnosis of Food Revenue (USD Million), by Segments (2021-2032)
13.1.1. Middle East and Africa Microbiology Testing and Diagnosis of Food Revenue (USD Million) by Type (2021-2032)
13.1.2. Middle East and Africa Microbiology Testing and Diagnosis of Food Revenue (USD Million) by Application (2021-2032)
13.1.3. Middle East and Africa Microbiology Testing and Diagnosis of Food Revenue (USD Million) by Product (2021-2032)
By Type
Indicator Microorganisms Testing
Pathogens and Toxins Testing
By Application
Seafood
Meat and Poultry
Processed Food
Fruit and Vegetables
Soft Drinks
Others
Chapter 14. Microbiology Testing and Diagnosis of Food Company Profiles
14.1 Business Overview
14.2 Product Profiles
14.3 SWOT Profiles
14.5 Recent Developments
14.6 Financial Profile
List of Companies
ALS Ltd
ARBRO GROUP
AsureQuality
Bureau Veritas SA
Eurofins Scientific SE
FoodChain ID
Intertek Group Plc
LGC Ltd
Mérieux NutriSciences
Microbac Laboratories
QIMA
Romer Labs
SGS SA
TÜV SÜD
15. Methodology and Data Sources
15.1 Customization Offerings
15.2 Subscription Services
15.3 Related Reports
15.4 Publisher Expertise
LIST OF TABLES
Table 1 Market Segmentation Analysis
Table 2 Global Microbiology Testing and Diagnosis of Food Market Share of Leading Companies, 2023
Table 3 Product Offerings of Leading Companies
Table 4 Low Growth Scenario Forecasts
Table 5 Reference Case Growth Scenario
Table 6 High Growth Case Scenario
Table 7 Global Microbiology Testing and Diagnosis of Food Revenue (USD Million) And CAGR (%) By Type (2021-2032)
Table 8 Global Microbiology Testing and Diagnosis of Food Revenue (USD Million) And CAGR (%) By Application (2021-2032)
Table 9 Global Microbiology Testing and Diagnosis of Food Revenue (USD Million) And CAGR (%) By Product (2021-2032)
Table 10 Global Microbiology Testing and Diagnosis of Food Market Revenue (USD Million) By Regions (2021-2032)
Table 11 Global Microbiology Testing and Diagnosis of Food Market Share (%) By Regions (2021-2032)
Table 12 North America Microbiology Testing and Diagnosis of Food Revenue (USD Million) By Country (2021-2032)
Table 13 Europe Microbiology Testing and Diagnosis of Food Revenue (USD Million) By Country (2021-2032)
Table 14 Asia Pacific Microbiology Testing and Diagnosis of Food Revenue (USD Million) By Country (2021-2032)
Table 15 South America Microbiology Testing and Diagnosis of Food Revenue (USD Million) By Country (2021-2032)
Table 16 Middle East and Africa Microbiology Testing and Diagnosis of Food Revenue (USD Million) By Region (2021-2032)
Table 17 North America Microbiology Testing and Diagnosis of Food Revenue (USD Million) By Type (2021-2032)
Table 18 North America Microbiology Testing and Diagnosis of Food Revenue (USD Million) By Application (2021-2032)
Table 19 North America Microbiology Testing and Diagnosis of Food Revenue (USD Million) By Product (2021-2032)
Table 20 Europe Microbiology Testing and Diagnosis of Food Revenue (USD Million) By Type (2021-2032)
Table 21 Europe Microbiology Testing and Diagnosis of Food Revenue (USD Million) By Application (2021-2032)
Table 22 Europe Microbiology Testing and Diagnosis of Food Revenue (USD Million) By Product (2021-2032)
Table 23 Asia Pacific Microbiology Testing and Diagnosis of Food Revenue (USD Million) By Type (2021-2032)
Table 24 Asia Pacific Microbiology Testing and Diagnosis of Food Revenue (USD Million) By Application (2021-2032)
Table 25 Asia Pacific Microbiology Testing and Diagnosis of Food Revenue (USD Million) By Product (2021-2032)
Table 26 South America Microbiology Testing and Diagnosis of Food Revenue (USD Million) By Type (2021-2032)
Table 27 South America Microbiology Testing and Diagnosis of Food Revenue (USD Million) By Application (2021-2032)
Table 28 South America Microbiology Testing and Diagnosis of Food Revenue (USD Million) By Product (2021-2032)
Table 29 Middle East and Africa Microbiology Testing and Diagnosis of Food Revenue (USD Million) By Type (2021-2032)
Table 30 Middle East and Africa Microbiology Testing and Diagnosis of Food Revenue (USD Million) By Application (2021-2032)
Table 31 Middle East and Africa Microbiology Testing and Diagnosis of Food Revenue (USD Million) By Product (2021-2032)
LIST OF FIGURES
Figure 1. Market Scope
Figure 2. Pricing Forecasts Per Unit, 2023- 2032
Figure 3. Porter’s Five Forces
Figure 4. Global Microbiology Testing and Diagnosis of Food Market Revenue (USD Million) By Regions (2021-2032)
Figure 5. Global Microbiology Testing and Diagnosis of Food Market Share (%) By Regions (2023)
Figure 6. North America Microbiology Testing and Diagnosis of Food Revenue (USD Million) By Country (2021-2032)
Figure 7. United States Microbiology Testing and Diagnosis of Food Revenue (USD Million) By Country (2021-2032)
Figure 8. Canada Microbiology Testing and Diagnosis of Food Revenue (USD Million) By Country (2021-2032)
Figure 9. Mexico Microbiology Testing and Diagnosis of Food Revenue (USD Million) By Country (2021-2032)
Figure 10. Europe Microbiology Testing and Diagnosis of Food Revenue (USD Million) By Country (2021-2032)
Figure 11. Germany Microbiology Testing and Diagnosis of Food Revenue (USD Million) By Country (2021-2032)
Figure 12. France Microbiology Testing and Diagnosis of Food Revenue (USD Million) By Country (2021-2032)
Figure 13. United Kingdom Microbiology Testing and Diagnosis of Food Revenue (USD Million) By Country (2021-2032)
Figure 14. Spain Microbiology Testing and Diagnosis of Food Revenue (USD Million) By Country (2021-2032)
Figure 15. Italy Microbiology Testing and Diagnosis of Food Revenue (USD Million) By Country (2021-2032)
Figure 16. Russia Microbiology Testing and Diagnosis of Food Revenue (USD Million) By Country (2021-2032)
Figure 17. Rest of Europe Microbiology Testing and Diagnosis of Food Revenue (USD Million) By Country (2021-2032)
Figure 11. Asia Pacific Microbiology Testing and Diagnosis of Food Revenue (USD Million) By Country (2021-2032)
Figure 12. China Microbiology Testing and Diagnosis of Food Revenue (USD Million) By Country (2021-2032)
Figure 13. Japan Microbiology Testing and Diagnosis of Food Revenue (USD Million) By Country (2021-2032)
Figure 14. India Microbiology Testing and Diagnosis of Food Revenue (USD Million) By Country (2021-2032)
Figure 15. South Korea Microbiology Testing and Diagnosis of Food Revenue (USD Million) By Country (2021-2032)
Figure 16. Australia Microbiology Testing and Diagnosis of Food Revenue (USD Million) By Country (2021-2032)
Figure 17. South East Asia Microbiology Testing and Diagnosis of Food Revenue (USD Million) By Country (2021-2032)
Figure 18. South America Microbiology Testing and Diagnosis of Food Revenue (USD Million) By Country (2021-2032)
Figure 19. Brazil Microbiology Testing and Diagnosis of Food Revenue (USD Million) By Country (2021-2032)
Figure 20. Argentina Microbiology Testing and Diagnosis of Food Revenue (USD Million) By Country (2021-2032)
Figure 21. Rest of Asia Pacific Microbiology Testing and Diagnosis of Food Revenue (USD Million) By Country (2021-2032)
Figure 22. Middle East and Africa Microbiology Testing and Diagnosis of Food Revenue (USD Million) By Region (2021-2032)
Figure 23. Saudi Arabia Microbiology Testing and Diagnosis of Food Revenue (USD Million) By Region (2021-2032)
Figure 24. The UAE Microbiology Testing and Diagnosis of Food Revenue (USD Million) By Region (2021-2032)
Figure 25. Rest of Middle East Microbiology Testing and Diagnosis of Food Revenue (USD Million) By Region (2021-2032)
Figure 26. South Africa Microbiology Testing and Diagnosis of Food Revenue (USD Million) By Region (2021-2032)
Figure 27. Africa Microbiology Testing and Diagnosis of Food Revenue (USD Million) By Region (2021-2032)
Figure 28. North America Microbiology Testing and Diagnosis of Food Revenue (USD Million) By Type (2021-2032)
Figure 29. North America Microbiology Testing and Diagnosis of Food Revenue (USD Million) By Application (2021-2032)
Figure 30. North America Microbiology Testing and Diagnosis of Food Revenue (USD Million) By Product (2021-2032)
Figure 31. Europe Microbiology Testing and Diagnosis of Food Revenue (USD Million) By Type (2021-2032)
Figure 32. Europe Microbiology Testing and Diagnosis of Food Revenue (USD Million) By Application (2021-2032)
Figure 33. Europe Microbiology Testing and Diagnosis of Food Revenue (USD Million) By Product (2021-2032)
Figure 34. Asia Pacific Microbiology Testing and Diagnosis of Food Revenue (USD Million) By Type (2021-2032)
Figure 35. Asia Pacific Microbiology Testing and Diagnosis of Food Revenue (USD Million) By Application (2021-2032)
Figure 36. Asia Pacific Microbiology Testing and Diagnosis of Food Revenue (USD Million) By Product (2021-2032)
Figure 37. South America Microbiology Testing and Diagnosis of Food Revenue (USD Million) By Type (2021-2032)
Figure 38. South America Microbiology Testing and Diagnosis of Food Revenue (USD Million) By Application (2021-2032)
Figure 39. South America Microbiology Testing and Diagnosis of Food Revenue (USD Million) By Product (2021-2032)
Figure 40. Middle East and Africa Microbiology Testing and Diagnosis of Food Revenue (USD Million) By Type (2021-2032)
Figure 41. Middle East and Africa Microbiology Testing and Diagnosis of Food Revenue (USD Million) By Application (2021-2032)
Figure 42. Middle East and Africa Microbiology Testing and Diagnosis of Food Revenue (USD Million) By Product (2021-2032)
By Type
Indicator Microorganisms Testing
Pathogens and Toxins Testing
By Application
Seafood
Meat and Poultry
Processed Food
Fruit and Vegetables
Soft Drinks
Others
Countries Analyzed
North America (US, Canada, Mexico)
Europe (Germany, UK, France, Spain, Italy, Russia, Rest of Europe)
Asia Pacific (China, India, Japan, South Korea, Australia, South East Asia, Rest of Asia)
South America (Brazil, Argentina, Rest of South America)
Middle East and Africa (Saudi Arabia, UAE, Rest of Middle East, South Africa, Egypt, Rest of Africa)
