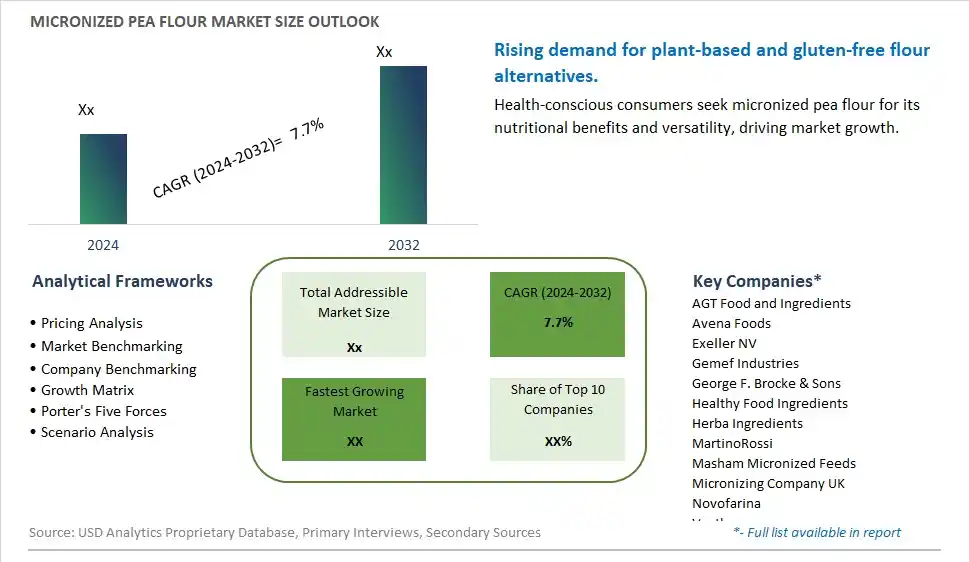
Global Micronized Pea Flour Market Size is valued at $XX Million in 2024 and is forecast to register a growth rate (CAGR) of 7.7% to reach $XX Million by 2032.
The global Micronized Pea Flour Market Comprehensive Study analyzes and forecasts the market size across 6 regions and 24 countries for diverse segments -By Type (Yellow Pea Flour, Green Pea Flour), By Application (Bakery & Snacks, Dietary Supplements, Beverages, Feeds, Others)
An Introduction to Micronized Pea Flour Market
In 2024, the micronized pea flour market is expanding rapidly, driven by the demand for high-protein, gluten-free flour alternatives. Micronized pea flour, made from finely milled yellow or green peas, offers excellent nutritional benefits and functional properties. The market benefits from advancements in milling and processing technologies that enhance the quality and application of micronized pea flour. The trend towards clean label and natural ingredients is influencing product development. Increasing consumer interest in plant-based proteins and the popularity of gluten-free baking are further propelling market growth.
Micronized Pea Flour Competitive Landscape
The market report analyses the leading companies in the industry including AGT Food and Ingredients, Avena Foods, Exeller NV, Gemef Industries, George F. Brocke & Sons, Healthy Food Ingredients, Herba Ingredients, MartinoRossi, Masham Micronized Feeds, Micronizing Company UK, Novofarina, Vestkorn, and Others.
Micronized Pea Flour Market Dynamics
Micronized Pea Flour Market Trend: Rising Popularity of Plant-Based Ingredients
The most prominent trend in the Micronized Pea Flour Market is the rising popularity of plant-based ingredients. Micronized pea flour, known for its high protein content and versatility, is increasingly used in plant-based foods and snacks, driven by consumer demand for vegan and vegetarian products.
Micronized Pea Flour Market Driver: Health Benefits and Nutritional Value
A key driver in the Micronized Pea Flour Market is the health benefits and nutritional value of pea flour. Rich in protein, fiber, and essential nutrients, micronized pea flour is valued for its potential to support overall health and wellness, boosting its demand in health-focused food products.
Micronized Pea Flour Market Opportunity: Expansion into Functional Food Applications
One significant opportunity in the Micronized Pea Flour Market lies in the expansion into functional food applications. Companies can innovate by incorporating micronized pea flour into a variety of products, such as protein bars, plant-based meat alternatives, and fortified baked goods. By leveraging the nutritional benefits and versatility of pea flour, manufacturers can attract health-conscious consumers and drive market growth.
Micronized Pea Flour Market Share Analysis- Largest Segment by Type
The Yellow Pea Flour segment is the largest in the Micronized Pea Flour Market by type. This dominance is driven by the high demand for yellow pea flour due to its neutral flavor, high protein content, and versatility in various food applications. Micronized yellow pea flour offers enhanced functional properties, such as improved solubility, texture, and nutritional value, making it a preferred choice for food manufacturers. The continuous innovation in yellow pea flour formulations, including the development of gluten-free and fortified options, enhances its appeal. Additionally, the extensive availability of yellow pea flour in the market and its compatibility with various food formulations further boost its market share. The strong consumer preference for plant-based and protein-rich ingredients reinforces the dominant position of the yellow pea flour segment in the market.
Micronized Pea Flour Market Share Analysis- Fastest Growing Segment by Application
The Bakery & Snacks segment is poised to grow the fastest in the Micronized Pea Flour Market by application over the next five years. This rapid growth is driven by the increasing demand for bakery and snack products with enhanced texture, taste, and nutritional value. Micronized pea flour is widely used in the bakery and snacks industry for its ability to improve the quality and shelf life of products. The continuous innovation in pea flour formulations, including the development of gluten-free, high-protein, and fiber-enriched options, enhances their appeal to health-conscious consumers. Additionally, the growing trend of convenience foods and the rising popularity of on-the-go snacks support the fast growth of the bakery and snacks segment. The influence of consumer preferences for high-quality and innovative snack products further drives the demand for micronized pea flour in this segment.
Micronized Pea Flour Market Segmentation
By Type
Yellow Pea Flour
Green Pea Flour
By Application
Bakery & Snacks
Dietary Supplements
Beverages
Feeds
Others
Countries Analyzed
North America (US, Canada, Mexico)
Europe (Germany, UK, France, Spain, Italy, Russia, Rest of Europe)
Asia Pacific (China, India, Japan, South Korea, Australia, South East Asia, Rest of Asia)
South America (Brazil, Argentina, Rest of South America)
Middle East and Africa (Saudi Arabia, UAE, Rest of Middle East, South Africa, Egypt, Rest of Africa)
Micronized Pea Flour Companies Profiled in the Study
AGT Food and Ingredients
Avena Foods
Exeller NV
Gemef Industries
George F. Brocke & Sons
Healthy Food Ingredients
Herba Ingredients
MartinoRossi
Masham Micronized Feeds
Micronizing Company UK
Novofarina
Vestkorn
*- List Not Exhaustive
Chapter 1. TABLE OF CONTENTS
Chapter 2. Introduction to Micronized Pea Flour Market
2.1. Market Overview
2.2. Key Statistics and Report Highlights
2.3. Scope of the Comprehensive Study
2.3.1. Market Definition
2.3.2 Countries and Regions Covered
2.3.3 Research Objective
2.3.4 Units, Currency, and Conversions
2.3.5 Industry Value Chain
2.4. Key Market Segments
2.5. Key Companies
2.6. Study Period
Chapter 3. Strategic Analysis Review
3.1. Micronized Pea Flour Pricing Analysis and Forecast
3.2. Porter’s Five Forces
3.3. Market Ecosystem
3.4. SWOT Analysis
3.5. Regulatory Scenario
3.3. Effects of Inflation, Russia-Ukraine War, moderating economic growth, and other macroeconomic factors
Chapter 4. Competitive Landscape
4.1. Market Share Analysis
4.1.1. Global Micronized Pea Flour Market Share by Company, 2023
4.1.2. Product Offerings of Leading Micronized Pea Flour Companies
4.2. Market Entropy
4.2.1. New Product Launches in the Industry
4.2.2. Mergers, Acquisitions, Joint ventures, and Partnerships
4.3. Key Strategies and Best Practices
Chapter 5. Global Market Projections: Best, Reference, and Low Case Scenarios
5.1. Growth Analysis- Case Scenario Definitions
5.2. Low Growth Case Scenario Forecasts
5.3. Reference Growth Case Scenario Forecasts
5.4. High Growth Case Scenario Forecasts
Chapter 6. Market Dynamics
6.1. Micronized Pea Flour Market Drivers
6.2. Micronized Pea Flour Market Challenges
6.6. Micronized Pea Flour Market Opportunities
6.4. Micronized Pea Flour Market Trends
Chapter 7. Global Micronized Pea Flour Market Outlook Trends
7.1. Global Micronized Pea Flour Revenue (USD Million) and CAGR (%) by Type (2021-2032)
7.2. Global Micronized Pea Flour Revenue (USD Million) and CAGR (%) by Application (2021-2032)
7.3. Global Micronized Pea Flour Revenue (USD Million) and CAGR (%) by Product (2021-2032)
By Type
Yellow Pea Flour
Green Pea Flour
By Application
Bakery & Snacks
Dietary Supplements
Beverages
Feeds
Others
Chapter 8. Global Micronized Pea Flour Regional Analysis and Outlook
8.1. Global Micronized Pea Flour Revenue (USD Million) By Regions (2021- 2032)
8.2. North America Micronized Pea Flour Revenue (USD Million) by Country (2021-2032)
8.2.1. United States Micronized Pea Flour Regional Analysis and Outlook
8.2.2. Canada Micronized Pea Flour Regional Analysis and Outlook
8.2.3. Mexico Micronized Pea Flour Regional Analysis and Outlook
8.3. Europe Micronized Pea Flour Revenue (USD Million), by Country (2021-2032)
8.3.1. Germany Micronized Pea Flour Regional Analysis and Outlook
8.3.2. France Micronized Pea Flour Regional Analysis and Outlook
8.3.3. United Kingdom Micronized Pea Flour Regional Analysis and Outlook
8.3.4. Spain Micronized Pea Flour Regional Analysis and Outlook
8.3.5. Italy Micronized Pea Flour Regional Analysis and Outlook
8.3.6. Russia Micronized Pea Flour Regional Analysis and Outlook
8.3.7. Rest of Europe Micronized Pea Flour Regional Analysis and Outlook
8.4. Asia Pacific Micronized Pea Flour Revenue (USD Million) by Country (2021-2032)
8.4.1. China Micronized Pea Flour Regional Analysis and Outlook
8.4.2. Japan Micronized Pea Flour Regional Analysis and Outlook
8.4.3. India Micronized Pea Flour Regional Analysis and Outlook
8.4.4. South Korea Micronized Pea Flour Regional Analysis and Outlook
8.4.5. Australia Micronized Pea Flour Regional Analysis and Outlook
8.4.6. South East Asia Micronized Pea Flour Regional Analysis and Outlook
8.4.7. Rest of Asia Pacific Micronized Pea Flour Regional Analysis and Outlook
8.5. South America Micronized Pea Flour Revenue (USD Million), by Country (2021-2032)
8.5.1. Brazil Micronized Pea Flour Regional Analysis and Outlook
8.5.2. Argentina Micronized Pea Flour Regional Analysis and Outlook
8.5.3. Rest of South America Micronized Pea Flour Regional Analysis and Outlook
8.6. Middle East and Africa Micronized Pea Flour Revenue (USD Million) by Country (2021-2032)
8.6.1. Middle East Micronized Pea Flour Regional Analysis and Outlook
8.6.2. Africa Micronized Pea Flour Regional Analysis and Outlook
Chapter 9. North America Micronized Pea Flour Analysis and Outlook
9.1. North America Micronized Pea Flour Revenue (USD Million) by Segments (2021-2032)
9.1.1. North America Micronized Pea Flour Revenue (USD Million) by Type (2021-2032)
9.1.2. North America Micronized Pea Flour Revenue (USD Million) by Application (2021-2032)
9.1.3. North America Micronized Pea Flour Revenue (USD Million) by Product (2021-2032)
By Type
Yellow Pea Flour
Green Pea Flour
By Application
Bakery & Snacks
Dietary Supplements
Beverages
Feeds
Others
Chapter 10. Europe Micronized Pea Flour Analysis and Outlook
10.1. Europe Micronized Pea Flour Revenue (USD Million), by Segments (USD Million) (2021-2032)
10.1.1. Europe Micronized Pea Flour Revenue (USD Million) by Type (2021-2032)
10.1.2. Europe Micronized Pea Flour Revenue (USD Million) by Application (2021-2032)
10.1.3. Europe Micronized Pea Flour Revenue (USD Million) by Product (2021-2032)
By Type
Yellow Pea Flour
Green Pea Flour
By Application
Bakery & Snacks
Dietary Supplements
Beverages
Feeds
Others
Chapter 11. Asia Pacific Micronized Pea Flour Analysis and Outlook
11.1. Asia Pacific Micronized Pea Flour Revenue (USD Million), and Revenue (USD Million) by Segments (2021-2032)
11.1.1. Asia Pacific Micronized Pea Flour Revenue (USD Million) by Type (2021-2032)
11.1.2. Asia Pacific Micronized Pea Flour Revenue (USD Million) by Application (2021-2032)
11.1.3. Asia Pacific Micronized Pea Flour Revenue (USD Million) by Product (2021-2032)
By Type
Yellow Pea Flour
Green Pea Flour
By Application
Bakery & Snacks
Dietary Supplements
Beverages
Feeds
Others
Chapter 12. South America Micronized Pea Flour Analysis and Outlook
12.1. South America Micronized Pea Flour Revenue (USD Million), by Segments (2021-2032)
12.1.1. South America Micronized Pea Flour Revenue (USD Million) by Type (2021-2032)
12.1.2. South America Micronized Pea Flour Revenue (USD Million) by Application (2021-2032)
12.1.3. South America Micronized Pea Flour Revenue (USD Million) by Product (2021-2032)
By Type
Yellow Pea Flour
Green Pea Flour
By Application
Bakery & Snacks
Dietary Supplements
Beverages
Feeds
Others
Chapter 13. Middle East and Africa Micronized Pea Flour Analysis and Outlook
13.1. Middle East and Africa Micronized Pea Flour Revenue (USD Million), by Segments (2021-2032)
13.1.1. Middle East and Africa Micronized Pea Flour Revenue (USD Million) by Type (2021-2032)
13.1.2. Middle East and Africa Micronized Pea Flour Revenue (USD Million) by Application (2021-2032)
13.1.3. Middle East and Africa Micronized Pea Flour Revenue (USD Million) by Product (2021-2032)
By Type
Yellow Pea Flour
Green Pea Flour
By Application
Bakery & Snacks
Dietary Supplements
Beverages
Feeds
Others
Chapter 14. Micronized Pea Flour Company Profiles
14.1 Business Overview
14.2 Product Profiles
14.3 SWOT Profiles
14.5 Recent Developments
14.6 Financial Profile
List of Companies
AGT Food and Ingredients
Avena Foods
Exeller NV
Gemef Industries
George F. Brocke & Sons
Healthy Food Ingredients
Herba Ingredients
MartinoRossi
Masham Micronized Feeds
Micronizing Company UK
Novofarina
Vestkorn
15. Methodology and Data Sources
15.1 Customization Offerings
15.2 Subscription Services
15.3 Related Reports
15.4 Publisher Expertise
LIST OF TABLES
Table 1 Market Segmentation Analysis
Table 2 Global Micronized Pea Flour Market Share of Leading Companies, 2023
Table 3 Product Offerings of Leading Companies
Table 4 Low Growth Scenario Forecasts
Table 5 Reference Case Growth Scenario
Table 6 High Growth Case Scenario
Table 7 Global Micronized Pea Flour Revenue (USD Million) And CAGR (%) By Type (2021-2032)
Table 8 Global Micronized Pea Flour Revenue (USD Million) And CAGR (%) By Application (2021-2032)
Table 9 Global Micronized Pea Flour Revenue (USD Million) And CAGR (%) By Product (2021-2032)
Table 10 Global Micronized Pea Flour Market Revenue (USD Million) By Regions (2021-2032)
Table 11 Global Micronized Pea Flour Market Share (%) By Regions (2021-2032)
Table 12 North America Micronized Pea Flour Revenue (USD Million) By Country (2021-2032)
Table 13 Europe Micronized Pea Flour Revenue (USD Million) By Country (2021-2032)
Table 14 Asia Pacific Micronized Pea Flour Revenue (USD Million) By Country (2021-2032)
Table 15 South America Micronized Pea Flour Revenue (USD Million) By Country (2021-2032)
Table 16 Middle East and Africa Micronized Pea Flour Revenue (USD Million) By Region (2021-2032)
Table 17 North America Micronized Pea Flour Revenue (USD Million) By Type (2021-2032)
Table 18 North America Micronized Pea Flour Revenue (USD Million) By Application (2021-2032)
Table 19 North America Micronized Pea Flour Revenue (USD Million) By Product (2021-2032)
Table 20 Europe Micronized Pea Flour Revenue (USD Million) By Type (2021-2032)
Table 21 Europe Micronized Pea Flour Revenue (USD Million) By Application (2021-2032)
Table 22 Europe Micronized Pea Flour Revenue (USD Million) By Product (2021-2032)
Table 23 Asia Pacific Micronized Pea Flour Revenue (USD Million) By Type (2021-2032)
Table 24 Asia Pacific Micronized Pea Flour Revenue (USD Million) By Application (2021-2032)
Table 25 Asia Pacific Micronized Pea Flour Revenue (USD Million) By Product (2021-2032)
Table 26 South America Micronized Pea Flour Revenue (USD Million) By Type (2021-2032)
Table 27 South America Micronized Pea Flour Revenue (USD Million) By Application (2021-2032)
Table 28 South America Micronized Pea Flour Revenue (USD Million) By Product (2021-2032)
Table 29 Middle East and Africa Micronized Pea Flour Revenue (USD Million) By Type (2021-2032)
Table 30 Middle East and Africa Micronized Pea Flour Revenue (USD Million) By Application (2021-2032)
Table 31 Middle East and Africa Micronized Pea Flour Revenue (USD Million) By Product (2021-2032)
LIST OF FIGURES
Figure 1. Market Scope
Figure 2. Pricing Forecasts Per Unit, 2023- 2032
Figure 3. Porter’s Five Forces
Figure 4. Global Micronized Pea Flour Market Revenue (USD Million) By Regions (2021-2032)
Figure 5. Global Micronized Pea Flour Market Share (%) By Regions (2023)
Figure 6. North America Micronized Pea Flour Revenue (USD Million) By Country (2021-2032)
Figure 7. United States Micronized Pea Flour Revenue (USD Million) By Country (2021-2032)
Figure 8. Canada Micronized Pea Flour Revenue (USD Million) By Country (2021-2032)
Figure 9. Mexico Micronized Pea Flour Revenue (USD Million) By Country (2021-2032)
Figure 10. Europe Micronized Pea Flour Revenue (USD Million) By Country (2021-2032)
Figure 11. Germany Micronized Pea Flour Revenue (USD Million) By Country (2021-2032)
Figure 12. France Micronized Pea Flour Revenue (USD Million) By Country (2021-2032)
Figure 13. United Kingdom Micronized Pea Flour Revenue (USD Million) By Country (2021-2032)
Figure 14. Spain Micronized Pea Flour Revenue (USD Million) By Country (2021-2032)
Figure 15. Italy Micronized Pea Flour Revenue (USD Million) By Country (2021-2032)
Figure 16. Russia Micronized Pea Flour Revenue (USD Million) By Country (2021-2032)
Figure 17. Rest of Europe Micronized Pea Flour Revenue (USD Million) By Country (2021-2032)
Figure 11. Asia Pacific Micronized Pea Flour Revenue (USD Million) By Country (2021-2032)
Figure 12. China Micronized Pea Flour Revenue (USD Million) By Country (2021-2032)
Figure 13. Japan Micronized Pea Flour Revenue (USD Million) By Country (2021-2032)
Figure 14. India Micronized Pea Flour Revenue (USD Million) By Country (2021-2032)
Figure 15. South Korea Micronized Pea Flour Revenue (USD Million) By Country (2021-2032)
Figure 16. Australia Micronized Pea Flour Revenue (USD Million) By Country (2021-2032)
Figure 17. South East Asia Micronized Pea Flour Revenue (USD Million) By Country (2021-2032)
Figure 18. South America Micronized Pea Flour Revenue (USD Million) By Country (2021-2032)
Figure 19. Brazil Micronized Pea Flour Revenue (USD Million) By Country (2021-2032)
Figure 20. Argentina Micronized Pea Flour Revenue (USD Million) By Country (2021-2032)
Figure 21. Rest of Asia Pacific Micronized Pea Flour Revenue (USD Million) By Country (2021-2032)
Figure 22. Middle East and Africa Micronized Pea Flour Revenue (USD Million) By Region (2021-2032)
Figure 23. Saudi Arabia Micronized Pea Flour Revenue (USD Million) By Region (2021-2032)
Figure 24. The UAE Micronized Pea Flour Revenue (USD Million) By Region (2021-2032)
Figure 25. Rest of Middle East Micronized Pea Flour Revenue (USD Million) By Region (2021-2032)
Figure 26. South Africa Micronized Pea Flour Revenue (USD Million) By Region (2021-2032)
Figure 27. Africa Micronized Pea Flour Revenue (USD Million) By Region (2021-2032)
Figure 28. North America Micronized Pea Flour Revenue (USD Million) By Type (2021-2032)
Figure 29. North America Micronized Pea Flour Revenue (USD Million) By Application (2021-2032)
Figure 30. North America Micronized Pea Flour Revenue (USD Million) By Product (2021-2032)
Figure 31. Europe Micronized Pea Flour Revenue (USD Million) By Type (2021-2032)
Figure 32. Europe Micronized Pea Flour Revenue (USD Million) By Application (2021-2032)
Figure 33. Europe Micronized Pea Flour Revenue (USD Million) By Product (2021-2032)
Figure 34. Asia Pacific Micronized Pea Flour Revenue (USD Million) By Type (2021-2032)
Figure 35. Asia Pacific Micronized Pea Flour Revenue (USD Million) By Application (2021-2032)
Figure 36. Asia Pacific Micronized Pea Flour Revenue (USD Million) By Product (2021-2032)
Figure 37. South America Micronized Pea Flour Revenue (USD Million) By Type (2021-2032)
Figure 38. South America Micronized Pea Flour Revenue (USD Million) By Application (2021-2032)
Figure 39. South America Micronized Pea Flour Revenue (USD Million) By Product (2021-2032)
Figure 40. Middle East and Africa Micronized Pea Flour Revenue (USD Million) By Type (2021-2032)
Figure 41. Middle East and Africa Micronized Pea Flour Revenue (USD Million) By Application (2021-2032)
Figure 42. Middle East and Africa Micronized Pea Flour Revenue (USD Million) By Product (2021-2032)
By Type
Yellow Pea Flour
Green Pea Flour
By Application
Bakery & Snacks
Dietary Supplements
Beverages
Feeds
Others
Countries Analyzed
North America (US, Canada, Mexico)
Europe (Germany, UK, France, Spain, Italy, Russia, Rest of Europe)
Asia Pacific (China, India, Japan, South Korea, Australia, South East Asia, Rest of Asia)
South America (Brazil, Argentina, Rest of South America)
Middle East and Africa (Saudi Arabia, UAE, Rest of Middle East, South Africa, Egypt, Rest of Africa)
