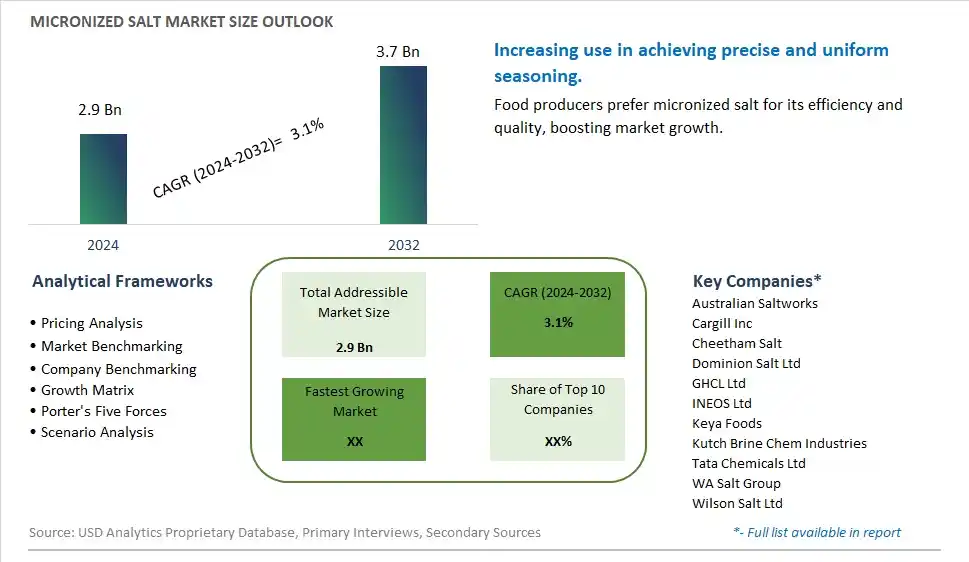
Global Micronized Salt Market Size is valued at $2.9 Billion in 2024 and is forecast to register a growth rate (CAGR) of 3.1% to reach $3.7 Billion by 2032.
The global Micronized Salt Market Comprehensive Study analyzes and forecasts the market size across 6 regions and 24 countries for diverse segments -By Purity (98 to 99.5%, Above 99.5%), By Application (Bakery & Confectionery, Meat, Poultry & Sea Foods, Milk & Dairy Products, Beverages, Others)
An Introduction to Micronized Salt Market
The micronized salt market in 2024 is thriving, driven by the demand for finely milled salt that offers improved solubility and uniformity in food processing and seasoning applications. Micronized salt, produced through advanced milling techniques, is valued for its ability to enhance flavor distribution and product consistency. The market benefits from innovations in salt processing and micronization that improve product quality and functionality. The trend towards clean label and natural ingredients is influencing product development. Increasing consumer interest in high-quality, functional ingredients and the popularity of gourmet and artisanal foods are further supporting market growth.
Micronized Salt Competitive Landscape
The market report analyses the leading companies in the industry including Australian Saltworks, Cargill Inc, Cheetham Salt, Dominion Salt Ltd, GHCL Ltd, INEOS Ltd, Keya Foods, Kutch Brine Chem Industries, Tata Chemicals Ltd, WA Salt Group, Wilson Salt Ltd, and Others.
Micronized Salt Market Dynamics
Micronized Salt Market Trend: Increasing Use in Food and Industrial Applications
The most prominent trend in the Micronized Salt Market is the increasing use in food and industrial applications. Micronized salt, known for its fine particle size and improved solubility, is used in a variety of products, including processed foods, pharmaceuticals, and chemical processes.
Micronized Salt Market Driver: Growth of the Processed Food Industry
A key driver in the Micronized Salt Market is the growth of the processed food industry. As the demand for convenience foods and ready-to-eat meals continues to rise, there is an increasing need for high-quality salt that enhances flavor and preservation. Micronized salt, which offers superior performance in food applications, caters to this demand and supports market growth.
Micronized Salt Market Opportunity: Development of Low-Sodium Salt Alternatives
One significant opportunity in the Micronized Salt Market lies in the development of low-sodium salt alternatives. Companies can innovate by creating micronized salt products that provide the same functional benefits with reduced sodium content, catering to health-conscious consumers and regulatory requirements. By offering healthier salt options, manufacturers can attract a broader consumer base and drive market growth.
Micronized Salt Market Share Analysis- Largest Segment by Purity
The Above .5% segment is the largest in the Micronized Salt Market by purity. This dominance is driven by the high demand for high-purity salt due to its superior quality and consistency in various applications. Micronized salt with a purity above .5% is widely used in the food and beverage industry for its ability to provide a consistent and controlled flavor profile without impurities. The continuous innovation in salt production and refining processes, including the development of high-purity and micronized forms, enhances its appeal. Additionally, the extensive availability of high-purity salt in the market and its compatibility with various food formulations further boost its market share. The strong consumer preference for high-quality and pure ingredients reinforces the dominant position of the above .5% segment in the market.
Micronized Salt Market Share Analysis- Fastest Growing Segment by Application
The Bakery & Confectionery segment is poised to grow the fastest in the Micronized Salt Market by application over the next five years. This rapid growth is driven by the increasing demand for bakery and confectionery products with consistent flavor and quality. Micronized salt is widely used in the bakery and confectionery industry for its ability to provide controlled and uniform saltiness, enhance flavor, and improve texture. The continuous innovation in salt formulations, including the development of micronized and high-purity options, enhances their applicability in bakery and confectionery products. Additionally, the growing trend of premium and artisanal bakery products supports the fast growth of the bakery and confectionery segment. The influence of consumer preferences for high-quality and flavorful baked goods further drives the demand for micronized salt in this segment.
Micronized Salt Market Segmentation
By Purity
98 to 99.5%
Above 99.5%
By Application
Bakery & Confectionery
Meat, Poultry & Sea Foods
Milk & Dairy Products
Beverages
Others
Countries Analyzed
North America (US, Canada, Mexico)
Europe (Germany, UK, France, Spain, Italy, Russia, Rest of Europe)
Asia Pacific (China, India, Japan, South Korea, Australia, South East Asia, Rest of Asia)
South America (Brazil, Argentina, Rest of South America)
Middle East and Africa (Saudi Arabia, UAE, Rest of Middle East, South Africa, Egypt, Rest of Africa)
Micronized Salt Companies Profiled in the Study
Australian Saltworks
Cargill Inc
Cheetham Salt
Dominion Salt Ltd
GHCL Ltd
INEOS Ltd
Keya Foods
Kutch Brine Chem Industries
Tata Chemicals Ltd
WA Salt Group
Wilson Salt Ltd
*- List Not Exhaustive
Chapter 1. TABLE OF CONTENTS
Chapter 2. Introduction to Micronized Salt Market
2.1. Market Overview
2.2. Key Statistics and Report Highlights
2.3. Scope of the Comprehensive Study
2.3.1. Market Definition
2.3.2 Countries and Regions Covered
2.3.3 Research Objective
2.3.4 Units, Currency, and Conversions
2.3.5 Industry Value Chain
2.4. Key Market Segments
2.5. Key Companies
2.6. Study Period
Chapter 3. Strategic Analysis Review
3.1. Micronized Salt Pricing Analysis and Forecast
3.2. Porter’s Five Forces
3.3. Market Ecosystem
3.4. SWOT Analysis
3.5. Regulatory Scenario
3.3. Effects of Inflation, Russia-Ukraine War, moderating economic growth, and other macroeconomic factors
Chapter 4. Competitive Landscape
4.1. Market Share Analysis
4.1.1. Global Micronized Salt Market Share by Company, 2023
4.1.2. Product Offerings of Leading Micronized Salt Companies
4.2. Market Entropy
4.2.1. New Product Launches in the Industry
4.2.2. Mergers, Acquisitions, Joint ventures, and Partnerships
4.3. Key Strategies and Best Practices
Chapter 5. Global Market Projections: Best, Reference, and Low Case Scenarios
5.1. Growth Analysis- Case Scenario Definitions
5.2. Low Growth Case Scenario Forecasts
5.3. Reference Growth Case Scenario Forecasts
5.4. High Growth Case Scenario Forecasts
Chapter 6. Market Dynamics
6.1. Micronized Salt Market Drivers
6.2. Micronized Salt Market Challenges
6.6. Micronized Salt Market Opportunities
6.4. Micronized Salt Market Trends
Chapter 7. Global Micronized Salt Market Outlook Trends
7.1. Global Micronized Salt Revenue (USD Million) and CAGR (%) by Type (2021-2032)
7.2. Global Micronized Salt Revenue (USD Million) and CAGR (%) by Application (2021-2032)
7.3. Global Micronized Salt Revenue (USD Million) and CAGR (%) by Product (2021-2032)
By Purity
98 to 99.5%
Above 99.5%
By Application
Bakery & Confectionery
Meat, Poultry & Sea Foods
Milk & Dairy Products
Beverages
Others
Chapter 8. Global Micronized Salt Regional Analysis and Outlook
8.1. Global Micronized Salt Revenue (USD Million) By Regions (2021- 2032)
8.2. North America Micronized Salt Revenue (USD Million) by Country (2021-2032)
8.2.1. United States Micronized Salt Regional Analysis and Outlook
8.2.2. Canada Micronized Salt Regional Analysis and Outlook
8.2.3. Mexico Micronized Salt Regional Analysis and Outlook
8.3. Europe Micronized Salt Revenue (USD Million), by Country (2021-2032)
8.3.1. Germany Micronized Salt Regional Analysis and Outlook
8.3.2. France Micronized Salt Regional Analysis and Outlook
8.3.3. United Kingdom Micronized Salt Regional Analysis and Outlook
8.3.4. Spain Micronized Salt Regional Analysis and Outlook
8.3.5. Italy Micronized Salt Regional Analysis and Outlook
8.3.6. Russia Micronized Salt Regional Analysis and Outlook
8.3.7. Rest of Europe Micronized Salt Regional Analysis and Outlook
8.4. Asia Pacific Micronized Salt Revenue (USD Million) by Country (2021-2032)
8.4.1. China Micronized Salt Regional Analysis and Outlook
8.4.2. Japan Micronized Salt Regional Analysis and Outlook
8.4.3. India Micronized Salt Regional Analysis and Outlook
8.4.4. South Korea Micronized Salt Regional Analysis and Outlook
8.4.5. Australia Micronized Salt Regional Analysis and Outlook
8.4.6. South East Asia Micronized Salt Regional Analysis and Outlook
8.4.7. Rest of Asia Pacific Micronized Salt Regional Analysis and Outlook
8.5. South America Micronized Salt Revenue (USD Million), by Country (2021-2032)
8.5.1. Brazil Micronized Salt Regional Analysis and Outlook
8.5.2. Argentina Micronized Salt Regional Analysis and Outlook
8.5.3. Rest of South America Micronized Salt Regional Analysis and Outlook
8.6. Middle East and Africa Micronized Salt Revenue (USD Million) by Country (2021-2032)
8.6.1. Middle East Micronized Salt Regional Analysis and Outlook
8.6.2. Africa Micronized Salt Regional Analysis and Outlook
Chapter 9. North America Micronized Salt Analysis and Outlook
9.1. North America Micronized Salt Revenue (USD Million) by Segments (2021-2032)
9.1.1. North America Micronized Salt Revenue (USD Million) by Type (2021-2032)
9.1.2. North America Micronized Salt Revenue (USD Million) by Application (2021-2032)
9.1.3. North America Micronized Salt Revenue (USD Million) by Product (2021-2032)
By Purity
98 to 99.5%
Above 99.5%
By Application
Bakery & Confectionery
Meat, Poultry & Sea Foods
Milk & Dairy Products
Beverages
Others
Chapter 10. Europe Micronized Salt Analysis and Outlook
10.1. Europe Micronized Salt Revenue (USD Million), by Segments (USD Million) (2021-2032)
10.1.1. Europe Micronized Salt Revenue (USD Million) by Type (2021-2032)
10.1.2. Europe Micronized Salt Revenue (USD Million) by Application (2021-2032)
10.1.3. Europe Micronized Salt Revenue (USD Million) by Product (2021-2032)
By Purity
98 to 99.5%
Above 99.5%
By Application
Bakery & Confectionery
Meat, Poultry & Sea Foods
Milk & Dairy Products
Beverages
Others
Chapter 11. Asia Pacific Micronized Salt Analysis and Outlook
11.1. Asia Pacific Micronized Salt Revenue (USD Million), and Revenue (USD Million) by Segments (2021-2032)
11.1.1. Asia Pacific Micronized Salt Revenue (USD Million) by Type (2021-2032)
11.1.2. Asia Pacific Micronized Salt Revenue (USD Million) by Application (2021-2032)
11.1.3. Asia Pacific Micronized Salt Revenue (USD Million) by Product (2021-2032)
By Purity
98 to 99.5%
Above 99.5%
By Application
Bakery & Confectionery
Meat, Poultry & Sea Foods
Milk & Dairy Products
Beverages
Others
Chapter 12. South America Micronized Salt Analysis and Outlook
12.1. South America Micronized Salt Revenue (USD Million), by Segments (2021-2032)
12.1.1. South America Micronized Salt Revenue (USD Million) by Type (2021-2032)
12.1.2. South America Micronized Salt Revenue (USD Million) by Application (2021-2032)
12.1.3. South America Micronized Salt Revenue (USD Million) by Product (2021-2032)
By Purity
98 to 99.5%
Above 99.5%
By Application
Bakery & Confectionery
Meat, Poultry & Sea Foods
Milk & Dairy Products
Beverages
Others
Chapter 13. Middle East and Africa Micronized Salt Analysis and Outlook
13.1. Middle East and Africa Micronized Salt Revenue (USD Million), by Segments (2021-2032)
13.1.1. Middle East and Africa Micronized Salt Revenue (USD Million) by Type (2021-2032)
13.1.2. Middle East and Africa Micronized Salt Revenue (USD Million) by Application (2021-2032)
13.1.3. Middle East and Africa Micronized Salt Revenue (USD Million) by Product (2021-2032)
By Purity
98 to 99.5%
Above 99.5%
By Application
Bakery & Confectionery
Meat, Poultry & Sea Foods
Milk & Dairy Products
Beverages
Others
Chapter 14. Micronized Salt Company Profiles
14.1 Business Overview
14.2 Product Profiles
14.3 SWOT Profiles
14.5 Recent Developments
14.6 Financial Profile
List of Companies
Australian Saltworks
Cargill Inc
Cheetham Salt
Dominion Salt Ltd
GHCL Ltd
INEOS Ltd
Keya Foods
Kutch Brine Chem Industries
Tata Chemicals Ltd
WA Salt Group
Wilson Salt Ltd
15. Methodology and Data Sources
15.1 Customization Offerings
15.2 Subscription Services
15.3 Related Reports
15.4 Publisher Expertise
LIST OF TABLES
Table 1 Market Segmentation Analysis
Table 2 Global Micronized Salt Market Share of Leading Companies, 2023
Table 3 Product Offerings of Leading Companies
Table 4 Low Growth Scenario Forecasts
Table 5 Reference Case Growth Scenario
Table 6 High Growth Case Scenario
Table 7 Global Micronized Salt Revenue (USD Million) And CAGR (%) By Type (2021-2032)
Table 8 Global Micronized Salt Revenue (USD Million) And CAGR (%) By Application (2021-2032)
Table 9 Global Micronized Salt Revenue (USD Million) And CAGR (%) By Product (2021-2032)
Table 10 Global Micronized Salt Market Revenue (USD Million) By Regions (2021-2032)
Table 11 Global Micronized Salt Market Share (%) By Regions (2021-2032)
Table 12 North America Micronized Salt Revenue (USD Million) By Country (2021-2032)
Table 13 Europe Micronized Salt Revenue (USD Million) By Country (2021-2032)
Table 14 Asia Pacific Micronized Salt Revenue (USD Million) By Country (2021-2032)
Table 15 South America Micronized Salt Revenue (USD Million) By Country (2021-2032)
Table 16 Middle East and Africa Micronized Salt Revenue (USD Million) By Region (2021-2032)
Table 17 North America Micronized Salt Revenue (USD Million) By Type (2021-2032)
Table 18 North America Micronized Salt Revenue (USD Million) By Application (2021-2032)
Table 19 North America Micronized Salt Revenue (USD Million) By Product (2021-2032)
Table 20 Europe Micronized Salt Revenue (USD Million) By Type (2021-2032)
Table 21 Europe Micronized Salt Revenue (USD Million) By Application (2021-2032)
Table 22 Europe Micronized Salt Revenue (USD Million) By Product (2021-2032)
Table 23 Asia Pacific Micronized Salt Revenue (USD Million) By Type (2021-2032)
Table 24 Asia Pacific Micronized Salt Revenue (USD Million) By Application (2021-2032)
Table 25 Asia Pacific Micronized Salt Revenue (USD Million) By Product (2021-2032)
Table 26 South America Micronized Salt Revenue (USD Million) By Type (2021-2032)
Table 27 South America Micronized Salt Revenue (USD Million) By Application (2021-2032)
Table 28 South America Micronized Salt Revenue (USD Million) By Product (2021-2032)
Table 29 Middle East and Africa Micronized Salt Revenue (USD Million) By Type (2021-2032)
Table 30 Middle East and Africa Micronized Salt Revenue (USD Million) By Application (2021-2032)
Table 31 Middle East and Africa Micronized Salt Revenue (USD Million) By Product (2021-2032)
LIST OF FIGURES
Figure 1. Market Scope
Figure 2. Pricing Forecasts Per Unit, 2023- 2032
Figure 3. Porter’s Five Forces
Figure 4. Global Micronized Salt Market Revenue (USD Million) By Regions (2021-2032)
Figure 5. Global Micronized Salt Market Share (%) By Regions (2023)
Figure 6. North America Micronized Salt Revenue (USD Million) By Country (2021-2032)
Figure 7. United States Micronized Salt Revenue (USD Million) By Country (2021-2032)
Figure 8. Canada Micronized Salt Revenue (USD Million) By Country (2021-2032)
Figure 9. Mexico Micronized Salt Revenue (USD Million) By Country (2021-2032)
Figure 10. Europe Micronized Salt Revenue (USD Million) By Country (2021-2032)
Figure 11. Germany Micronized Salt Revenue (USD Million) By Country (2021-2032)
Figure 12. France Micronized Salt Revenue (USD Million) By Country (2021-2032)
Figure 13. United Kingdom Micronized Salt Revenue (USD Million) By Country (2021-2032)
Figure 14. Spain Micronized Salt Revenue (USD Million) By Country (2021-2032)
Figure 15. Italy Micronized Salt Revenue (USD Million) By Country (2021-2032)
Figure 16. Russia Micronized Salt Revenue (USD Million) By Country (2021-2032)
Figure 17. Rest of Europe Micronized Salt Revenue (USD Million) By Country (2021-2032)
Figure 11. Asia Pacific Micronized Salt Revenue (USD Million) By Country (2021-2032)
Figure 12. China Micronized Salt Revenue (USD Million) By Country (2021-2032)
Figure 13. Japan Micronized Salt Revenue (USD Million) By Country (2021-2032)
Figure 14. India Micronized Salt Revenue (USD Million) By Country (2021-2032)
Figure 15. South Korea Micronized Salt Revenue (USD Million) By Country (2021-2032)
Figure 16. Australia Micronized Salt Revenue (USD Million) By Country (2021-2032)
Figure 17. South East Asia Micronized Salt Revenue (USD Million) By Country (2021-2032)
Figure 18. South America Micronized Salt Revenue (USD Million) By Country (2021-2032)
Figure 19. Brazil Micronized Salt Revenue (USD Million) By Country (2021-2032)
Figure 20. Argentina Micronized Salt Revenue (USD Million) By Country (2021-2032)
Figure 21. Rest of Asia Pacific Micronized Salt Revenue (USD Million) By Country (2021-2032)
Figure 22. Middle East and Africa Micronized Salt Revenue (USD Million) By Region (2021-2032)
Figure 23. Saudi Arabia Micronized Salt Revenue (USD Million) By Region (2021-2032)
Figure 24. The UAE Micronized Salt Revenue (USD Million) By Region (2021-2032)
Figure 25. Rest of Middle East Micronized Salt Revenue (USD Million) By Region (2021-2032)
Figure 26. South Africa Micronized Salt Revenue (USD Million) By Region (2021-2032)
Figure 27. Africa Micronized Salt Revenue (USD Million) By Region (2021-2032)
Figure 28. North America Micronized Salt Revenue (USD Million) By Type (2021-2032)
Figure 29. North America Micronized Salt Revenue (USD Million) By Application (2021-2032)
Figure 30. North America Micronized Salt Revenue (USD Million) By Product (2021-2032)
Figure 31. Europe Micronized Salt Revenue (USD Million) By Type (2021-2032)
Figure 32. Europe Micronized Salt Revenue (USD Million) By Application (2021-2032)
Figure 33. Europe Micronized Salt Revenue (USD Million) By Product (2021-2032)
Figure 34. Asia Pacific Micronized Salt Revenue (USD Million) By Type (2021-2032)
Figure 35. Asia Pacific Micronized Salt Revenue (USD Million) By Application (2021-2032)
Figure 36. Asia Pacific Micronized Salt Revenue (USD Million) By Product (2021-2032)
Figure 37. South America Micronized Salt Revenue (USD Million) By Type (2021-2032)
Figure 38. South America Micronized Salt Revenue (USD Million) By Application (2021-2032)
Figure 39. South America Micronized Salt Revenue (USD Million) By Product (2021-2032)
Figure 40. Middle East and Africa Micronized Salt Revenue (USD Million) By Type (2021-2032)
Figure 41. Middle East and Africa Micronized Salt Revenue (USD Million) By Application (2021-2032)
Figure 42. Middle East and Africa Micronized Salt Revenue (USD Million) By Product (2021-2032)
By Purity
98 to 99.5%
Above 99.5%
By Application
Bakery & Confectionery
Meat, Poultry & Sea Foods
Milk & Dairy Products
Beverages
Others
Countries Analyzed
North America (US, Canada, Mexico)
Europe (Germany, UK, France, Spain, Italy, Russia, Rest of Europe)
Asia Pacific (China, India, Japan, South Korea, Australia, South East Asia, Rest of Asia)
South America (Brazil, Argentina, Rest of South America)
Middle East and Africa (Saudi Arabia, UAE, Rest of Middle East, South Africa, Egypt, Rest of Africa)
