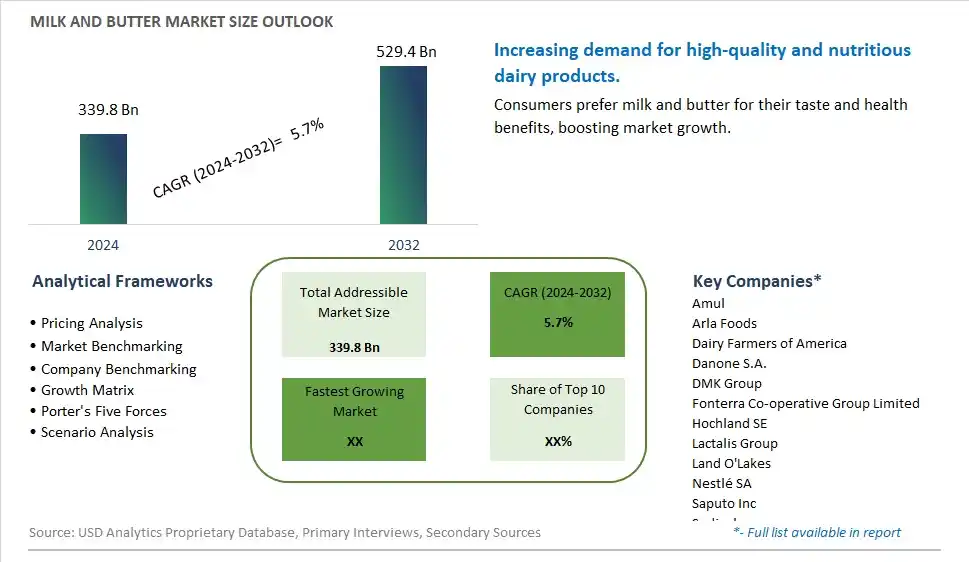
Global Milk and Butter Market Size is valued at $339.8 Billion in 2024 and is forecast to register a growth rate (CAGR) of 5.7% to reach $529.4 Billion by 2032.
The global Milk and Butter Market Comprehensive Study analyzes and forecasts the market size across 6 regions and 24 countries for diverse segments -By Type (Milk, Butter), By Application (Food, Beverages, Intermediate Products, Condiments, Others), By Packaging (Bottles, Pouches, Tins, Others), By Sales Channel (Online, Offline)
An Introduction to Milk and Butter Market
The milk and butter market in 2024 is thriving, fueled by the continued demand for dairy products that offer essential nutrients and rich flavors. Milk and butter, staples in many households, are used in a wide range of culinary applications. The market benefits from innovations in dairy farming and processing techniques that enhance product quality and shelf life. The trend towards clean label and natural ingredients is influencing product development. Increasing consumer interest in high-quality, organic, and locally sourced dairy products is further supporting market growth.
Milk and Butter Competitive Landscape
The market report analyses the leading companies in the industry including Amul, Arla Foods, Dairy Farmers of America, Danone S.A., DMK Group, Fonterra Co-operative Group Limited, Hochland SE, Lactalis Group, Land O'Lakes, Nestlé SA, Saputo Inc, Sodiaal, Yili Group, and Others.
Milk and Butter Market Dynamics
Milk and Butter Market Trend: Increasing Demand for Organic and Grass-Fed Dairy Products
The most prominent trend in the Milk and Butter Market is the increasing demand for organic and grass-fed dairy products. Consumers are seeking dairy options that offer better nutritional profiles and are produced using sustainable farming practices, driven by health and environmental concerns.
Milk and Butter Market Driver: Growth of the Health and Wellness Industry
A key driver in the Milk and Butter Market is the growth of the health and wellness industry. As more individuals focus on improving their diet and overall health, there is a rising demand for high-quality dairy products that provide essential nutrients and health benefits.
Milk and Butter Market Opportunity: Expansion into Specialty Dairy Products
One significant opportunity in the Milk and Butter Market lies in the expansion into specialty dairy products. Companies can innovate by developing new milk and butter products that cater to specific dietary needs, such as lactose-free, A2 milk, and clarified butter (ghee). By offering diverse and health-focused options, manufacturers can attract a broader consumer base and drive market growth.
Milk and Butter Market Share Analysis- Largest Segment by Type
In the Milk and Butter Market, Milk is the largest segment by type. This dominance is attributed to milk's essential role as a staple dietary product across various demographics and its widespread use in a multitude of applications. Milk's versatility in cooking, baking, and as a beverage drives its substantial consumption compared to butter. Additionally, milk's broad appeal, due to its nutritional benefits, including calcium, protein, and vitamins, supports its position as the leading segment. The extensive range of milk products, including whole milk, skim milk, and flavored milk, further reinforces its significant market share. The consistent demand for milk in both developed and emerging markets ensures its dominance over butter in the market.
Milk and Butter Market Share Analysis- Fastest Growing Segment by Application
In the Milk and Butter Market, the Beverages application segment is poised to grow the fastest over the next five years. This growth is driven by the increasing consumer demand for dairy-based beverages, including flavored milks, protein shakes, and functional drinks that offer added nutritional benefits. The rising trend of incorporating dairy into functional and fortified beverages aligns with the growing health consciousness among consumers. Additionally, the expansion of dairy beverage options in supermarkets and the introduction of innovative dairy drink formulations contribute to the rapid growth of this segment. The growing popularity of dairy-based beverages in various forms, such as ready-to-drink and on-the-go options, supports its position as the fastest-growing application segment.
Milk and Butter Market Share Analysis- Largest Segment by Packaging
In the Milk and Butter Market, Bottles represent the largest segment by packaging. Bottles are preferred for milk due to their convenience, ability to maintain freshness, and ease of handling. The use of bottles for milk packaging is well-established, with consumers favoring them for their resealable nature and suitability for both short-term and long-term storage. The widespread adoption of bottled milk in retail environments and the continued innovation in bottle designs, such as those offering improved protection against spoilage, further solidify the dominance of this packaging type. Bottles also cater to a broad consumer base, from households to on-the-go consumers, ensuring their significant share in the market.
Milk and Butter Market Share Analysis- Fastest Growing Segment by Sales Channel
In the Milk and Butter Market, the Online sales channel is poised to grow the fastest over the next five years. This trend is driven by the increasing consumer preference for the convenience of online shopping, which allows for easy access to a wide range of milk and butter products without the need to visit physical stores. The growth of e-commerce platforms and online grocery delivery services has facilitated the expansion of online sales in the dairy sector. Additionally, the rise in digital payment methods and advancements in logistics contribute to the growing appeal of online shopping for dairy products. The increasing number of consumers seeking hassle-free purchasing experiences and the expansion of online retail networks support the rapid growth of the online sales channel.
Milk and Butter Market Segmentation
By Type
Milk
Butter
By Application
Food
Beverages
Intermediate Products
Condiments
Others
By Packaging
Bottles
Pouches
Tins
Others
By Sales Channel
Online
Offline
Countries Analyzed
North America (US, Canada, Mexico)
Europe (Germany, UK, France, Spain, Italy, Russia, Rest of Europe)
Asia Pacific (China, India, Japan, South Korea, Australia, South East Asia, Rest of Asia)
South America (Brazil, Argentina, Rest of South America)
Middle East and Africa (Saudi Arabia, UAE, Rest of Middle East, South Africa, Egypt, Rest of Africa)
Milk and Butter Companies Profiled in the Study
Amul
Arla Foods
Dairy Farmers of America
Danone S.A.
DMK Group
Fonterra Co-operative Group Limited
Hochland SE
Lactalis Group
Land O'Lakes
Nestlé SA
Saputo Inc
Sodiaal
Yili Group
*- List Not Exhaustive
Chapter 1. TABLE OF CONTENTS
Chapter 2. Introduction to Milk and Butter Market
2.1. Market Overview
2.2. Key Statistics and Report Highlights
2.3. Scope of the Comprehensive Study
2.3.1. Market Definition
2.3.2 Countries and Regions Covered
2.3.3 Research Objective
2.3.4 Units, Currency, and Conversions
2.3.5 Industry Value Chain
2.4. Key Market Segments
2.5. Key Companies
2.6. Study Period
Chapter 3. Strategic Analysis Review
3.1. Milk and Butter Pricing Analysis and Forecast
3.2. Porter’s Five Forces
3.3. Market Ecosystem
3.4. SWOT Analysis
3.5. Regulatory Scenario
3.3. Effects of Inflation, Russia-Ukraine War, moderating economic growth, and other macroeconomic factors
Chapter 4. Competitive Landscape
4.1. Market Share Analysis
4.1.1. Global Milk and Butter Market Share by Company, 2023
4.1.2. Product Offerings of Leading Milk and Butter Companies
4.2. Market Entropy
4.2.1. New Product Launches in the Industry
4.2.2. Mergers, Acquisitions, Joint ventures, and Partnerships
4.3. Key Strategies and Best Practices
Chapter 5. Global Market Projections: Best, Reference, and Low Case Scenarios
5.1. Growth Analysis- Case Scenario Definitions
5.2. Low Growth Case Scenario Forecasts
5.3. Reference Growth Case Scenario Forecasts
5.4. High Growth Case Scenario Forecasts
Chapter 6. Market Dynamics
6.1. Milk and Butter Market Drivers
6.2. Milk and Butter Market Challenges
6.6. Milk and Butter Market Opportunities
6.4. Milk and Butter Market Trends
Chapter 7. Global Milk and Butter Market Outlook Trends
7.1. Global Milk and Butter Revenue (USD Million) and CAGR (%) by Type (2021-2032)
7.2. Global Milk and Butter Revenue (USD Million) and CAGR (%) by Application (2021-2032)
7.3. Global Milk and Butter Revenue (USD Million) and CAGR (%) by Product (2021-2032)
By Type
Milk
Butter
By Application
Food
Beverages
Intermediate Products
Condiments
Others
By Packaging
Bottles
Pouches
Tins
Others
By Sales Channel
Online
Offline
Chapter 8. Global Milk and Butter Regional Analysis and Outlook
8.1. Global Milk and Butter Revenue (USD Million) By Regions (2021- 2032)
8.2. North America Milk and Butter Revenue (USD Million) by Country (2021-2032)
8.2.1. United States Milk and Butter Regional Analysis and Outlook
8.2.2. Canada Milk and Butter Regional Analysis and Outlook
8.2.3. Mexico Milk and Butter Regional Analysis and Outlook
8.3. Europe Milk and Butter Revenue (USD Million), by Country (2021-2032)
8.3.1. Germany Milk and Butter Regional Analysis and Outlook
8.3.2. France Milk and Butter Regional Analysis and Outlook
8.3.3. United Kingdom Milk and Butter Regional Analysis and Outlook
8.3.4. Spain Milk and Butter Regional Analysis and Outlook
8.3.5. Italy Milk and Butter Regional Analysis and Outlook
8.3.6. Russia Milk and Butter Regional Analysis and Outlook
8.3.7. Rest of Europe Milk and Butter Regional Analysis and Outlook
8.4. Asia Pacific Milk and Butter Revenue (USD Million) by Country (2021-2032)
8.4.1. China Milk and Butter Regional Analysis and Outlook
8.4.2. Japan Milk and Butter Regional Analysis and Outlook
8.4.3. India Milk and Butter Regional Analysis and Outlook
8.4.4. South Korea Milk and Butter Regional Analysis and Outlook
8.4.5. Australia Milk and Butter Regional Analysis and Outlook
8.4.6. South East Asia Milk and Butter Regional Analysis and Outlook
8.4.7. Rest of Asia Pacific Milk and Butter Regional Analysis and Outlook
8.5. South America Milk and Butter Revenue (USD Million), by Country (2021-2032)
8.5.1. Brazil Milk and Butter Regional Analysis and Outlook
8.5.2. Argentina Milk and Butter Regional Analysis and Outlook
8.5.3. Rest of South America Milk and Butter Regional Analysis and Outlook
8.6. Middle East and Africa Milk and Butter Revenue (USD Million) by Country (2021-2032)
8.6.1. Middle East Milk and Butter Regional Analysis and Outlook
8.6.2. Africa Milk and Butter Regional Analysis and Outlook
Chapter 9. North America Milk and Butter Analysis and Outlook
9.1. North America Milk and Butter Revenue (USD Million) by Segments (2021-2032)
9.1.1. North America Milk and Butter Revenue (USD Million) by Type (2021-2032)
9.1.2. North America Milk and Butter Revenue (USD Million) by Application (2021-2032)
9.1.3. North America Milk and Butter Revenue (USD Million) by Product (2021-2032)
By Type
Milk
Butter
By Application
Food
Beverages
Intermediate Products
Condiments
Others
By Packaging
Bottles
Pouches
Tins
Others
By Sales Channel
Online
Offline
Chapter 10. Europe Milk and Butter Analysis and Outlook
10.1. Europe Milk and Butter Revenue (USD Million), by Segments (USD Million) (2021-2032)
10.1.1. Europe Milk and Butter Revenue (USD Million) by Type (2021-2032)
10.1.2. Europe Milk and Butter Revenue (USD Million) by Application (2021-2032)
10.1.3. Europe Milk and Butter Revenue (USD Million) by Product (2021-2032)
By Type
Milk
Butter
By Application
Food
Beverages
Intermediate Products
Condiments
Others
By Packaging
Bottles
Pouches
Tins
Others
By Sales Channel
Online
Offline
Chapter 11. Asia Pacific Milk and Butter Analysis and Outlook
11.1. Asia Pacific Milk and Butter Revenue (USD Million), and Revenue (USD Million) by Segments (2021-2032)
11.1.1. Asia Pacific Milk and Butter Revenue (USD Million) by Type (2021-2032)
11.1.2. Asia Pacific Milk and Butter Revenue (USD Million) by Application (2021-2032)
11.1.3. Asia Pacific Milk and Butter Revenue (USD Million) by Product (2021-2032)
By Type
Milk
Butter
By Application
Food
Beverages
Intermediate Products
Condiments
Others
By Packaging
Bottles
Pouches
Tins
Others
By Sales Channel
Online
Offline
Chapter 12. South America Milk and Butter Analysis and Outlook
12.1. South America Milk and Butter Revenue (USD Million), by Segments (2021-2032)
12.1.1. South America Milk and Butter Revenue (USD Million) by Type (2021-2032)
12.1.2. South America Milk and Butter Revenue (USD Million) by Application (2021-2032)
12.1.3. South America Milk and Butter Revenue (USD Million) by Product (2021-2032)
By Type
Milk
Butter
By Application
Food
Beverages
Intermediate Products
Condiments
Others
By Packaging
Bottles
Pouches
Tins
Others
By Sales Channel
Online
Offline
Chapter 13. Middle East and Africa Milk and Butter Analysis and Outlook
13.1. Middle East and Africa Milk and Butter Revenue (USD Million), by Segments (2021-2032)
13.1.1. Middle East and Africa Milk and Butter Revenue (USD Million) by Type (2021-2032)
13.1.2. Middle East and Africa Milk and Butter Revenue (USD Million) by Application (2021-2032)
13.1.3. Middle East and Africa Milk and Butter Revenue (USD Million) by Product (2021-2032)
By Type
Milk
Butter
By Application
Food
Beverages
Intermediate Products
Condiments
Others
By Packaging
Bottles
Pouches
Tins
Others
By Sales Channel
Online
Offline
Chapter 14. Milk and Butter Company Profiles
14.1 Business Overview
14.2 Product Profiles
14.3 SWOT Profiles
14.5 Recent Developments
14.6 Financial Profile
List of Companies
Amul
Arla Foods
Dairy Farmers of America
Danone S.A.
DMK Group
Fonterra Co-operative Group Limited
Hochland SE
Lactalis Group
Land O'Lakes
Nestlé SA
Saputo Inc
Sodiaal
Yili Group
15. Methodology and Data Sources
15.1 Customization Offerings
15.2 Subscription Services
15.3 Related Reports
15.4 Publisher Expertise
LIST OF TABLES
Table 1 Market Segmentation Analysis
Table 2 Global Milk and Butter Market Share of Leading Companies, 2023
Table 3 Product Offerings of Leading Companies
Table 4 Low Growth Scenario Forecasts
Table 5 Reference Case Growth Scenario
Table 6 High Growth Case Scenario
Table 7 Global Milk and Butter Revenue (USD Million) And CAGR (%) By Type (2021-2032)
Table 8 Global Milk and Butter Revenue (USD Million) And CAGR (%) By Application (2021-2032)
Table 9 Global Milk and Butter Revenue (USD Million) And CAGR (%) By Product (2021-2032)
Table 10 Global Milk and Butter Market Revenue (USD Million) By Regions (2021-2032)
Table 11 Global Milk and Butter Market Share (%) By Regions (2021-2032)
Table 12 North America Milk and Butter Revenue (USD Million) By Country (2021-2032)
Table 13 Europe Milk and Butter Revenue (USD Million) By Country (2021-2032)
Table 14 Asia Pacific Milk and Butter Revenue (USD Million) By Country (2021-2032)
Table 15 South America Milk and Butter Revenue (USD Million) By Country (2021-2032)
Table 16 Middle East and Africa Milk and Butter Revenue (USD Million) By Region (2021-2032)
Table 17 North America Milk and Butter Revenue (USD Million) By Type (2021-2032)
Table 18 North America Milk and Butter Revenue (USD Million) By Application (2021-2032)
Table 19 North America Milk and Butter Revenue (USD Million) By Product (2021-2032)
Table 20 Europe Milk and Butter Revenue (USD Million) By Type (2021-2032)
Table 21 Europe Milk and Butter Revenue (USD Million) By Application (2021-2032)
Table 22 Europe Milk and Butter Revenue (USD Million) By Product (2021-2032)
Table 23 Asia Pacific Milk and Butter Revenue (USD Million) By Type (2021-2032)
Table 24 Asia Pacific Milk and Butter Revenue (USD Million) By Application (2021-2032)
Table 25 Asia Pacific Milk and Butter Revenue (USD Million) By Product (2021-2032)
Table 26 South America Milk and Butter Revenue (USD Million) By Type (2021-2032)
Table 27 South America Milk and Butter Revenue (USD Million) By Application (2021-2032)
Table 28 South America Milk and Butter Revenue (USD Million) By Product (2021-2032)
Table 29 Middle East and Africa Milk and Butter Revenue (USD Million) By Type (2021-2032)
Table 30 Middle East and Africa Milk and Butter Revenue (USD Million) By Application (2021-2032)
Table 31 Middle East and Africa Milk and Butter Revenue (USD Million) By Product (2021-2032)
LIST OF FIGURES
Figure 1. Market Scope
Figure 2. Pricing Forecasts Per Unit, 2023- 2032
Figure 3. Porter’s Five Forces
Figure 4. Global Milk and Butter Market Revenue (USD Million) By Regions (2021-2032)
Figure 5. Global Milk and Butter Market Share (%) By Regions (2023)
Figure 6. North America Milk and Butter Revenue (USD Million) By Country (2021-2032)
Figure 7. United States Milk and Butter Revenue (USD Million) By Country (2021-2032)
Figure 8. Canada Milk and Butter Revenue (USD Million) By Country (2021-2032)
Figure 9. Mexico Milk and Butter Revenue (USD Million) By Country (2021-2032)
Figure 10. Europe Milk and Butter Revenue (USD Million) By Country (2021-2032)
Figure 11. Germany Milk and Butter Revenue (USD Million) By Country (2021-2032)
Figure 12. France Milk and Butter Revenue (USD Million) By Country (2021-2032)
Figure 13. United Kingdom Milk and Butter Revenue (USD Million) By Country (2021-2032)
Figure 14. Spain Milk and Butter Revenue (USD Million) By Country (2021-2032)
Figure 15. Italy Milk and Butter Revenue (USD Million) By Country (2021-2032)
Figure 16. Russia Milk and Butter Revenue (USD Million) By Country (2021-2032)
Figure 17. Rest of Europe Milk and Butter Revenue (USD Million) By Country (2021-2032)
Figure 11. Asia Pacific Milk and Butter Revenue (USD Million) By Country (2021-2032)
Figure 12. China Milk and Butter Revenue (USD Million) By Country (2021-2032)
Figure 13. Japan Milk and Butter Revenue (USD Million) By Country (2021-2032)
Figure 14. India Milk and Butter Revenue (USD Million) By Country (2021-2032)
Figure 15. South Korea Milk and Butter Revenue (USD Million) By Country (2021-2032)
Figure 16. Australia Milk and Butter Revenue (USD Million) By Country (2021-2032)
Figure 17. South East Asia Milk and Butter Revenue (USD Million) By Country (2021-2032)
Figure 18. South America Milk and Butter Revenue (USD Million) By Country (2021-2032)
Figure 19. Brazil Milk and Butter Revenue (USD Million) By Country (2021-2032)
Figure 20. Argentina Milk and Butter Revenue (USD Million) By Country (2021-2032)
Figure 21. Rest of Asia Pacific Milk and Butter Revenue (USD Million) By Country (2021-2032)
Figure 22. Middle East and Africa Milk and Butter Revenue (USD Million) By Region (2021-2032)
Figure 23. Saudi Arabia Milk and Butter Revenue (USD Million) By Region (2021-2032)
Figure 24. The UAE Milk and Butter Revenue (USD Million) By Region (2021-2032)
Figure 25. Rest of Middle East Milk and Butter Revenue (USD Million) By Region (2021-2032)
Figure 26. South Africa Milk and Butter Revenue (USD Million) By Region (2021-2032)
Figure 27. Africa Milk and Butter Revenue (USD Million) By Region (2021-2032)
Figure 28. North America Milk and Butter Revenue (USD Million) By Type (2021-2032)
Figure 29. North America Milk and Butter Revenue (USD Million) By Application (2021-2032)
Figure 30. North America Milk and Butter Revenue (USD Million) By Product (2021-2032)
Figure 31. Europe Milk and Butter Revenue (USD Million) By Type (2021-2032)
Figure 32. Europe Milk and Butter Revenue (USD Million) By Application (2021-2032)
Figure 33. Europe Milk and Butter Revenue (USD Million) By Product (2021-2032)
Figure 34. Asia Pacific Milk and Butter Revenue (USD Million) By Type (2021-2032)
Figure 35. Asia Pacific Milk and Butter Revenue (USD Million) By Application (2021-2032)
Figure 36. Asia Pacific Milk and Butter Revenue (USD Million) By Product (2021-2032)
Figure 37. South America Milk and Butter Revenue (USD Million) By Type (2021-2032)
Figure 38. South America Milk and Butter Revenue (USD Million) By Application (2021-2032)
Figure 39. South America Milk and Butter Revenue (USD Million) By Product (2021-2032)
Figure 40. Middle East and Africa Milk and Butter Revenue (USD Million) By Type (2021-2032)
Figure 41. Middle East and Africa Milk and Butter Revenue (USD Million) By Application (2021-2032)
Figure 42. Middle East and Africa Milk and Butter Revenue (USD Million) By Product (2021-2032)
By Type
Milk
Butter
By Application
Food
Beverages
Intermediate Products
Condiments
Others
By Packaging
Bottles
Pouches
Tins
Others
By Sales Channel
Online
Offline
Countries Analyzed
North America (US, Canada, Mexico)
Europe (Germany, UK, France, Spain, Italy, Russia, Rest of Europe)
Asia Pacific (China, India, Japan, South Korea, Australia, South East Asia, Rest of Asia)
South America (Brazil, Argentina, Rest of South America)
Middle East and Africa (Saudi Arabia, UAE, Rest of Middle East, South Africa, Egypt, Rest of Africa)
