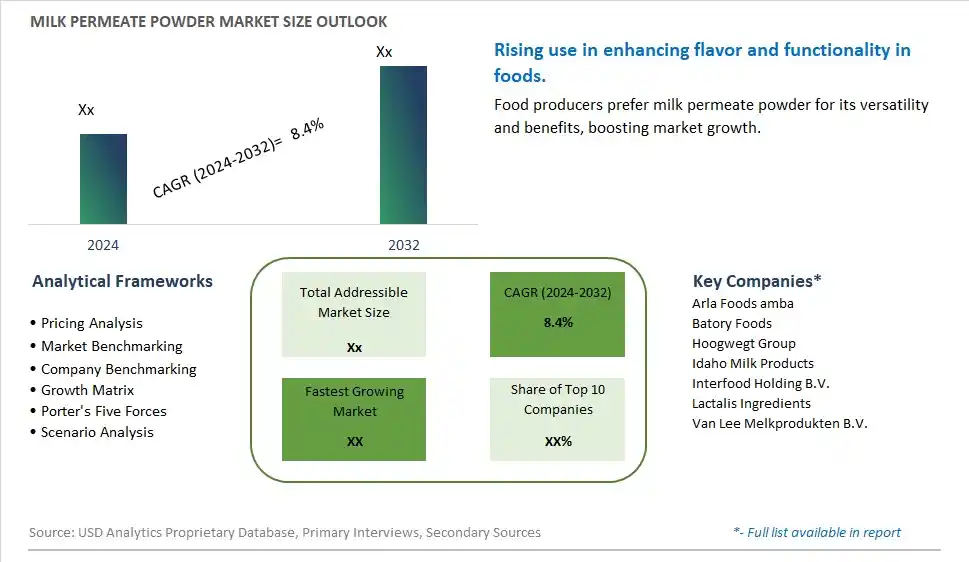
Global Milk Permeate Powder Market Size is valued at $XX Million in 2024 and is forecast to register a growth rate (CAGR) of 8.4% to reach $XX Million by 2032.
The global Milk Permeate Powder Market Comprehensive Study analyzes and forecasts the market size across 6 regions and 24 countries for diverse segments -By Type (Bagged, Bottled), By Application (Confectioneries, Beverages, Dairy Food, Baked Goods, Others)
An Introduction to Milk Permeate Powder Market
The milk permeate powder market in 2024 is thriving, fueled by the demand for cost-effective dairy ingredients that offer functional benefits in food and beverage applications. Milk permeate powder, a byproduct of whey protein and milk powder production, is used as a dairy solid in various formulations. The market benefits from innovations in dairy processing and permeate powder production that enhance product quality and application versatility. The trend towards clean label and natural ingredients is influencing product development. Increasing demand for functional dairy ingredients and the popularity of cost-effective alternatives in food manufacturing are further supporting market growth.
Milk Permeate Powder Competitive Landscape
The market report analyses the leading companies in the industry including Arla Foods amba, Batory Foods, Hoogwegt Group, Idaho Milk Products, Interfood Holding B.V., Lactalis Ingredients, Van Lee Melkprodukten B.V., and Others.
Milk Permeate Powder Market Dynamics
Milk Permeate Powder Market Trend: Growing Use in Food and Beverage Applications
The most prominent trend in the Milk Permeate Powder Market is the growing use in food and beverage applications. Milk permeate powder, a byproduct of milk protein and lactose extraction, is increasingly used as a functional ingredient in various products, including bakery, confectionery, and beverages, driven by its cost-effectiveness and nutritional benefits.
Milk Permeate Powder Market Driver: Growth of the Processed Food Industry
A key driver in the Milk Permeate Powder Market is the growth of the processed food industry. As the demand for convenience foods and ready-to-eat meals continues to rise, there is an increasing need for functional ingredients that enhance the quality and affordability of these products. Milk permeate powder, which offers versatility and nutritional value, caters to this demand and supports market growth.
Milk Permeate Powder Market Opportunity: Expansion into Animal Feed and Fertilizer Applications
One significant opportunity in the Milk Permeate Powder Market lies in the expansion into animal feed and fertilizer applications. Companies can innovate by developing milk permeate powder products tailored for use in livestock nutrition and agricultural fertilizers, leveraging its nutritional and functional properties. By diversifying the application areas, manufacturers can attract a broader customer base and drive market growth.
Milk Permeate Powder Market Share Analysis- Largest Segment by Type
In the Milk Permeate Powder Market, the Bagged segment is the largest by type. Bagged milk permeate powder is preferred for its convenience, cost-effectiveness, and ease of handling, making it the dominant packaging option in the market. This format is widely used in bulk applications and industrial processes, where large quantities of milk permeate powder are required. The segment's large size is further supported by the increasing demand for milk permeate powder in various applications, such as dairy food production, confectioneries, and baked goods. Additionally, the bagged format allows for efficient storage and transportation, contributing to its widespread adoption in the dairy industry.
Milk Permeate Powder Market Share Analysis- Fastest Growing Segment by Application
In the Milk Permeate Powder Market, the Beverages application segment is poised to grow the fastest over the next five years. This rapid growth is driven by the rising demand for fortified and functional beverages that incorporate milk permeate powder to enhance nutritional content and improve texture. The trend towards healthier and protein-enriched beverages, along with innovations in beverage formulations, fuels the increasing use of milk permeate powder. Additionally, the expansion of the ready-to-drink beverage market and the introduction of new product lines that leverage milk permeate powder's functional properties contribute to the segment's accelerated growth.
Milk Permeate Powder Market Segmentation
By Type
Bagged
Bottled
By Application
Confectioneries
Beverages
Dairy Food
Baked Goods
Others
Countries Analyzed
North America (US, Canada, Mexico)
Europe (Germany, UK, France, Spain, Italy, Russia, Rest of Europe)
Asia Pacific (China, India, Japan, South Korea, Australia, South East Asia, Rest of Asia)
South America (Brazil, Argentina, Rest of South America)
Middle East and Africa (Saudi Arabia, UAE, Rest of Middle East, South Africa, Egypt, Rest of Africa)
Milk Permeate Powder Companies Profiled in the Study
Arla Foods amba
Batory Foods
Hoogwegt Group
Idaho Milk Products
Interfood Holding B.V.
Lactalis Ingredients
Van Lee Melkprodukten B.V.
*- List Not Exhaustive
Chapter 1. TABLE OF CONTENTS
Chapter 2. Introduction to Milk Permeate Powder Market
2.1. Market Overview
2.2. Key Statistics and Report Highlights
2.3. Scope of the Comprehensive Study
2.3.1. Market Definition
2.3.2 Countries and Regions Covered
2.3.3 Research Objective
2.3.4 Units, Currency, and Conversions
2.3.5 Industry Value Chain
2.4. Key Market Segments
2.5. Key Companies
2.6. Study Period
Chapter 3. Strategic Analysis Review
3.1. Milk Permeate Powder Pricing Analysis and Forecast
3.2. Porter’s Five Forces
3.3. Market Ecosystem
3.4. SWOT Analysis
3.5. Regulatory Scenario
3.3. Effects of Inflation, Russia-Ukraine War, moderating economic growth, and other macroeconomic factors
Chapter 4. Competitive Landscape
4.1. Market Share Analysis
4.1.1. Global Milk Permeate Powder Market Share by Company, 2023
4.1.2. Product Offerings of Leading Milk Permeate Powder Companies
4.2. Market Entropy
4.2.1. New Product Launches in the Industry
4.2.2. Mergers, Acquisitions, Joint ventures, and Partnerships
4.3. Key Strategies and Best Practices
Chapter 5. Global Market Projections: Best, Reference, and Low Case Scenarios
5.1. Growth Analysis- Case Scenario Definitions
5.2. Low Growth Case Scenario Forecasts
5.3. Reference Growth Case Scenario Forecasts
5.4. High Growth Case Scenario Forecasts
Chapter 6. Market Dynamics
6.1. Milk Permeate Powder Market Drivers
6.2. Milk Permeate Powder Market Challenges
6.6. Milk Permeate Powder Market Opportunities
6.4. Milk Permeate Powder Market Trends
Chapter 7. Global Milk Permeate Powder Market Outlook Trends
7.1. Global Milk Permeate Powder Revenue (USD Million) and CAGR (%) by Type (2021-2032)
7.2. Global Milk Permeate Powder Revenue (USD Million) and CAGR (%) by Application (2021-2032)
7.3. Global Milk Permeate Powder Revenue (USD Million) and CAGR (%) by Product (2021-2032)
By Type
Bagged
Bottled
By Application
Confectioneries
Beverages
Dairy Food
Baked Goods
Others
Chapter 8. Global Milk Permeate Powder Regional Analysis and Outlook
8.1. Global Milk Permeate Powder Revenue (USD Million) By Regions (2021- 2032)
8.2. North America Milk Permeate Powder Revenue (USD Million) by Country (2021-2032)
8.2.1. United States Milk Permeate Powder Regional Analysis and Outlook
8.2.2. Canada Milk Permeate Powder Regional Analysis and Outlook
8.2.3. Mexico Milk Permeate Powder Regional Analysis and Outlook
8.3. Europe Milk Permeate Powder Revenue (USD Million), by Country (2021-2032)
8.3.1. Germany Milk Permeate Powder Regional Analysis and Outlook
8.3.2. France Milk Permeate Powder Regional Analysis and Outlook
8.3.3. United Kingdom Milk Permeate Powder Regional Analysis and Outlook
8.3.4. Spain Milk Permeate Powder Regional Analysis and Outlook
8.3.5. Italy Milk Permeate Powder Regional Analysis and Outlook
8.3.6. Russia Milk Permeate Powder Regional Analysis and Outlook
8.3.7. Rest of Europe Milk Permeate Powder Regional Analysis and Outlook
8.4. Asia Pacific Milk Permeate Powder Revenue (USD Million) by Country (2021-2032)
8.4.1. China Milk Permeate Powder Regional Analysis and Outlook
8.4.2. Japan Milk Permeate Powder Regional Analysis and Outlook
8.4.3. India Milk Permeate Powder Regional Analysis and Outlook
8.4.4. South Korea Milk Permeate Powder Regional Analysis and Outlook
8.4.5. Australia Milk Permeate Powder Regional Analysis and Outlook
8.4.6. South East Asia Milk Permeate Powder Regional Analysis and Outlook
8.4.7. Rest of Asia Pacific Milk Permeate Powder Regional Analysis and Outlook
8.5. South America Milk Permeate Powder Revenue (USD Million), by Country (2021-2032)
8.5.1. Brazil Milk Permeate Powder Regional Analysis and Outlook
8.5.2. Argentina Milk Permeate Powder Regional Analysis and Outlook
8.5.3. Rest of South America Milk Permeate Powder Regional Analysis and Outlook
8.6. Middle East and Africa Milk Permeate Powder Revenue (USD Million) by Country (2021-2032)
8.6.1. Middle East Milk Permeate Powder Regional Analysis and Outlook
8.6.2. Africa Milk Permeate Powder Regional Analysis and Outlook
Chapter 9. North America Milk Permeate Powder Analysis and Outlook
9.1. North America Milk Permeate Powder Revenue (USD Million) by Segments (2021-2032)
9.1.1. North America Milk Permeate Powder Revenue (USD Million) by Type (2021-2032)
9.1.2. North America Milk Permeate Powder Revenue (USD Million) by Application (2021-2032)
9.1.3. North America Milk Permeate Powder Revenue (USD Million) by Product (2021-2032)
By Type
Bagged
Bottled
By Application
Confectioneries
Beverages
Dairy Food
Baked Goods
Others
Chapter 10. Europe Milk Permeate Powder Analysis and Outlook
10.1. Europe Milk Permeate Powder Revenue (USD Million), by Segments (USD Million) (2021-2032)
10.1.1. Europe Milk Permeate Powder Revenue (USD Million) by Type (2021-2032)
10.1.2. Europe Milk Permeate Powder Revenue (USD Million) by Application (2021-2032)
10.1.3. Europe Milk Permeate Powder Revenue (USD Million) by Product (2021-2032)
By Type
Bagged
Bottled
By Application
Confectioneries
Beverages
Dairy Food
Baked Goods
Others
Chapter 11. Asia Pacific Milk Permeate Powder Analysis and Outlook
11.1. Asia Pacific Milk Permeate Powder Revenue (USD Million), and Revenue (USD Million) by Segments (2021-2032)
11.1.1. Asia Pacific Milk Permeate Powder Revenue (USD Million) by Type (2021-2032)
11.1.2. Asia Pacific Milk Permeate Powder Revenue (USD Million) by Application (2021-2032)
11.1.3. Asia Pacific Milk Permeate Powder Revenue (USD Million) by Product (2021-2032)
By Type
Bagged
Bottled
By Application
Confectioneries
Beverages
Dairy Food
Baked Goods
Others
Chapter 12. South America Milk Permeate Powder Analysis and Outlook
12.1. South America Milk Permeate Powder Revenue (USD Million), by Segments (2021-2032)
12.1.1. South America Milk Permeate Powder Revenue (USD Million) by Type (2021-2032)
12.1.2. South America Milk Permeate Powder Revenue (USD Million) by Application (2021-2032)
12.1.3. South America Milk Permeate Powder Revenue (USD Million) by Product (2021-2032)
By Type
Bagged
Bottled
By Application
Confectioneries
Beverages
Dairy Food
Baked Goods
Others
Chapter 13. Middle East and Africa Milk Permeate Powder Analysis and Outlook
13.1. Middle East and Africa Milk Permeate Powder Revenue (USD Million), by Segments (2021-2032)
13.1.1. Middle East and Africa Milk Permeate Powder Revenue (USD Million) by Type (2021-2032)
13.1.2. Middle East and Africa Milk Permeate Powder Revenue (USD Million) by Application (2021-2032)
13.1.3. Middle East and Africa Milk Permeate Powder Revenue (USD Million) by Product (2021-2032)
By Type
Bagged
Bottled
By Application
Confectioneries
Beverages
Dairy Food
Baked Goods
Others
Chapter 14. Milk Permeate Powder Company Profiles
14.1 Business Overview
14.2 Product Profiles
14.3 SWOT Profiles
14.5 Recent Developments
14.6 Financial Profile
List of Companies
Arla Foods amba
Batory Foods
Hoogwegt Group
Idaho Milk Products
Interfood Holding B.V.
Lactalis Ingredients
Van Lee Melkprodukten B.V.
15. Methodology and Data Sources
15.1 Customization Offerings
15.2 Subscription Services
15.3 Related Reports
15.4 Publisher Expertise
LIST OF TABLES
Table 1 Market Segmentation Analysis
Table 2 Global Milk Permeate Powder Market Share of Leading Companies, 2023
Table 3 Product Offerings of Leading Companies
Table 4 Low Growth Scenario Forecasts
Table 5 Reference Case Growth Scenario
Table 6 High Growth Case Scenario
Table 7 Global Milk Permeate Powder Revenue (USD Million) And CAGR (%) By Type (2021-2032)
Table 8 Global Milk Permeate Powder Revenue (USD Million) And CAGR (%) By Application (2021-2032)
Table 9 Global Milk Permeate Powder Revenue (USD Million) And CAGR (%) By Product (2021-2032)
Table 10 Global Milk Permeate Powder Market Revenue (USD Million) By Regions (2021-2032)
Table 11 Global Milk Permeate Powder Market Share (%) By Regions (2021-2032)
Table 12 North America Milk Permeate Powder Revenue (USD Million) By Country (2021-2032)
Table 13 Europe Milk Permeate Powder Revenue (USD Million) By Country (2021-2032)
Table 14 Asia Pacific Milk Permeate Powder Revenue (USD Million) By Country (2021-2032)
Table 15 South America Milk Permeate Powder Revenue (USD Million) By Country (2021-2032)
Table 16 Middle East and Africa Milk Permeate Powder Revenue (USD Million) By Region (2021-2032)
Table 17 North America Milk Permeate Powder Revenue (USD Million) By Type (2021-2032)
Table 18 North America Milk Permeate Powder Revenue (USD Million) By Application (2021-2032)
Table 19 North America Milk Permeate Powder Revenue (USD Million) By Product (2021-2032)
Table 20 Europe Milk Permeate Powder Revenue (USD Million) By Type (2021-2032)
Table 21 Europe Milk Permeate Powder Revenue (USD Million) By Application (2021-2032)
Table 22 Europe Milk Permeate Powder Revenue (USD Million) By Product (2021-2032)
Table 23 Asia Pacific Milk Permeate Powder Revenue (USD Million) By Type (2021-2032)
Table 24 Asia Pacific Milk Permeate Powder Revenue (USD Million) By Application (2021-2032)
Table 25 Asia Pacific Milk Permeate Powder Revenue (USD Million) By Product (2021-2032)
Table 26 South America Milk Permeate Powder Revenue (USD Million) By Type (2021-2032)
Table 27 South America Milk Permeate Powder Revenue (USD Million) By Application (2021-2032)
Table 28 South America Milk Permeate Powder Revenue (USD Million) By Product (2021-2032)
Table 29 Middle East and Africa Milk Permeate Powder Revenue (USD Million) By Type (2021-2032)
Table 30 Middle East and Africa Milk Permeate Powder Revenue (USD Million) By Application (2021-2032)
Table 31 Middle East and Africa Milk Permeate Powder Revenue (USD Million) By Product (2021-2032)
LIST OF FIGURES
Figure 1. Market Scope
Figure 2. Pricing Forecasts Per Unit, 2023- 2032
Figure 3. Porter’s Five Forces
Figure 4. Global Milk Permeate Powder Market Revenue (USD Million) By Regions (2021-2032)
Figure 5. Global Milk Permeate Powder Market Share (%) By Regions (2023)
Figure 6. North America Milk Permeate Powder Revenue (USD Million) By Country (2021-2032)
Figure 7. United States Milk Permeate Powder Revenue (USD Million) By Country (2021-2032)
Figure 8. Canada Milk Permeate Powder Revenue (USD Million) By Country (2021-2032)
Figure 9. Mexico Milk Permeate Powder Revenue (USD Million) By Country (2021-2032)
Figure 10. Europe Milk Permeate Powder Revenue (USD Million) By Country (2021-2032)
Figure 11. Germany Milk Permeate Powder Revenue (USD Million) By Country (2021-2032)
Figure 12. France Milk Permeate Powder Revenue (USD Million) By Country (2021-2032)
Figure 13. United Kingdom Milk Permeate Powder Revenue (USD Million) By Country (2021-2032)
Figure 14. Spain Milk Permeate Powder Revenue (USD Million) By Country (2021-2032)
Figure 15. Italy Milk Permeate Powder Revenue (USD Million) By Country (2021-2032)
Figure 16. Russia Milk Permeate Powder Revenue (USD Million) By Country (2021-2032)
Figure 17. Rest of Europe Milk Permeate Powder Revenue (USD Million) By Country (2021-2032)
Figure 11. Asia Pacific Milk Permeate Powder Revenue (USD Million) By Country (2021-2032)
Figure 12. China Milk Permeate Powder Revenue (USD Million) By Country (2021-2032)
Figure 13. Japan Milk Permeate Powder Revenue (USD Million) By Country (2021-2032)
Figure 14. India Milk Permeate Powder Revenue (USD Million) By Country (2021-2032)
Figure 15. South Korea Milk Permeate Powder Revenue (USD Million) By Country (2021-2032)
Figure 16. Australia Milk Permeate Powder Revenue (USD Million) By Country (2021-2032)
Figure 17. South East Asia Milk Permeate Powder Revenue (USD Million) By Country (2021-2032)
Figure 18. South America Milk Permeate Powder Revenue (USD Million) By Country (2021-2032)
Figure 19. Brazil Milk Permeate Powder Revenue (USD Million) By Country (2021-2032)
Figure 20. Argentina Milk Permeate Powder Revenue (USD Million) By Country (2021-2032)
Figure 21. Rest of Asia Pacific Milk Permeate Powder Revenue (USD Million) By Country (2021-2032)
Figure 22. Middle East and Africa Milk Permeate Powder Revenue (USD Million) By Region (2021-2032)
Figure 23. Saudi Arabia Milk Permeate Powder Revenue (USD Million) By Region (2021-2032)
Figure 24. The UAE Milk Permeate Powder Revenue (USD Million) By Region (2021-2032)
Figure 25. Rest of Middle East Milk Permeate Powder Revenue (USD Million) By Region (2021-2032)
Figure 26. South Africa Milk Permeate Powder Revenue (USD Million) By Region (2021-2032)
Figure 27. Africa Milk Permeate Powder Revenue (USD Million) By Region (2021-2032)
Figure 28. North America Milk Permeate Powder Revenue (USD Million) By Type (2021-2032)
Figure 29. North America Milk Permeate Powder Revenue (USD Million) By Application (2021-2032)
Figure 30. North America Milk Permeate Powder Revenue (USD Million) By Product (2021-2032)
Figure 31. Europe Milk Permeate Powder Revenue (USD Million) By Type (2021-2032)
Figure 32. Europe Milk Permeate Powder Revenue (USD Million) By Application (2021-2032)
Figure 33. Europe Milk Permeate Powder Revenue (USD Million) By Product (2021-2032)
Figure 34. Asia Pacific Milk Permeate Powder Revenue (USD Million) By Type (2021-2032)
Figure 35. Asia Pacific Milk Permeate Powder Revenue (USD Million) By Application (2021-2032)
Figure 36. Asia Pacific Milk Permeate Powder Revenue (USD Million) By Product (2021-2032)
Figure 37. South America Milk Permeate Powder Revenue (USD Million) By Type (2021-2032)
Figure 38. South America Milk Permeate Powder Revenue (USD Million) By Application (2021-2032)
Figure 39. South America Milk Permeate Powder Revenue (USD Million) By Product (2021-2032)
Figure 40. Middle East and Africa Milk Permeate Powder Revenue (USD Million) By Type (2021-2032)
Figure 41. Middle East and Africa Milk Permeate Powder Revenue (USD Million) By Application (2021-2032)
Figure 42. Middle East and Africa Milk Permeate Powder Revenue (USD Million) By Product (2021-2032)
By Type
Bagged
Bottled
By Application
Confectioneries
Beverages
Dairy Food
Baked Goods
Others
Countries Analyzed
North America (US, Canada, Mexico)
Europe (Germany, UK, France, Spain, Italy, Russia, Rest of Europe)
Asia Pacific (China, India, Japan, South Korea, Australia, South East Asia, Rest of Asia)
South America (Brazil, Argentina, Rest of South America)
Middle East and Africa (Saudi Arabia, UAE, Rest of Middle East, South Africa, Egypt, Rest of Africa)
