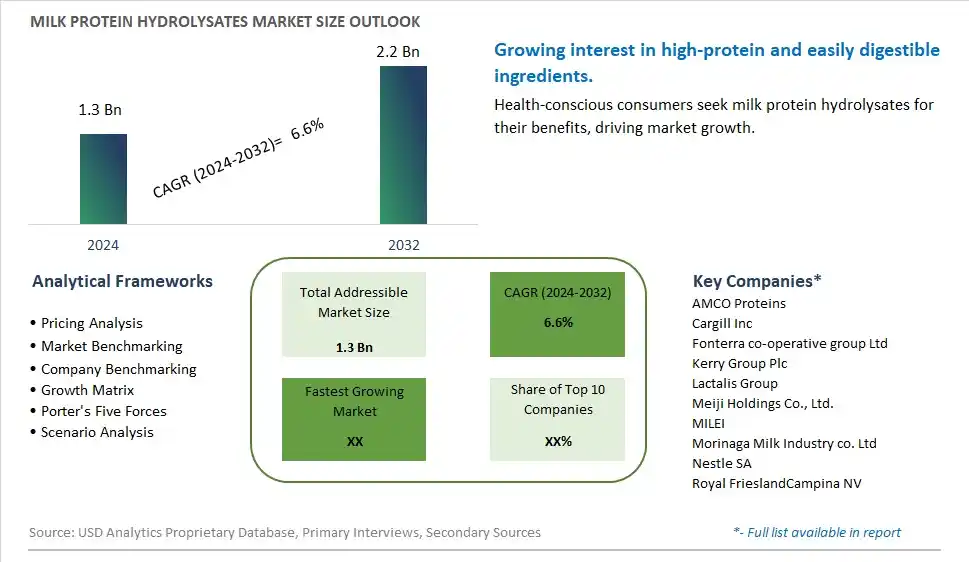
Global Milk Protein Hydrolysates Market Size is valued at $1.3 Billion in 2024 and is forecast to register a growth rate (CAGR) of 6.6% to reach $2.2 Billion by 2032.
The global Milk Protein Hydrolysates Market Comprehensive Study analyzes and forecasts the market size across 6 regions and 24 countries for diverse segments -By Form (Powder, Paste), By Product (Whey, Casein), By Technology (Acid Hydrolysis, Enzymatic Hydrolysis), By Application (Sports Nutrition, Clinical Nutrition, Infant Nutrition, Animal Feed)
An Introduction to Milk Protein Hydrolysates Market
In 2024, the milk protein hydrolysates market is expanding rapidly, driven by the demand for highly digestible and bioavailable protein ingredients in sports nutrition, infant formula, and medical nutrition. Milk protein hydrolysates, produced through enzymatic hydrolysis, offer improved absorption and reduced allergenicity. The market benefits from innovations in protein hydrolysis and formulation technologies that enhance product efficacy and application. The trend towards clean label and natural ingredients is influencing product development. Increasing consumer interest in high-protein diets, functional foods, and specialized nutrition products is further propelling market growth.
Milk Protein Hydrolysates Competitive Landscape
The market report analyses the leading companies in the industry including AMCO Proteins, Cargill Inc, Fonterra co-operative group Ltd, Kerry Group Plc, Lactalis Group, Meiji Holdings Co., Ltd., MILEI, Morinaga Milk Industry co. Ltd, Nestle SA, Royal FrieslandCampina NV, and Others.
Milk Protein Hydrolysates Market Dynamics
Milk Protein Hydrolysates Market Trend: Increasing Use in Sports and Clinical Nutrition
The most prominent trend in the Milk Protein Hydrolysates Market is the increasing use in sports and clinical nutrition. Milk protein hydrolysates, known for their rapid absorption and high bioavailability, are being incorporated into protein supplements and medical nutrition products, driven by consumer demand for high-quality protein sources.
Milk Protein Hydrolysates Market Driver: Health Benefits and Functional Properties
A key driver in the Milk Protein Hydrolysates Market is the health benefits and functional properties of hydrolyzed milk proteins. They are recognized for their potential to support muscle recovery, enhance immune function, and improve digestive health, boosting their demand in health-focused food products.
Milk Protein Hydrolysates Market Opportunity: Development of Specialty Protein Products
One significant opportunity in the Milk Protein Hydrolysates Market lies in the development of specialty protein products. Companies can innovate by creating hydrolyzed protein products tailored for specific dietary needs, such as infant nutrition, elderly care, and weight management. By offering diverse and targeted protein solutions, manufacturers can attract a broader consumer base and drive market growth.
Milk Protein Hydrolysates Market Share Analysis- Largest Segment by Form
In the Milk Protein Hydrolysates Market, the Powder form is the largest segment. Milk protein hydrolysates in powder form are highly favored for their versatility, ease of incorporation into various formulations, and extended shelf life. This format is widely used in dietary supplements, sports nutrition products, and infant formulas due to its convenient handling and effective dissolution in liquids. The powder form's dominance is also supported by its ability to provide a concentrated source of hydrolyzed proteins that meet the needs of various applications, from nutritional products to functional foods. Additionally, the growth of the fitness and wellness industry and increasing consumer preference for protein-enriched products further drive the demand for milk protein hydrolysate powders.
Milk Protein Hydrolysates Market Share Analysis- Fastest Growing Segment by Product
In the Milk Protein Hydrolysates Market, the Whey protein hydrolysates segment is poised to grow the fastest over the next five years. This anticipated growth is fueled by the rising demand for whey protein due to its superior digestibility, high-quality amino acid profile, and proven benefits for muscle recovery and overall health. Whey protein hydrolysates are particularly popular in sports nutrition, dietary supplements, and infant formulas due to their rapid absorption and effectiveness in promoting muscle synthesis and immune function. The segment's expansion is also supported by ongoing innovations in whey protein processing and the growing consumer awareness of the benefits of hydrolyzed whey proteins.
Milk Protein Hydrolysates Market Share Analysis- Largest Segment by Technology
In the Milk Protein Hydrolysates Market, the Enzymatic Hydrolysis segment is the largest by technology. Enzymatic hydrolysis is preferred due to its ability to produce high-quality hydrolysates with specific functional properties and controlled peptide profiles. This method ensures the production of milk protein hydrolysates that are highly bioavailable and effective in various applications, including infant formulas, clinical nutrition, and sports supplements. The segment's dominance is driven by the advantages of enzymatic hydrolysis, such as improved flavor, reduced bitterness, and enhanced functionality compared to acid hydrolysis. Additionally, the growing demand for customized protein hydrolysates and the advancement of enzyme technology contribute to the prominence of enzymatic hydrolysis in the market.
Milk Protein Hydrolysates Market Share Analysis- Fastest Growing Segment by Application
In the Milk Protein Hydrolysates Market, the Sports Nutrition application segment is poised to grow the fastest over the next five years. This growth is driven by the increasing consumer awareness of the benefits of protein hydrolysates in enhancing athletic performance, muscle recovery, and overall health. The demand for high-quality, easily digestible protein sources in sports supplements is rising, with athletes and fitness enthusiasts seeking advanced formulations that support their nutritional needs. The segment's expansion is also supported by the growing trend of personalized nutrition and the introduction of innovative sports nutrition products that leverage the functional benefits of milk protein hydrolysates. Additionally, the rise in fitness and wellness trends globally contributes to the rapid growth of this segment.
Milk Protein Hydrolysates Market Segmentation
By Form
Powder
Paste
By Product
Whey
Casein
By Technology
Acid Hydrolysis
Enzymatic Hydrolysis
By Application
Sports Nutrition
Clinical Nutrition
Infant Nutrition
Animal Feed
Countries Analyzed
North America (US, Canada, Mexico)
Europe (Germany, UK, France, Spain, Italy, Russia, Rest of Europe)
Asia Pacific (China, India, Japan, South Korea, Australia, South East Asia, Rest of Asia)
South America (Brazil, Argentina, Rest of South America)
Middle East and Africa (Saudi Arabia, UAE, Rest of Middle East, South Africa, Egypt, Rest of Africa)
Milk Protein Hydrolysates Companies Profiled in the Study
AMCO Proteins
Cargill Inc
Fonterra co-operative group Ltd
Kerry Group Plc
Lactalis Group
Meiji Holdings Co., Ltd.
MILEI
Morinaga Milk Industry co. Ltd
Nestle SA
Royal FrieslandCampina NV
*- List Not Exhaustive
Chapter 1. TABLE OF CONTENTS
Chapter 2. Introduction to Milk Protein Hydrolysates Market
2.1. Market Overview
2.2. Key Statistics and Report Highlights
2.3. Scope of the Comprehensive Study
2.3.1. Market Definition
2.3.2 Countries and Regions Covered
2.3.3 Research Objective
2.3.4 Units, Currency, and Conversions
2.3.5 Industry Value Chain
2.4. Key Market Segments
2.5. Key Companies
2.6. Study Period
Chapter 3. Strategic Analysis Review
3.1. Milk Protein Hydrolysates Pricing Analysis and Forecast
3.2. Porter’s Five Forces
3.3. Market Ecosystem
3.4. SWOT Analysis
3.5. Regulatory Scenario
3.3. Effects of Inflation, Russia-Ukraine War, moderating economic growth, and other macroeconomic factors
Chapter 4. Competitive Landscape
4.1. Market Share Analysis
4.1.1. Global Milk Protein Hydrolysates Market Share by Company, 2023
4.1.2. Product Offerings of Leading Milk Protein Hydrolysates Companies
4.2. Market Entropy
4.2.1. New Product Launches in the Industry
4.2.2. Mergers, Acquisitions, Joint ventures, and Partnerships
4.3. Key Strategies and Best Practices
Chapter 5. Global Market Projections: Best, Reference, and Low Case Scenarios
5.1. Growth Analysis- Case Scenario Definitions
5.2. Low Growth Case Scenario Forecasts
5.3. Reference Growth Case Scenario Forecasts
5.4. High Growth Case Scenario Forecasts
Chapter 6. Market Dynamics
6.1. Milk Protein Hydrolysates Market Drivers
6.2. Milk Protein Hydrolysates Market Challenges
6.6. Milk Protein Hydrolysates Market Opportunities
6.4. Milk Protein Hydrolysates Market Trends
Chapter 7. Global Milk Protein Hydrolysates Market Outlook Trends
7.1. Global Milk Protein Hydrolysates Revenue (USD Million) and CAGR (%) by Type (2021-2032)
7.2. Global Milk Protein Hydrolysates Revenue (USD Million) and CAGR (%) by Application (2021-2032)
7.3. Global Milk Protein Hydrolysates Revenue (USD Million) and CAGR (%) by Product (2021-2032)
By Form
Powder
Paste
By Product
Whey
Casein
By Technology
Acid Hydrolysis
Enzymatic Hydrolysis
By Application
Sports Nutrition
Clinical Nutrition
Infant Nutrition
Animal Feed
Chapter 8. Global Milk Protein Hydrolysates Regional Analysis and Outlook
8.1. Global Milk Protein Hydrolysates Revenue (USD Million) By Regions (2021- 2032)
8.2. North America Milk Protein Hydrolysates Revenue (USD Million) by Country (2021-2032)
8.2.1. United States Milk Protein Hydrolysates Regional Analysis and Outlook
8.2.2. Canada Milk Protein Hydrolysates Regional Analysis and Outlook
8.2.3. Mexico Milk Protein Hydrolysates Regional Analysis and Outlook
8.3. Europe Milk Protein Hydrolysates Revenue (USD Million), by Country (2021-2032)
8.3.1. Germany Milk Protein Hydrolysates Regional Analysis and Outlook
8.3.2. France Milk Protein Hydrolysates Regional Analysis and Outlook
8.3.3. United Kingdom Milk Protein Hydrolysates Regional Analysis and Outlook
8.3.4. Spain Milk Protein Hydrolysates Regional Analysis and Outlook
8.3.5. Italy Milk Protein Hydrolysates Regional Analysis and Outlook
8.3.6. Russia Milk Protein Hydrolysates Regional Analysis and Outlook
8.3.7. Rest of Europe Milk Protein Hydrolysates Regional Analysis and Outlook
8.4. Asia Pacific Milk Protein Hydrolysates Revenue (USD Million) by Country (2021-2032)
8.4.1. China Milk Protein Hydrolysates Regional Analysis and Outlook
8.4.2. Japan Milk Protein Hydrolysates Regional Analysis and Outlook
8.4.3. India Milk Protein Hydrolysates Regional Analysis and Outlook
8.4.4. South Korea Milk Protein Hydrolysates Regional Analysis and Outlook
8.4.5. Australia Milk Protein Hydrolysates Regional Analysis and Outlook
8.4.6. South East Asia Milk Protein Hydrolysates Regional Analysis and Outlook
8.4.7. Rest of Asia Pacific Milk Protein Hydrolysates Regional Analysis and Outlook
8.5. South America Milk Protein Hydrolysates Revenue (USD Million), by Country (2021-2032)
8.5.1. Brazil Milk Protein Hydrolysates Regional Analysis and Outlook
8.5.2. Argentina Milk Protein Hydrolysates Regional Analysis and Outlook
8.5.3. Rest of South America Milk Protein Hydrolysates Regional Analysis and Outlook
8.6. Middle East and Africa Milk Protein Hydrolysates Revenue (USD Million) by Country (2021-2032)
8.6.1. Middle East Milk Protein Hydrolysates Regional Analysis and Outlook
8.6.2. Africa Milk Protein Hydrolysates Regional Analysis and Outlook
Chapter 9. North America Milk Protein Hydrolysates Analysis and Outlook
9.1. North America Milk Protein Hydrolysates Revenue (USD Million) by Segments (2021-2032)
9.1.1. North America Milk Protein Hydrolysates Revenue (USD Million) by Type (2021-2032)
9.1.2. North America Milk Protein Hydrolysates Revenue (USD Million) by Application (2021-2032)
9.1.3. North America Milk Protein Hydrolysates Revenue (USD Million) by Product (2021-2032)
By Form
Powder
Paste
By Product
Whey
Casein
By Technology
Acid Hydrolysis
Enzymatic Hydrolysis
By Application
Sports Nutrition
Clinical Nutrition
Infant Nutrition
Animal Feed
Chapter 10. Europe Milk Protein Hydrolysates Analysis and Outlook
10.1. Europe Milk Protein Hydrolysates Revenue (USD Million), by Segments (USD Million) (2021-2032)
10.1.1. Europe Milk Protein Hydrolysates Revenue (USD Million) by Type (2021-2032)
10.1.2. Europe Milk Protein Hydrolysates Revenue (USD Million) by Application (2021-2032)
10.1.3. Europe Milk Protein Hydrolysates Revenue (USD Million) by Product (2021-2032)
By Form
Powder
Paste
By Product
Whey
Casein
By Technology
Acid Hydrolysis
Enzymatic Hydrolysis
By Application
Sports Nutrition
Clinical Nutrition
Infant Nutrition
Animal Feed
Chapter 11. Asia Pacific Milk Protein Hydrolysates Analysis and Outlook
11.1. Asia Pacific Milk Protein Hydrolysates Revenue (USD Million), and Revenue (USD Million) by Segments (2021-2032)
11.1.1. Asia Pacific Milk Protein Hydrolysates Revenue (USD Million) by Type (2021-2032)
11.1.2. Asia Pacific Milk Protein Hydrolysates Revenue (USD Million) by Application (2021-2032)
11.1.3. Asia Pacific Milk Protein Hydrolysates Revenue (USD Million) by Product (2021-2032)
By Form
Powder
Paste
By Product
Whey
Casein
By Technology
Acid Hydrolysis
Enzymatic Hydrolysis
By Application
Sports Nutrition
Clinical Nutrition
Infant Nutrition
Animal Feed
Chapter 12. South America Milk Protein Hydrolysates Analysis and Outlook
12.1. South America Milk Protein Hydrolysates Revenue (USD Million), by Segments (2021-2032)
12.1.1. South America Milk Protein Hydrolysates Revenue (USD Million) by Type (2021-2032)
12.1.2. South America Milk Protein Hydrolysates Revenue (USD Million) by Application (2021-2032)
12.1.3. South America Milk Protein Hydrolysates Revenue (USD Million) by Product (2021-2032)
By Form
Powder
Paste
By Product
Whey
Casein
By Technology
Acid Hydrolysis
Enzymatic Hydrolysis
By Application
Sports Nutrition
Clinical Nutrition
Infant Nutrition
Animal Feed
Chapter 13. Middle East and Africa Milk Protein Hydrolysates Analysis and Outlook
13.1. Middle East and Africa Milk Protein Hydrolysates Revenue (USD Million), by Segments (2021-2032)
13.1.1. Middle East and Africa Milk Protein Hydrolysates Revenue (USD Million) by Type (2021-2032)
13.1.2. Middle East and Africa Milk Protein Hydrolysates Revenue (USD Million) by Application (2021-2032)
13.1.3. Middle East and Africa Milk Protein Hydrolysates Revenue (USD Million) by Product (2021-2032)
By Form
Powder
Paste
By Product
Whey
Casein
By Technology
Acid Hydrolysis
Enzymatic Hydrolysis
By Application
Sports Nutrition
Clinical Nutrition
Infant Nutrition
Animal Feed
Chapter 14. Milk Protein Hydrolysates Company Profiles
14.1 Business Overview
14.2 Product Profiles
14.3 SWOT Profiles
14.5 Recent Developments
14.6 Financial Profile
List of Companies
AMCO Proteins
Cargill Inc
Fonterra co-operative group Ltd
Kerry Group Plc
Lactalis Group
Meiji Holdings Co., Ltd.
MILEI
Morinaga Milk Industry co. Ltd
Nestle SA
Royal FrieslandCampina NV
15. Methodology and Data Sources
15.1 Customization Offerings
15.2 Subscription Services
15.3 Related Reports
15.4 Publisher Expertise
LIST OF TABLES
Table 1 Market Segmentation Analysis
Table 2 Global Milk Protein Hydrolysates Market Share of Leading Companies, 2023
Table 3 Product Offerings of Leading Companies
Table 4 Low Growth Scenario Forecasts
Table 5 Reference Case Growth Scenario
Table 6 High Growth Case Scenario
Table 7 Global Milk Protein Hydrolysates Revenue (USD Million) And CAGR (%) By Type (2021-2032)
Table 8 Global Milk Protein Hydrolysates Revenue (USD Million) And CAGR (%) By Application (2021-2032)
Table 9 Global Milk Protein Hydrolysates Revenue (USD Million) And CAGR (%) By Product (2021-2032)
Table 10 Global Milk Protein Hydrolysates Market Revenue (USD Million) By Regions (2021-2032)
Table 11 Global Milk Protein Hydrolysates Market Share (%) By Regions (2021-2032)
Table 12 North America Milk Protein Hydrolysates Revenue (USD Million) By Country (2021-2032)
Table 13 Europe Milk Protein Hydrolysates Revenue (USD Million) By Country (2021-2032)
Table 14 Asia Pacific Milk Protein Hydrolysates Revenue (USD Million) By Country (2021-2032)
Table 15 South America Milk Protein Hydrolysates Revenue (USD Million) By Country (2021-2032)
Table 16 Middle East and Africa Milk Protein Hydrolysates Revenue (USD Million) By Region (2021-2032)
Table 17 North America Milk Protein Hydrolysates Revenue (USD Million) By Type (2021-2032)
Table 18 North America Milk Protein Hydrolysates Revenue (USD Million) By Application (2021-2032)
Table 19 North America Milk Protein Hydrolysates Revenue (USD Million) By Product (2021-2032)
Table 20 Europe Milk Protein Hydrolysates Revenue (USD Million) By Type (2021-2032)
Table 21 Europe Milk Protein Hydrolysates Revenue (USD Million) By Application (2021-2032)
Table 22 Europe Milk Protein Hydrolysates Revenue (USD Million) By Product (2021-2032)
Table 23 Asia Pacific Milk Protein Hydrolysates Revenue (USD Million) By Type (2021-2032)
Table 24 Asia Pacific Milk Protein Hydrolysates Revenue (USD Million) By Application (2021-2032)
Table 25 Asia Pacific Milk Protein Hydrolysates Revenue (USD Million) By Product (2021-2032)
Table 26 South America Milk Protein Hydrolysates Revenue (USD Million) By Type (2021-2032)
Table 27 South America Milk Protein Hydrolysates Revenue (USD Million) By Application (2021-2032)
Table 28 South America Milk Protein Hydrolysates Revenue (USD Million) By Product (2021-2032)
Table 29 Middle East and Africa Milk Protein Hydrolysates Revenue (USD Million) By Type (2021-2032)
Table 30 Middle East and Africa Milk Protein Hydrolysates Revenue (USD Million) By Application (2021-2032)
Table 31 Middle East and Africa Milk Protein Hydrolysates Revenue (USD Million) By Product (2021-2032)
LIST OF FIGURES
Figure 1. Market Scope
Figure 2. Pricing Forecasts Per Unit, 2023- 2032
Figure 3. Porter’s Five Forces
Figure 4. Global Milk Protein Hydrolysates Market Revenue (USD Million) By Regions (2021-2032)
Figure 5. Global Milk Protein Hydrolysates Market Share (%) By Regions (2023)
Figure 6. North America Milk Protein Hydrolysates Revenue (USD Million) By Country (2021-2032)
Figure 7. United States Milk Protein Hydrolysates Revenue (USD Million) By Country (2021-2032)
Figure 8. Canada Milk Protein Hydrolysates Revenue (USD Million) By Country (2021-2032)
Figure 9. Mexico Milk Protein Hydrolysates Revenue (USD Million) By Country (2021-2032)
Figure 10. Europe Milk Protein Hydrolysates Revenue (USD Million) By Country (2021-2032)
Figure 11. Germany Milk Protein Hydrolysates Revenue (USD Million) By Country (2021-2032)
Figure 12. France Milk Protein Hydrolysates Revenue (USD Million) By Country (2021-2032)
Figure 13. United Kingdom Milk Protein Hydrolysates Revenue (USD Million) By Country (2021-2032)
Figure 14. Spain Milk Protein Hydrolysates Revenue (USD Million) By Country (2021-2032)
Figure 15. Italy Milk Protein Hydrolysates Revenue (USD Million) By Country (2021-2032)
Figure 16. Russia Milk Protein Hydrolysates Revenue (USD Million) By Country (2021-2032)
Figure 17. Rest of Europe Milk Protein Hydrolysates Revenue (USD Million) By Country (2021-2032)
Figure 11. Asia Pacific Milk Protein Hydrolysates Revenue (USD Million) By Country (2021-2032)
Figure 12. China Milk Protein Hydrolysates Revenue (USD Million) By Country (2021-2032)
Figure 13. Japan Milk Protein Hydrolysates Revenue (USD Million) By Country (2021-2032)
Figure 14. India Milk Protein Hydrolysates Revenue (USD Million) By Country (2021-2032)
Figure 15. South Korea Milk Protein Hydrolysates Revenue (USD Million) By Country (2021-2032)
Figure 16. Australia Milk Protein Hydrolysates Revenue (USD Million) By Country (2021-2032)
Figure 17. South East Asia Milk Protein Hydrolysates Revenue (USD Million) By Country (2021-2032)
Figure 18. South America Milk Protein Hydrolysates Revenue (USD Million) By Country (2021-2032)
Figure 19. Brazil Milk Protein Hydrolysates Revenue (USD Million) By Country (2021-2032)
Figure 20. Argentina Milk Protein Hydrolysates Revenue (USD Million) By Country (2021-2032)
Figure 21. Rest of Asia Pacific Milk Protein Hydrolysates Revenue (USD Million) By Country (2021-2032)
Figure 22. Middle East and Africa Milk Protein Hydrolysates Revenue (USD Million) By Region (2021-2032)
Figure 23. Saudi Arabia Milk Protein Hydrolysates Revenue (USD Million) By Region (2021-2032)
Figure 24. The UAE Milk Protein Hydrolysates Revenue (USD Million) By Region (2021-2032)
Figure 25. Rest of Middle East Milk Protein Hydrolysates Revenue (USD Million) By Region (2021-2032)
Figure 26. South Africa Milk Protein Hydrolysates Revenue (USD Million) By Region (2021-2032)
Figure 27. Africa Milk Protein Hydrolysates Revenue (USD Million) By Region (2021-2032)
Figure 28. North America Milk Protein Hydrolysates Revenue (USD Million) By Type (2021-2032)
Figure 29. North America Milk Protein Hydrolysates Revenue (USD Million) By Application (2021-2032)
Figure 30. North America Milk Protein Hydrolysates Revenue (USD Million) By Product (2021-2032)
Figure 31. Europe Milk Protein Hydrolysates Revenue (USD Million) By Type (2021-2032)
Figure 32. Europe Milk Protein Hydrolysates Revenue (USD Million) By Application (2021-2032)
Figure 33. Europe Milk Protein Hydrolysates Revenue (USD Million) By Product (2021-2032)
Figure 34. Asia Pacific Milk Protein Hydrolysates Revenue (USD Million) By Type (2021-2032)
Figure 35. Asia Pacific Milk Protein Hydrolysates Revenue (USD Million) By Application (2021-2032)
Figure 36. Asia Pacific Milk Protein Hydrolysates Revenue (USD Million) By Product (2021-2032)
Figure 37. South America Milk Protein Hydrolysates Revenue (USD Million) By Type (2021-2032)
Figure 38. South America Milk Protein Hydrolysates Revenue (USD Million) By Application (2021-2032)
Figure 39. South America Milk Protein Hydrolysates Revenue (USD Million) By Product (2021-2032)
Figure 40. Middle East and Africa Milk Protein Hydrolysates Revenue (USD Million) By Type (2021-2032)
Figure 41. Middle East and Africa Milk Protein Hydrolysates Revenue (USD Million) By Application (2021-2032)
Figure 42. Middle East and Africa Milk Protein Hydrolysates Revenue (USD Million) By Product (2021-2032)
By Form
Powder
Paste
By Product
Whey
Casein
By Technology
Acid Hydrolysis
Enzymatic Hydrolysis
By Application
Sports Nutrition
Clinical Nutrition
Infant Nutrition
Animal Feed
Countries Analyzed
North America (US, Canada, Mexico)
Europe (Germany, UK, France, Spain, Italy, Russia, Rest of Europe)
Asia Pacific (China, India, Japan, South Korea, Australia, South East Asia, Rest of Asia)
South America (Brazil, Argentina, Rest of South America)
Middle East and Africa (Saudi Arabia, UAE, Rest of Middle East, South Africa, Egypt, Rest of Africa)
