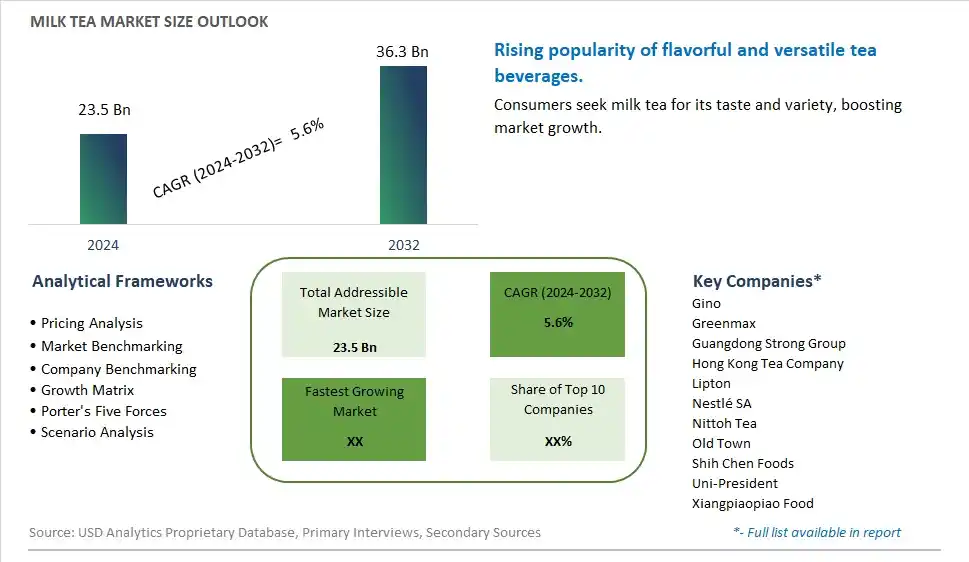
Global Milk Tea Market Size is valued at $23.5 Billion in 2024 and is forecast to register a growth rate (CAGR) of 5.6% to reach $36.3 Billion by 2032.
The global Milk Tea Market Comprehensive Study analyzes and forecasts the market size across 6 regions and 24 countries for diverse segments -By Type (Bagged Product, Disposable Paper Cups, Others), By Application (Supermarkets/ Hypermarkets, Tea Shops, Specialty Stores, Others)
An Introduction to Milk Tea Market
In 2024, the milk tea market is expanding rapidly, driven by the popularity of milk tea as a trendy and indulgent beverage. Milk tea, which combines brewed tea with milk and sweeteners, is enjoyed in various forms, including bubble tea, chai, and iced milk tea. The market benefits from innovations in tea blending and flavor development that enhance the taste and appeal of milk tea. The trend towards clean label and natural ingredients is influencing product development. Increasing consumer interest in unique and customizable beverages, along with the rise of specialty tea shops, is further propelling market growth.
Milk Tea Competitive Landscape
The market report analyses the leading companies in the industry including Gino, Greenmax, Guangdong Strong Group, Hong Kong Tea Company, Lipton, Nestlé SA, Nittoh Tea, Old Town, Shih Chen Foods, Uni-President, Xiangpiaopiao Food, and Others.
Milk Tea Market Dynamics
Milk Tea Market Trend: Rising Popularity of Specialty Tea Beverages
The most prominent trend in the Milk Tea Market is the rising popularity of specialty tea beverages. Consumers are seeking unique and flavorful milk tea options, such as bubble tea and chai lattes, driven by the desire for innovative and indulgent drink experiences.
Milk Tea Market Driver: Growth of the Beverage Industry
A key driver in the Milk Tea Market is the growth of the beverage industry. As the consumption of ready-to-drink beverages and specialty drinks continues to rise, there is an increasing demand for high-quality milk tea products that cater to diverse tastes and preferences.
Milk Tea Market Opportunity: Expansion into Health-Focused Milk Teas
One significant opportunity in the Milk Tea Market lies in the expansion into health-focused milk teas. Companies can innovate by developing milk tea products that offer functional benefits, such as reduced sugar, added protein, and herbal infusions. By offering diverse and health-conscious options, manufacturers can attract a broader consumer base and drive market growth.
Milk Tea Market Share Analysis- Largest Segment by Type
In the Milk Tea Market, the Bagged Product segment is the largest. This dominance is attributed to the convenience and affordability associated with bagged milk tea products. Bagged milk tea offers a cost-effective solution for consumers who prefer to prepare their milk tea at home, as it comes in pre-measured, easy-to-use tea bags that require minimal preparation. The widespread availability of bagged milk tea in retail outlets, coupled with its long shelf life and ease of storage, contributes to its leading position in the market. Additionally, the segment benefits from the popularity of DIY tea culture and the increasing demand for home-brewing options among consumers.
Milk Tea Market Share Analysis- Fastest Growing Segment by Application
In the Milk Tea Market, the Tea Shops application segment is poised to grow the fastest over the next five years. This rapid growth is driven by the increasing popularity of specialty tea shops that offer a wide range of milk tea options, including customized blends and unique flavors. The trend towards premium and artisanal tea experiences, coupled with the rise in consumer spending on gourmet beverages, fuels the expansion of tea shops. Additionally, the growing number of tea shops in urban areas and the convenience they offer for on-the-go consumption contribute to this segment's fast-paced growth. The proliferation of tea shop chains and franchises also plays a crucial role in boosting the segment's market share.
Milk Tea Market Segmentation
By Type
Bagged Product
Disposable Paper Cups
Others
By Application
Supermarkets/ Hypermarkets
Tea Shops
Specialty Stores
Others
Countries Analyzed
North America (US, Canada, Mexico)
Europe (Germany, UK, France, Spain, Italy, Russia, Rest of Europe)
Asia Pacific (China, India, Japan, South Korea, Australia, South East Asia, Rest of Asia)
South America (Brazil, Argentina, Rest of South America)
Middle East and Africa (Saudi Arabia, UAE, Rest of Middle East, South Africa, Egypt, Rest of Africa)
Milk Tea Companies Profiled in the Study
Gino
Greenmax
Guangdong Strong Group
Hong Kong Tea Company
Lipton
Nestlé SA
Nittoh Tea
Old Town
Shih Chen Foods
Uni-President
Xiangpiaopiao Food
*- List Not Exhaustive
Chapter 1. TABLE OF CONTENTS
Chapter 2. Introduction to Milk Tea Market
2.1. Market Overview
2.2. Key Statistics and Report Highlights
2.3. Scope of the Comprehensive Study
2.3.1. Market Definition
2.3.2 Countries and Regions Covered
2.3.3 Research Objective
2.3.4 Units, Currency, and Conversions
2.3.5 Industry Value Chain
2.4. Key Market Segments
2.5. Key Companies
2.6. Study Period
Chapter 3. Strategic Analysis Review
3.1. Milk Tea Pricing Analysis and Forecast
3.2. Porter’s Five Forces
3.3. Market Ecosystem
3.4. SWOT Analysis
3.5. Regulatory Scenario
3.3. Effects of Inflation, Russia-Ukraine War, moderating economic growth, and other macroeconomic factors
Chapter 4. Competitive Landscape
4.1. Market Share Analysis
4.1.1. Global Milk Tea Market Share by Company, 2023
4.1.2. Product Offerings of Leading Milk Tea Companies
4.2. Market Entropy
4.2.1. New Product Launches in the Industry
4.2.2. Mergers, Acquisitions, Joint ventures, and Partnerships
4.3. Key Strategies and Best Practices
Chapter 5. Global Market Projections: Best, Reference, and Low Case Scenarios
5.1. Growth Analysis- Case Scenario Definitions
5.2. Low Growth Case Scenario Forecasts
5.3. Reference Growth Case Scenario Forecasts
5.4. High Growth Case Scenario Forecasts
Chapter 6. Market Dynamics
6.1. Milk Tea Market Drivers
6.2. Milk Tea Market Challenges
6.6. Milk Tea Market Opportunities
6.4. Milk Tea Market Trends
Chapter 7. Global Milk Tea Market Outlook Trends
7.1. Global Milk Tea Revenue (USD Million) and CAGR (%) by Type (2021-2032)
7.2. Global Milk Tea Revenue (USD Million) and CAGR (%) by Application (2021-2032)
7.3. Global Milk Tea Revenue (USD Million) and CAGR (%) by Product (2021-2032)
By Type
Bagged Product
Disposable Paper Cups
Others
By Application
Supermarkets/ Hypermarkets
Tea Shops
Specialty Stores
Others
Chapter 8. Global Milk Tea Regional Analysis and Outlook
8.1. Global Milk Tea Revenue (USD Million) By Regions (2021- 2032)
8.2. North America Milk Tea Revenue (USD Million) by Country (2021-2032)
8.2.1. United States Milk Tea Regional Analysis and Outlook
8.2.2. Canada Milk Tea Regional Analysis and Outlook
8.2.3. Mexico Milk Tea Regional Analysis and Outlook
8.3. Europe Milk Tea Revenue (USD Million), by Country (2021-2032)
8.3.1. Germany Milk Tea Regional Analysis and Outlook
8.3.2. France Milk Tea Regional Analysis and Outlook
8.3.3. United Kingdom Milk Tea Regional Analysis and Outlook
8.3.4. Spain Milk Tea Regional Analysis and Outlook
8.3.5. Italy Milk Tea Regional Analysis and Outlook
8.3.6. Russia Milk Tea Regional Analysis and Outlook
8.3.7. Rest of Europe Milk Tea Regional Analysis and Outlook
8.4. Asia Pacific Milk Tea Revenue (USD Million) by Country (2021-2032)
8.4.1. China Milk Tea Regional Analysis and Outlook
8.4.2. Japan Milk Tea Regional Analysis and Outlook
8.4.3. India Milk Tea Regional Analysis and Outlook
8.4.4. South Korea Milk Tea Regional Analysis and Outlook
8.4.5. Australia Milk Tea Regional Analysis and Outlook
8.4.6. South East Asia Milk Tea Regional Analysis and Outlook
8.4.7. Rest of Asia Pacific Milk Tea Regional Analysis and Outlook
8.5. South America Milk Tea Revenue (USD Million), by Country (2021-2032)
8.5.1. Brazil Milk Tea Regional Analysis and Outlook
8.5.2. Argentina Milk Tea Regional Analysis and Outlook
8.5.3. Rest of South America Milk Tea Regional Analysis and Outlook
8.6. Middle East and Africa Milk Tea Revenue (USD Million) by Country (2021-2032)
8.6.1. Middle East Milk Tea Regional Analysis and Outlook
8.6.2. Africa Milk Tea Regional Analysis and Outlook
Chapter 9. North America Milk Tea Analysis and Outlook
9.1. North America Milk Tea Revenue (USD Million) by Segments (2021-2032)
9.1.1. North America Milk Tea Revenue (USD Million) by Type (2021-2032)
9.1.2. North America Milk Tea Revenue (USD Million) by Application (2021-2032)
9.1.3. North America Milk Tea Revenue (USD Million) by Product (2021-2032)
By Type
Bagged Product
Disposable Paper Cups
Others
By Application
Supermarkets/ Hypermarkets
Tea Shops
Specialty Stores
Others
Chapter 10. Europe Milk Tea Analysis and Outlook
10.1. Europe Milk Tea Revenue (USD Million), by Segments (USD Million) (2021-2032)
10.1.1. Europe Milk Tea Revenue (USD Million) by Type (2021-2032)
10.1.2. Europe Milk Tea Revenue (USD Million) by Application (2021-2032)
10.1.3. Europe Milk Tea Revenue (USD Million) by Product (2021-2032)
By Type
Bagged Product
Disposable Paper Cups
Others
By Application
Supermarkets/ Hypermarkets
Tea Shops
Specialty Stores
Others
Chapter 11. Asia Pacific Milk Tea Analysis and Outlook
11.1. Asia Pacific Milk Tea Revenue (USD Million), and Revenue (USD Million) by Segments (2021-2032)
11.1.1. Asia Pacific Milk Tea Revenue (USD Million) by Type (2021-2032)
11.1.2. Asia Pacific Milk Tea Revenue (USD Million) by Application (2021-2032)
11.1.3. Asia Pacific Milk Tea Revenue (USD Million) by Product (2021-2032)
By Type
Bagged Product
Disposable Paper Cups
Others
By Application
Supermarkets/ Hypermarkets
Tea Shops
Specialty Stores
Others
Chapter 12. South America Milk Tea Analysis and Outlook
12.1. South America Milk Tea Revenue (USD Million), by Segments (2021-2032)
12.1.1. South America Milk Tea Revenue (USD Million) by Type (2021-2032)
12.1.2. South America Milk Tea Revenue (USD Million) by Application (2021-2032)
12.1.3. South America Milk Tea Revenue (USD Million) by Product (2021-2032)
By Type
Bagged Product
Disposable Paper Cups
Others
By Application
Supermarkets/ Hypermarkets
Tea Shops
Specialty Stores
Others
Chapter 13. Middle East and Africa Milk Tea Analysis and Outlook
13.1. Middle East and Africa Milk Tea Revenue (USD Million), by Segments (2021-2032)
13.1.1. Middle East and Africa Milk Tea Revenue (USD Million) by Type (2021-2032)
13.1.2. Middle East and Africa Milk Tea Revenue (USD Million) by Application (2021-2032)
13.1.3. Middle East and Africa Milk Tea Revenue (USD Million) by Product (2021-2032)
By Type
Bagged Product
Disposable Paper Cups
Others
By Application
Supermarkets/ Hypermarkets
Tea Shops
Specialty Stores
Others
Chapter 14. Milk Tea Company Profiles
14.1 Business Overview
14.2 Product Profiles
14.3 SWOT Profiles
14.5 Recent Developments
14.6 Financial Profile
List of Companies
Gino
Greenmax
Guangdong Strong Group
Hong Kong Tea Company
Lipton
Nestlé SA
Nittoh Tea
Old Town
Shih Chen Foods
Uni-President
Xiangpiaopiao Food
15. Methodology and Data Sources
15.1 Customization Offerings
15.2 Subscription Services
15.3 Related Reports
15.4 Publisher Expertise
LIST OF TABLES
Table 1 Market Segmentation Analysis
Table 2 Global Milk Tea Market Share of Leading Companies, 2023
Table 3 Product Offerings of Leading Companies
Table 4 Low Growth Scenario Forecasts
Table 5 Reference Case Growth Scenario
Table 6 High Growth Case Scenario
Table 7 Global Milk Tea Revenue (USD Million) And CAGR (%) By Type (2021-2032)
Table 8 Global Milk Tea Revenue (USD Million) And CAGR (%) By Application (2021-2032)
Table 9 Global Milk Tea Revenue (USD Million) And CAGR (%) By Product (2021-2032)
Table 10 Global Milk Tea Market Revenue (USD Million) By Regions (2021-2032)
Table 11 Global Milk Tea Market Share (%) By Regions (2021-2032)
Table 12 North America Milk Tea Revenue (USD Million) By Country (2021-2032)
Table 13 Europe Milk Tea Revenue (USD Million) By Country (2021-2032)
Table 14 Asia Pacific Milk Tea Revenue (USD Million) By Country (2021-2032)
Table 15 South America Milk Tea Revenue (USD Million) By Country (2021-2032)
Table 16 Middle East and Africa Milk Tea Revenue (USD Million) By Region (2021-2032)
Table 17 North America Milk Tea Revenue (USD Million) By Type (2021-2032)
Table 18 North America Milk Tea Revenue (USD Million) By Application (2021-2032)
Table 19 North America Milk Tea Revenue (USD Million) By Product (2021-2032)
Table 20 Europe Milk Tea Revenue (USD Million) By Type (2021-2032)
Table 21 Europe Milk Tea Revenue (USD Million) By Application (2021-2032)
Table 22 Europe Milk Tea Revenue (USD Million) By Product (2021-2032)
Table 23 Asia Pacific Milk Tea Revenue (USD Million) By Type (2021-2032)
Table 24 Asia Pacific Milk Tea Revenue (USD Million) By Application (2021-2032)
Table 25 Asia Pacific Milk Tea Revenue (USD Million) By Product (2021-2032)
Table 26 South America Milk Tea Revenue (USD Million) By Type (2021-2032)
Table 27 South America Milk Tea Revenue (USD Million) By Application (2021-2032)
Table 28 South America Milk Tea Revenue (USD Million) By Product (2021-2032)
Table 29 Middle East and Africa Milk Tea Revenue (USD Million) By Type (2021-2032)
Table 30 Middle East and Africa Milk Tea Revenue (USD Million) By Application (2021-2032)
Table 31 Middle East and Africa Milk Tea Revenue (USD Million) By Product (2021-2032)
LIST OF FIGURES
Figure 1. Market Scope
Figure 2. Pricing Forecasts Per Unit, 2023- 2032
Figure 3. Porter’s Five Forces
Figure 4. Global Milk Tea Market Revenue (USD Million) By Regions (2021-2032)
Figure 5. Global Milk Tea Market Share (%) By Regions (2023)
Figure 6. North America Milk Tea Revenue (USD Million) By Country (2021-2032)
Figure 7. United States Milk Tea Revenue (USD Million) By Country (2021-2032)
Figure 8. Canada Milk Tea Revenue (USD Million) By Country (2021-2032)
Figure 9. Mexico Milk Tea Revenue (USD Million) By Country (2021-2032)
Figure 10. Europe Milk Tea Revenue (USD Million) By Country (2021-2032)
Figure 11. Germany Milk Tea Revenue (USD Million) By Country (2021-2032)
Figure 12. France Milk Tea Revenue (USD Million) By Country (2021-2032)
Figure 13. United Kingdom Milk Tea Revenue (USD Million) By Country (2021-2032)
Figure 14. Spain Milk Tea Revenue (USD Million) By Country (2021-2032)
Figure 15. Italy Milk Tea Revenue (USD Million) By Country (2021-2032)
Figure 16. Russia Milk Tea Revenue (USD Million) By Country (2021-2032)
Figure 17. Rest of Europe Milk Tea Revenue (USD Million) By Country (2021-2032)
Figure 11. Asia Pacific Milk Tea Revenue (USD Million) By Country (2021-2032)
Figure 12. China Milk Tea Revenue (USD Million) By Country (2021-2032)
Figure 13. Japan Milk Tea Revenue (USD Million) By Country (2021-2032)
Figure 14. India Milk Tea Revenue (USD Million) By Country (2021-2032)
Figure 15. South Korea Milk Tea Revenue (USD Million) By Country (2021-2032)
Figure 16. Australia Milk Tea Revenue (USD Million) By Country (2021-2032)
Figure 17. South East Asia Milk Tea Revenue (USD Million) By Country (2021-2032)
Figure 18. South America Milk Tea Revenue (USD Million) By Country (2021-2032)
Figure 19. Brazil Milk Tea Revenue (USD Million) By Country (2021-2032)
Figure 20. Argentina Milk Tea Revenue (USD Million) By Country (2021-2032)
Figure 21. Rest of Asia Pacific Milk Tea Revenue (USD Million) By Country (2021-2032)
Figure 22. Middle East and Africa Milk Tea Revenue (USD Million) By Region (2021-2032)
Figure 23. Saudi Arabia Milk Tea Revenue (USD Million) By Region (2021-2032)
Figure 24. The UAE Milk Tea Revenue (USD Million) By Region (2021-2032)
Figure 25. Rest of Middle East Milk Tea Revenue (USD Million) By Region (2021-2032)
Figure 26. South Africa Milk Tea Revenue (USD Million) By Region (2021-2032)
Figure 27. Africa Milk Tea Revenue (USD Million) By Region (2021-2032)
Figure 28. North America Milk Tea Revenue (USD Million) By Type (2021-2032)
Figure 29. North America Milk Tea Revenue (USD Million) By Application (2021-2032)
Figure 30. North America Milk Tea Revenue (USD Million) By Product (2021-2032)
Figure 31. Europe Milk Tea Revenue (USD Million) By Type (2021-2032)
Figure 32. Europe Milk Tea Revenue (USD Million) By Application (2021-2032)
Figure 33. Europe Milk Tea Revenue (USD Million) By Product (2021-2032)
Figure 34. Asia Pacific Milk Tea Revenue (USD Million) By Type (2021-2032)
Figure 35. Asia Pacific Milk Tea Revenue (USD Million) By Application (2021-2032)
Figure 36. Asia Pacific Milk Tea Revenue (USD Million) By Product (2021-2032)
Figure 37. South America Milk Tea Revenue (USD Million) By Type (2021-2032)
Figure 38. South America Milk Tea Revenue (USD Million) By Application (2021-2032)
Figure 39. South America Milk Tea Revenue (USD Million) By Product (2021-2032)
Figure 40. Middle East and Africa Milk Tea Revenue (USD Million) By Type (2021-2032)
Figure 41. Middle East and Africa Milk Tea Revenue (USD Million) By Application (2021-2032)
Figure 42. Middle East and Africa Milk Tea Revenue (USD Million) By Product (2021-2032)
By Type
Bagged Product
Disposable Paper Cups
Others
By Application
Supermarkets/ Hypermarkets
Tea Shops
Specialty Stores
Others
Countries Analyzed
North America (US, Canada, Mexico)
Europe (Germany, UK, France, Spain, Italy, Russia, Rest of Europe)
Asia Pacific (China, India, Japan, South Korea, Australia, South East Asia, Rest of Asia)
South America (Brazil, Argentina, Rest of South America)
Middle East and Africa (Saudi Arabia, UAE, Rest of Middle East, South Africa, Egypt, Rest of Africa)
