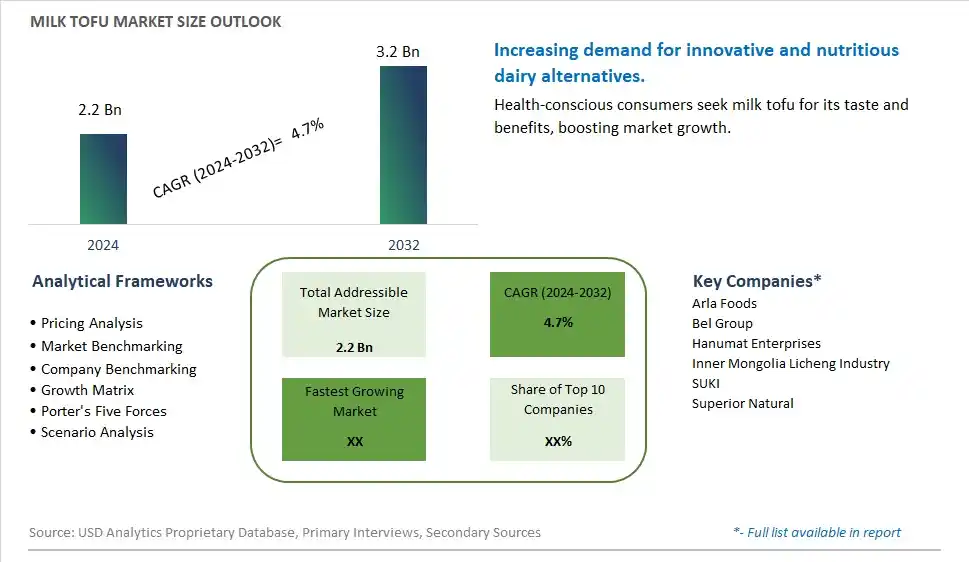
Global Milk Tofu Market Size is valued at $2.2 Billion in 2024 and is forecast to register a growth rate (CAGR) of 4.7% to reach $3.2 Billion by 2032.
The global Milk Tofu Market Comprehensive Study analyzes and forecasts the market size across 6 regions and 24 countries for diverse segments -By Type (Fresh Milk Tofu, Semi-dried Milk Tofu), By Application (Adults, Children)
An Introduction to Milk Tofu Market
In 2024, the milk tofu market is thriving, driven by the demand for innovative and nutritious plant-based protein alternatives. Milk tofu, also known as "tofu pudding," combines the creaminess of dairy with the nutritional benefits of tofu. The market benefits from advancements in food technology that enhance texture and flavor, making milk tofu appealing to a wide range of consumers. The trend towards clean label and natural ingredients is influencing product development. Increasing consumer interest in high-protein, low-fat foods and the popularity of fusion cuisine are further propelling market growth.
Milk Tofu Competitive Landscape
The market report analyses the leading companies in the industry including Arla Foods, Bel Group, Hanumat Enterprises, Inner Mongolia Licheng Industry, SUKI, Superior Natural, and Others.
Milk Tofu Market Dynamics
Milk Tofu Market Trend: Growing Interest in Plant-Based Dairy Alternatives
The most prominent trend in the Milk Tofu Market is the growing interest in plant-based dairy alternatives. Milk tofu, known for its smooth texture and versatility, is increasingly used as a substitute for traditional tofu and dairy products, driven by consumer demand for vegan and vegetarian options.
Milk Tofu Market Driver: Health Consciousness and Dietary Preferences
A key driver in the Milk Tofu Market is health consciousness and changing dietary preferences. As more individuals seek to reduce their consumption of animal products and improve their diet, there is a rising demand for plant-based foods that offer essential nutrients and health benefits.
Milk Tofu Market Opportunity: Expansion into Culinary Applications
One significant opportunity in the Milk Tofu Market lies in the expansion into culinary applications. Companies can innovate by developing milk tofu products that cater to different cuisines and culinary uses, such as desserts, soups, and stir-fries. By offering versatile and nutritious options, manufacturers can attract a broader consumer base and drive market growth.
Milk Tofu Market Share Analysis- Largest Segment by Type
In the Milk Tofu Market, the Fresh Milk Tofu segment is the largest. This dominance can be attributed to the preference for fresh tofu in various culinary applications due to its superior texture and flavor compared to semi-dried alternatives. Fresh milk tofu is often favored for its versatility in both savory and sweet dishes, and it is commonly used in traditional Asian cuisines as well as modern recipes. The segment's leading position is supported by consumer demand for high-quality, minimally processed products that retain their nutritional value and taste. The availability of fresh milk tofu in supermarkets and specialty stores further reinforces its prominence in the market.
Milk Tofu Market Share Analysis- Fastest Growing Segment by Application
In the Milk Tofu Market, the Children application segment is poised to grow the fastest over the next five years. This growth is driven by increasing consumer awareness of the nutritional benefits of milk tofu for children, including its protein content and digestive health benefits. As parents seek healthier and more diverse food options for their children, milk tofu is becoming a popular choice due to its mild flavor and versatility. The growing trend of incorporating plant-based and nutritious foods into children's diets, coupled with the introduction of child-friendly formulations and packaging, contributes to the rapid expansion of this segment.
Milk Tofu Market Segmentation
By Type
Fresh Milk Tofu
Semi-dried Milk Tofu
By Application
Adults
Children
Countries Analyzed
North America (US, Canada, Mexico)
Europe (Germany, UK, France, Spain, Italy, Russia, Rest of Europe)
Asia Pacific (China, India, Japan, South Korea, Australia, South East Asia, Rest of Asia)
South America (Brazil, Argentina, Rest of South America)
Middle East and Africa (Saudi Arabia, UAE, Rest of Middle East, South Africa, Egypt, Rest of Africa)
Milk Tofu Companies Profiled in the Study
Arla Foods
Bel Group
Hanumat Enterprises
Inner Mongolia Licheng Industry
SUKI
Superior Natural
*- List Not Exhaustive
Chapter 1. TABLE OF CONTENTS
Chapter 2. Introduction to Milk Tofu Market
2.1. Market Overview
2.2. Key Statistics and Report Highlights
2.3. Scope of the Comprehensive Study
2.3.1. Market Definition
2.3.2 Countries and Regions Covered
2.3.3 Research Objective
2.3.4 Units, Currency, and Conversions
2.3.5 Industry Value Chain
2.4. Key Market Segments
2.5. Key Companies
2.6. Study Period
Chapter 3. Strategic Analysis Review
3.1. Milk Tofu Pricing Analysis and Forecast
3.2. Porter’s Five Forces
3.3. Market Ecosystem
3.4. SWOT Analysis
3.5. Regulatory Scenario
3.3. Effects of Inflation, Russia-Ukraine War, moderating economic growth, and other macroeconomic factors
Chapter 4. Competitive Landscape
4.1. Market Share Analysis
4.1.1. Global Milk Tofu Market Share by Company, 2023
4.1.2. Product Offerings of Leading Milk Tofu Companies
4.2. Market Entropy
4.2.1. New Product Launches in the Industry
4.2.2. Mergers, Acquisitions, Joint ventures, and Partnerships
4.3. Key Strategies and Best Practices
Chapter 5. Global Market Projections: Best, Reference, and Low Case Scenarios
5.1. Growth Analysis- Case Scenario Definitions
5.2. Low Growth Case Scenario Forecasts
5.3. Reference Growth Case Scenario Forecasts
5.4. High Growth Case Scenario Forecasts
Chapter 6. Market Dynamics
6.1. Milk Tofu Market Drivers
6.2. Milk Tofu Market Challenges
6.6. Milk Tofu Market Opportunities
6.4. Milk Tofu Market Trends
Chapter 7. Global Milk Tofu Market Outlook Trends
7.1. Global Milk Tofu Revenue (USD Million) and CAGR (%) by Type (2021-2032)
7.2. Global Milk Tofu Revenue (USD Million) and CAGR (%) by Application (2021-2032)
7.3. Global Milk Tofu Revenue (USD Million) and CAGR (%) by Product (2021-2032)
By Type
Fresh Milk Tofu
Semi-dried Milk Tofu
By Application
Adults
Children
Chapter 8. Global Milk Tofu Regional Analysis and Outlook
8.1. Global Milk Tofu Revenue (USD Million) By Regions (2021- 2032)
8.2. North America Milk Tofu Revenue (USD Million) by Country (2021-2032)
8.2.1. United States Milk Tofu Regional Analysis and Outlook
8.2.2. Canada Milk Tofu Regional Analysis and Outlook
8.2.3. Mexico Milk Tofu Regional Analysis and Outlook
8.3. Europe Milk Tofu Revenue (USD Million), by Country (2021-2032)
8.3.1. Germany Milk Tofu Regional Analysis and Outlook
8.3.2. France Milk Tofu Regional Analysis and Outlook
8.3.3. United Kingdom Milk Tofu Regional Analysis and Outlook
8.3.4. Spain Milk Tofu Regional Analysis and Outlook
8.3.5. Italy Milk Tofu Regional Analysis and Outlook
8.3.6. Russia Milk Tofu Regional Analysis and Outlook
8.3.7. Rest of Europe Milk Tofu Regional Analysis and Outlook
8.4. Asia Pacific Milk Tofu Revenue (USD Million) by Country (2021-2032)
8.4.1. China Milk Tofu Regional Analysis and Outlook
8.4.2. Japan Milk Tofu Regional Analysis and Outlook
8.4.3. India Milk Tofu Regional Analysis and Outlook
8.4.4. South Korea Milk Tofu Regional Analysis and Outlook
8.4.5. Australia Milk Tofu Regional Analysis and Outlook
8.4.6. South East Asia Milk Tofu Regional Analysis and Outlook
8.4.7. Rest of Asia Pacific Milk Tofu Regional Analysis and Outlook
8.5. South America Milk Tofu Revenue (USD Million), by Country (2021-2032)
8.5.1. Brazil Milk Tofu Regional Analysis and Outlook
8.5.2. Argentina Milk Tofu Regional Analysis and Outlook
8.5.3. Rest of South America Milk Tofu Regional Analysis and Outlook
8.6. Middle East and Africa Milk Tofu Revenue (USD Million) by Country (2021-2032)
8.6.1. Middle East Milk Tofu Regional Analysis and Outlook
8.6.2. Africa Milk Tofu Regional Analysis and Outlook
Chapter 9. North America Milk Tofu Analysis and Outlook
9.1. North America Milk Tofu Revenue (USD Million) by Segments (2021-2032)
9.1.1. North America Milk Tofu Revenue (USD Million) by Type (2021-2032)
9.1.2. North America Milk Tofu Revenue (USD Million) by Application (2021-2032)
9.1.3. North America Milk Tofu Revenue (USD Million) by Product (2021-2032)
By Type
Fresh Milk Tofu
Semi-dried Milk Tofu
By Application
Adults
Children
Chapter 10. Europe Milk Tofu Analysis and Outlook
10.1. Europe Milk Tofu Revenue (USD Million), by Segments (USD Million) (2021-2032)
10.1.1. Europe Milk Tofu Revenue (USD Million) by Type (2021-2032)
10.1.2. Europe Milk Tofu Revenue (USD Million) by Application (2021-2032)
10.1.3. Europe Milk Tofu Revenue (USD Million) by Product (2021-2032)
By Type
Fresh Milk Tofu
Semi-dried Milk Tofu
By Application
Adults
Children
Chapter 11. Asia Pacific Milk Tofu Analysis and Outlook
11.1. Asia Pacific Milk Tofu Revenue (USD Million), and Revenue (USD Million) by Segments (2021-2032)
11.1.1. Asia Pacific Milk Tofu Revenue (USD Million) by Type (2021-2032)
11.1.2. Asia Pacific Milk Tofu Revenue (USD Million) by Application (2021-2032)
11.1.3. Asia Pacific Milk Tofu Revenue (USD Million) by Product (2021-2032)
By Type
Fresh Milk Tofu
Semi-dried Milk Tofu
By Application
Adults
Children
Chapter 12. South America Milk Tofu Analysis and Outlook
12.1. South America Milk Tofu Revenue (USD Million), by Segments (2021-2032)
12.1.1. South America Milk Tofu Revenue (USD Million) by Type (2021-2032)
12.1.2. South America Milk Tofu Revenue (USD Million) by Application (2021-2032)
12.1.3. South America Milk Tofu Revenue (USD Million) by Product (2021-2032)
By Type
Fresh Milk Tofu
Semi-dried Milk Tofu
By Application
Adults
Children
Chapter 13. Middle East and Africa Milk Tofu Analysis and Outlook
13.1. Middle East and Africa Milk Tofu Revenue (USD Million), by Segments (2021-2032)
13.1.1. Middle East and Africa Milk Tofu Revenue (USD Million) by Type (2021-2032)
13.1.2. Middle East and Africa Milk Tofu Revenue (USD Million) by Application (2021-2032)
13.1.3. Middle East and Africa Milk Tofu Revenue (USD Million) by Product (2021-2032)
By Type
Fresh Milk Tofu
Semi-dried Milk Tofu
By Application
Adults
Children
Chapter 14. Milk Tofu Company Profiles
14.1 Business Overview
14.2 Product Profiles
14.3 SWOT Profiles
14.5 Recent Developments
14.6 Financial Profile
List of Companies
Arla Foods
Bel Group
Hanumat Enterprises
Inner Mongolia Licheng Industry
SUKI
Superior Natural
15. Methodology and Data Sources
15.1 Customization Offerings
15.2 Subscription Services
15.3 Related Reports
15.4 Publisher Expertise
LIST OF TABLES
Table 1 Market Segmentation Analysis
Table 2 Global Milk Tofu Market Share of Leading Companies, 2023
Table 3 Product Offerings of Leading Companies
Table 4 Low Growth Scenario Forecasts
Table 5 Reference Case Growth Scenario
Table 6 High Growth Case Scenario
Table 7 Global Milk Tofu Revenue (USD Million) And CAGR (%) By Type (2021-2032)
Table 8 Global Milk Tofu Revenue (USD Million) And CAGR (%) By Application (2021-2032)
Table 9 Global Milk Tofu Revenue (USD Million) And CAGR (%) By Product (2021-2032)
Table 10 Global Milk Tofu Market Revenue (USD Million) By Regions (2021-2032)
Table 11 Global Milk Tofu Market Share (%) By Regions (2021-2032)
Table 12 North America Milk Tofu Revenue (USD Million) By Country (2021-2032)
Table 13 Europe Milk Tofu Revenue (USD Million) By Country (2021-2032)
Table 14 Asia Pacific Milk Tofu Revenue (USD Million) By Country (2021-2032)
Table 15 South America Milk Tofu Revenue (USD Million) By Country (2021-2032)
Table 16 Middle East and Africa Milk Tofu Revenue (USD Million) By Region (2021-2032)
Table 17 North America Milk Tofu Revenue (USD Million) By Type (2021-2032)
Table 18 North America Milk Tofu Revenue (USD Million) By Application (2021-2032)
Table 19 North America Milk Tofu Revenue (USD Million) By Product (2021-2032)
Table 20 Europe Milk Tofu Revenue (USD Million) By Type (2021-2032)
Table 21 Europe Milk Tofu Revenue (USD Million) By Application (2021-2032)
Table 22 Europe Milk Tofu Revenue (USD Million) By Product (2021-2032)
Table 23 Asia Pacific Milk Tofu Revenue (USD Million) By Type (2021-2032)
Table 24 Asia Pacific Milk Tofu Revenue (USD Million) By Application (2021-2032)
Table 25 Asia Pacific Milk Tofu Revenue (USD Million) By Product (2021-2032)
Table 26 South America Milk Tofu Revenue (USD Million) By Type (2021-2032)
Table 27 South America Milk Tofu Revenue (USD Million) By Application (2021-2032)
Table 28 South America Milk Tofu Revenue (USD Million) By Product (2021-2032)
Table 29 Middle East and Africa Milk Tofu Revenue (USD Million) By Type (2021-2032)
Table 30 Middle East and Africa Milk Tofu Revenue (USD Million) By Application (2021-2032)
Table 31 Middle East and Africa Milk Tofu Revenue (USD Million) By Product (2021-2032)
LIST OF FIGURES
Figure 1. Market Scope
Figure 2. Pricing Forecasts Per Unit, 2023- 2032
Figure 3. Porter’s Five Forces
Figure 4. Global Milk Tofu Market Revenue (USD Million) By Regions (2021-2032)
Figure 5. Global Milk Tofu Market Share (%) By Regions (2023)
Figure 6. North America Milk Tofu Revenue (USD Million) By Country (2021-2032)
Figure 7. United States Milk Tofu Revenue (USD Million) By Country (2021-2032)
Figure 8. Canada Milk Tofu Revenue (USD Million) By Country (2021-2032)
Figure 9. Mexico Milk Tofu Revenue (USD Million) By Country (2021-2032)
Figure 10. Europe Milk Tofu Revenue (USD Million) By Country (2021-2032)
Figure 11. Germany Milk Tofu Revenue (USD Million) By Country (2021-2032)
Figure 12. France Milk Tofu Revenue (USD Million) By Country (2021-2032)
Figure 13. United Kingdom Milk Tofu Revenue (USD Million) By Country (2021-2032)
Figure 14. Spain Milk Tofu Revenue (USD Million) By Country (2021-2032)
Figure 15. Italy Milk Tofu Revenue (USD Million) By Country (2021-2032)
Figure 16. Russia Milk Tofu Revenue (USD Million) By Country (2021-2032)
Figure 17. Rest of Europe Milk Tofu Revenue (USD Million) By Country (2021-2032)
Figure 11. Asia Pacific Milk Tofu Revenue (USD Million) By Country (2021-2032)
Figure 12. China Milk Tofu Revenue (USD Million) By Country (2021-2032)
Figure 13. Japan Milk Tofu Revenue (USD Million) By Country (2021-2032)
Figure 14. India Milk Tofu Revenue (USD Million) By Country (2021-2032)
Figure 15. South Korea Milk Tofu Revenue (USD Million) By Country (2021-2032)
Figure 16. Australia Milk Tofu Revenue (USD Million) By Country (2021-2032)
Figure 17. South East Asia Milk Tofu Revenue (USD Million) By Country (2021-2032)
Figure 18. South America Milk Tofu Revenue (USD Million) By Country (2021-2032)
Figure 19. Brazil Milk Tofu Revenue (USD Million) By Country (2021-2032)
Figure 20. Argentina Milk Tofu Revenue (USD Million) By Country (2021-2032)
Figure 21. Rest of Asia Pacific Milk Tofu Revenue (USD Million) By Country (2021-2032)
Figure 22. Middle East and Africa Milk Tofu Revenue (USD Million) By Region (2021-2032)
Figure 23. Saudi Arabia Milk Tofu Revenue (USD Million) By Region (2021-2032)
Figure 24. The UAE Milk Tofu Revenue (USD Million) By Region (2021-2032)
Figure 25. Rest of Middle East Milk Tofu Revenue (USD Million) By Region (2021-2032)
Figure 26. South Africa Milk Tofu Revenue (USD Million) By Region (2021-2032)
Figure 27. Africa Milk Tofu Revenue (USD Million) By Region (2021-2032)
Figure 28. North America Milk Tofu Revenue (USD Million) By Type (2021-2032)
Figure 29. North America Milk Tofu Revenue (USD Million) By Application (2021-2032)
Figure 30. North America Milk Tofu Revenue (USD Million) By Product (2021-2032)
Figure 31. Europe Milk Tofu Revenue (USD Million) By Type (2021-2032)
Figure 32. Europe Milk Tofu Revenue (USD Million) By Application (2021-2032)
Figure 33. Europe Milk Tofu Revenue (USD Million) By Product (2021-2032)
Figure 34. Asia Pacific Milk Tofu Revenue (USD Million) By Type (2021-2032)
Figure 35. Asia Pacific Milk Tofu Revenue (USD Million) By Application (2021-2032)
Figure 36. Asia Pacific Milk Tofu Revenue (USD Million) By Product (2021-2032)
Figure 37. South America Milk Tofu Revenue (USD Million) By Type (2021-2032)
Figure 38. South America Milk Tofu Revenue (USD Million) By Application (2021-2032)
Figure 39. South America Milk Tofu Revenue (USD Million) By Product (2021-2032)
Figure 40. Middle East and Africa Milk Tofu Revenue (USD Million) By Type (2021-2032)
Figure 41. Middle East and Africa Milk Tofu Revenue (USD Million) By Application (2021-2032)
Figure 42. Middle East and Africa Milk Tofu Revenue (USD Million) By Product (2021-2032)
By Type
Fresh Milk Tofu
Semi-dried Milk Tofu
By Application
Adults
Children
Countries Analyzed
North America (US, Canada, Mexico)
Europe (Germany, UK, France, Spain, Italy, Russia, Rest of Europe)
Asia Pacific (China, India, Japan, South Korea, Australia, South East Asia, Rest of Asia)
South America (Brazil, Argentina, Rest of South America)
Middle East and Africa (Saudi Arabia, UAE, Rest of Middle East, South Africa, Egypt, Rest of Africa)
