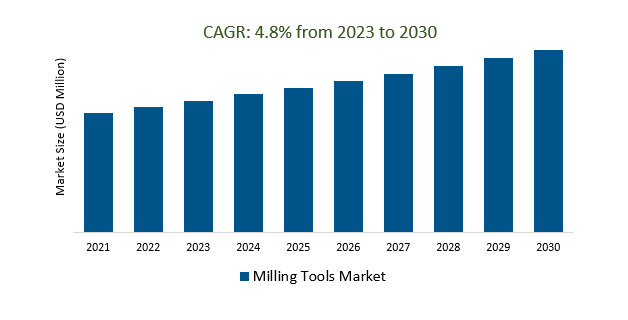
The Global Milling Tools Market Size is estimated to register 4.8% growth over the forecast period from 2023 to 2030.
The market growth is driven by the increasing adoption of computer numerical control (CNC) machining and automation in manufacturing processes has led to higher demand for precision milling tools. Leading Companies that are focusing on Advanced Materials and Coatings, Industry 4.0 Integration, Additive Manufacturing and 3D Printing, Customization and Prototyping, Skill Development, Aerospace and Defense, and others to boost market shares in the industry.
Market Overview
The global milling tools market serves industries such as aerospace, automotive, electronics, and healthcare, providing essential equipment for precision machining. Key trends include technological advancements, Industry 4.0 integration, and automation, while challenges include intense competition and pricing pressures. Notable regions for milling tool manufacturing are Asia-Pacific, Europe, and North America. The market's future outlook is positive, driven by continued innovation, customization, and a focus on sustainability in machining processes.
Market Dynamics
Market Trends - Driving Innovation in Aerospace and Automotive Manufacturing
Innovation in aerospace and automotive manufacturing is essential for competitiveness and sustainability. Key areas of focus include advanced materials, automation, digital twin technology, sustainability, AI, connectivity, energy efficiency, advanced manufacturing processes, supply chain optimization, and collaboration. Embracing these innovations requires investment, research, and a commitment to continuous improvement, along with government incentives and industry partnerships to drive progress.
Market Driver - The demand for milling tools for green machining is growing as businesses look to reduce their environmental impact
The demand for milling tools for green machining is rising as businesses seek environmentally friendly practices to reduce their carbon footprint, comply with stricter regulations, cut costs, enhance brand reputation, and meet customer preferences. Manufacturers are responding by developing more eco-friendly tools and materials, reflecting a broader trend towards sustainable manufacturing.
Market Opportunity- High-speed machining (HSM) is a manufacturing process that uses high spindle speeds and feed rates to remove material quickly and efficiently.
High-speed machining (HSM) is a manufacturing process that utilizes high spindle speeds and feed rates to efficiently remove material from workpieces. It reduces machining cycle times, improves surface finish, extends tool life, and is particularly effective for complex geometries, making it a valuable technique in modern manufacturing for enhancing productivity and quality while reducing energy consumption and heat generation.
Market Share Analysis- Contouring Milling Tools the Milling Tools Market will register the fastest growth
The Global Milling Tools Market is analyzed across Recessing Milling Tools, Face Milling, Roughing Milling Tools, Contouring Milling Tools, Semi Finishing Cutters, Threading Milling Tools, and others. Contouring Milling Tools is poised to register the fastest growth. The market for contouring milling tools is a competitive and dynamic sector within the machining industry, catering to various applications and industries globally. It is driven by the need for precision, efficiency, and customization in manufacturing processes. Key factors influencing the market include advancements in tool design and materials, the adoption of high-performance machining strategies, regional manufacturing trends, and increasing emphasis on sustainability.
Market Share Analysis- Milling Complex 3D Shapes held a significant market share in 2023
The Global Milling Tools Market is analyzed across various applications including Milling Flat Surfaces, Milling Shoulders, Milling Slots, Milling Gears, Milling Complex 3D Shapes, and others. Of these, Milling Complex 3D Shapes held a significant market share in 2023. Milling complex 3D shapes is a crucial application in the milling tools market, involving specialized tools and advanced techniques for precision machining of intricate three-dimensional components across industries like aerospace and automotive. High demand for these tools, including ball nose end mills and multi-axis CNC machines, is driven by the need for intricate part designs, spurring innovation in the milling tools market.
Milling Tools Market Segmentation
By Type
- Recessing Milling Tools
- Face Milling
- Roughing Milling Tools
- Contouring Milling Tools
- Semi Finishing Cutters
- Threading Milling Tools
By Application
- Milling Flat Surfaces
- Milling Shoulders
- Milling Slots
- Milling Gears
- Milling Complex 3D Shapes
By Region
- North America (United States, Canada, Mexico)
- Europe (Germany, France, United Kingdom, Spain, Italy, Others)
- Asia Pacific (China, India, Japan, South Korea, Australia, Others)
- Latin America (Brazil, Argentina, Others)
- Middle East and Africa (Saudi Arabia, UAE, Kuwait, Other Middle East, South Africa, Nigeria, Other Africa)
Milling Tools Market Companies
- ARCH Cutting Tools
- Carlson Tool
- JADCO Manufacturing
- Carmex Precision Tools
- Ceratizit
- Dapra
- AVANTEC
- Drill Service
- Fenn Tool
- FRAISA
- Guhring
- Ingersoll Cutting Tools
- Sandvik
- KORLOY
- Kyocera Precision Tools
- Walter Tools
- Melin Tool
- MMC Hitachi Tool
- Novoutils
- Star SU
- Wedge-Mill Tool
- Whitney Tool
- Winstar Cutting Technologies
- Secotools
- Premier Form Tools
*List not exhaustive
Milling Tools Market Outlook 2023
1 Market Overview
1.1 Introduction to the Milling Tools Market
1.2 Scope of the Study
1.3 Research Objective
1.3.1 Key Market Scope and Segments
1.3.2 Players Covered
1.3.3 Years Considered
2 Executive Summary
2.1 2023 Milling Tools Industry- Market Statistics
3 Market Dynamics
3.1 Market Drivers
3.2 Market Challenges
3.3 Market Opportunities
3.4 Market Trends
4 Market Factor Analysis
4.1 Porter’s Five Forces
4.2 Market Entropy
4.2.1 Global Milling Tools Market Companies with Area Served
4.2.2 Products Offerings Global Milling Tools Market
5 COVID-19 Impact Analysis and Outlook Scenarios
5.1.1 Covid-19 Impact Analysis
5.1.2 Post-COVID-19 Scenario- Low Growth Case
5.1.3 Post-COVID-19 Scenario- Reference Growth Case
5.1.4 Post-COVID-19 Scenario- Low Growth Case
6 Global Milling Tools Market Trends
6.1 Global Milling Tools Revenue (USD Million) and CAGR (%) by Type (2018-2030)
6.2 Global Milling Tools Revenue (USD Million) and CAGR (%) by Applications (2018-2030)
6.3 Global Milling Tools Revenue (USD Million) and CAGR (%) by Regions (2018-2030)
7 Global Milling Tools Market Revenue (USD Million) by Type, and Applications (2018-2022)
7.1 Global Milling Tools Revenue (USD Million) by Type (2018-2022)
7.1.1 Global Milling Tools Revenue (USD Million), Market Share (%) by Type (2018-2022)
7.2 Global Milling Tools Revenue (USD Million) by Applications (2018-2022)
7.2.1 Global Milling Tools Revenue (USD Million), Market Share (%) by Applications (2018-2022)
8 Global Milling Tools Development Regional Status and Outlook
8.1 Global Milling Tools Revenue (USD Million) By Regions (2018-2022)
8.2 North America Milling Tools Revenue (USD Million) by Type, and Application (2018-2022)
8.2.1 North America Milling Tools Revenue (USD Million) by Country (2018-2022)
8.2.2 North America Milling Tools Revenue (USD Million) by Type (2018-2022)
8.2.3 North America Milling Tools Revenue (USD Million) by Applications (2018-2022)
8.3 Europe Milling Tools Revenue (USD Million), by Type, and Applications (USD Million) (2018-2022)
8.3.1 Europe Milling Tools Revenue (USD Million), by Country (2018-2022)
8.3.2 Europe Milling Tools Revenue (USD Million) by Type (2018-2022)
8.3.3 Europe Milling Tools Revenue (USD Million) by Applications (2018-2022)
8.4 Asia Pacific Milling Tools Revenue (USD Million), and Revenue (USD Million) by Type, and Applications (2018-2022)
8.4.1 Asia Pacific Milling Tools Revenue (USD Million) by Country (2018-2022)
8.4.2 Asia Pacific Milling Tools Revenue (USD Million) by Type (2018-2022)
8.4.3 Asia Pacific Milling Tools Revenue (USD Million) by Applications (2018-2022)
8.5 South America Milling Tools Revenue (USD Million), by Type, and Applications (2018-2022)
8.5.1 South America Milling Tools Revenue (USD Million), by Country (2018-2022)
8.5.2 South America Milling Tools Revenue (USD Million) by Type (2018-2022)
8.5.3 South America Milling Tools Revenue (USD Million) by Applications (2018-2022)
8.6 Middle East and Africa Milling Tools Revenue (USD Million), by Type, Technology, Application, Thickness (2018-2022)
8.6.1 Middle East and Africa Milling Tools Revenue (USD Million) by Country (2018-2022)
8.6.2 Middle East and Africa Milling Tools Revenue (USD Million) by Type (2018-2022)
8.6.3 Middle East and Africa Milling Tools Revenue (USD Million) by Applications (2018-2022)
9 Company Profiles
10 Global Milling Tools Market Revenue (USD Million), by Type, and Applications (2023-2030)
10.1 Global Milling Tools Revenue (USD Million) and Market Share (%) by Type (2023-2030)
10.1.1 Global Milling Tools Revenue (USD Million), and Market Share (%) by Type (2023-2030)
10.2 Global Milling Tools Revenue (USD Million) and Market Share (%) by Applications (2023-2030)
10.2.1 Global Milling Tools Revenue (USD Million), and Market Share (%) by Applications (2023-2030)
11 Global Milling Tools Development Regional Status and Outlook Forecast
11.1 Global Milling Tools Revenue (USD Million) By Regions (2023-2030)
11.2 North America Milling Tools Revenue (USD Million) by Type, and Applications (2023-2030)
11.2.1 North America Milling Tools Revenue (USD) Million by Country (2023-2030)
11.2.2 North America Milling Tools Revenue (USD Million), by Type (2023-2030)
11.2.3 North America Milling Tools Revenue (USD Million), Market Share (%) by Applications (2023-2030)
11.3 Europe Milling Tools Revenue (USD Million), by Type, and Applications (2023-2030)
11.3.1 Europe Milling Tools Revenue (USD Million), by Country (2023-2030)
11.3.2 Europe Milling Tools Revenue (USD Million), by Type (2023-2030)
11.3.3 Europe Milling Tools Revenue (USD Million), by Applications (2023-2030)
11.4 Asia Pacific Milling Tools Revenue (USD Million) by Type, and Applications (2023-2030)
11.4.1 Asia Pacific Milling Tools Revenue (USD Million), by Country (2023-2030)
11.4.2 Asia Pacific Milling Tools Revenue (USD Million), by Type (2023-2030)
11.4.3 Asia Pacific Milling Tools Revenue (USD Million), by Applications (2023-2030)
11.5 South America Milling Tools Revenue (USD Million), by Type, and Applications (2023-2030)
11.5.1 South America Milling Tools Revenue (USD Million), by Country (2023-2030)
11.5.2 South America Milling Tools Revenue (USD Million), by Type (2023-2030)
11.5.3 South America Milling Tools Revenue (USD Million), by Applications (2023-2030)
11.6 Middle East and Africa Milling Tools Revenue (USD Million), by Type, and Applications (2023-2030)
11.6.1 Middle East and Africa Milling Tools Revenue (USD Million), by Region (2023-2030)
11.6.2 Middle East and Africa Milling Tools Revenue (USD Million), by Type (2023-2030)
11.6.3 Middle East and Africa Milling Tools Revenue (USD Million), by Applications (2023-2030)
12 Methodology and Data Sources
12.1 Methodology/Research Approach
12.1.1 Research Programs/Design
12.1.2 Market Size Estimation
12.1.3 Market Breakdown and Data Triangulation
12.2 Data Sources
12.2.1 Secondary Sources
12.2.2 Primary Sources
12.3 Disclaimer
List of Tables
Table 1 Market Segmentation Analysis
Table 2 Global Milling Tools Market Companies with Areas Served
Table 3 Products Offerings Global Milling Tools Market
Table 4 Low Growth Scenario Forecasts
Table 5 Reference Case Growth Scenario
Table 6 High Growth Case Scenario
Table 7 Global Milling Tools Revenue (USD Million) And CAGR (%) By Type (2018-2030)
Table 8 Global Milling Tools Revenue (USD Million) And CAGR (%) By Applications (2018-2030)
Table 9 Global Milling Tools Revenue (USD Million) And CAGR (%) By Regions (2018-2030)
Table 10 Global Milling Tools Revenue (USD Million) By Type (2018-2022)
Table 11 Global Milling Tools Revenue Market Share (%) By Type (2018-2022)
Table 12 Global Milling Tools Revenue (USD Million) By Applications (2018-2022)
Table 13 Global Milling Tools Revenue Market Share (%) By Applications (2018-2022)
Table 14 Global Milling Tools Market Revenue (USD Million) By Regions (2018-2022)
Table 15 Global Milling Tools Market Share (%) By Regions (2018-2022)
Table 16 North America Milling Tools Revenue (USD Million) By Country (2018-2022)
Table 17 North America Milling Tools Revenue (USD Million) By Type (2018-2022)
Table 18 North America Milling Tools Revenue (USD Million) By Applications (2018-2022)
Table 19 Europe Milling Tools Revenue (USD Million) By Country (2018-2022)
Table 20 Europe Milling Tools Revenue (USD Million) By Type (2018-2022)
Table 21 Europe Milling Tools Revenue (USD Million) By Applications (2018-2022)
Table 22 Asia Pacific Milling Tools Revenue (USD Million) By Country (2018-2022)
Table 23 Asia Pacific Milling Tools Revenue (USD Million) By Type (2018-2022)
Table 24 Asia Pacific Milling Tools Revenue (USD Million) By Applications (2018-2022)
Table 25 South America Milling Tools Revenue (USD Million) By Country (2018-2022)
Table 26 South America Milling Tools Revenue (USD Million) By Type (2018-2022)
Table 27 South America Milling Tools Revenue (USD Million) By Applications (2018-2022)
Table 28 Middle East and Africa Milling Tools Revenue (USD Million) By Region (2018-2022)
Table 29 Middle East and Africa Milling Tools Revenue (USD Million) By Type (2018-2022)
Table 30 Middle East and Africa Milling Tools Revenue (USD Million) By Applications (2018-2022)
Table 31 Financial Analysis
Table 32 Global Milling Tools Revenue (USD Million) By Type (2023-2030)
Table 33 Global Milling Tools Revenue Market Share (%) By Type (2023-2030)
Table 34 Global Milling Tools Revenue (USD Million) By Applications (2023-2030)
Table 35 Global Milling Tools Revenue Market Share (%) By Applications (2023-2030)
Table 36 Global Milling Tools Market Revenue (USD Million), And Revenue (USD Million) By Regions (2023-2030)
Table 37 North America Milling Tools Revenue (USD)By Country (2023-2030)
Table 38 North America Milling Tools Revenue (USD Million) By Type (2023-2030)
Table 39 North America Milling Tools Revenue (USD Million) By Applications (2023-2030)
Table 40 Europe Milling Tools Revenue (USD Million) By Country (2023-2030)
Table 41 Europe Milling Tools Revenue (USD Million) By Type (2023-2030)
Table 42 Europe Milling Tools Revenue (USD Million) By Applications (2023-2030)
Table 43 Asia Pacific Milling Tools Revenue (USD Million) By Country (2023-2030)
Table 44 Asia Pacific Milling Tools Revenue (USD Million) By Type (2023-2030)
Table 45 Asia Pacific Milling Tools Revenue (USD Million) By Applications (2023-2030)
Table 46 South America Milling Tools Revenue (USD Million) By Country (2023-2030)
Table 47 South America Milling Tools Revenue (USD Million) By Type (2023-2030)
Table 48 South America Milling Tools Revenue (USD Million) By Applications (2023-2030)
Table 49 Middle East and Africa Milling Tools Revenue (USD Million) By Region (2023-2030)
Table 50 Middle East and Africa Milling Tools Revenue (USD Million) By Region (2023-2030)
Table 51 Middle East and Africa Milling Tools Revenue (USD Million) By Type (2023-2030)
Table 52 Middle East and Africa Milling Tools Revenue (USD Million) By Applications (2023-2030)
Table 53 Research Programs/Design for This Report
Table 54 Key Data Information from Secondary Sources
Table 55 Key Data Information from Primary Sources
List of Figures
Figure 1 Market Scope
Figure 2 Porter’s Five Forces
Figure 3 Global Milling Tools Revenue (USD Million) By Type (2018-2022)
Figure 4 Global Milling Tools Revenue Market Share (%) By Type (2022)
Figure 5 Global Milling Tools Revenue (USD Million) By Applications (2018-2022)
Figure 6 Global Milling Tools Revenue Market Share (%) By Applications (2022)
Figure 7 Global Milling Tools Market Revenue (USD Million) By Regions (2018-2022)
Figure 8 Global Milling Tools Market Share (%) By Regions (2022)
Figure 9 North America Milling Tools Revenue (USD Million) By Country (2018-2022)
Figure 10 North America Milling Tools Revenue (USD Million) By Type (2018-2022)
Figure 11 North America Milling Tools Revenue (USD Million) By Applications (2018-2022)
Figure 12 Europe Milling Tools Revenue (USD Million) By Country (2018-2022)
Figure 13 Europe Milling Tools Revenue (USD Million) By Type (2018-2022)
Figure 14 Europe Milling Tools Revenue (USD Million) By Applications (2018-2022)
Figure 15 Asia Pacific Milling Tools Revenue (USD Million) By Country (2018-2022)
Figure 16 Asia Pacific Milling Tools Revenue (USD Million) By Type (2018-2022)
Figure 17 Asia Pacific Milling Tools Revenue (USD Million) By Applications (2018-2022)
Figure 18 South America Milling Tools Revenue (USD Million) By Country (2018-2022)
Figure 19 South America Milling Tools Revenue (USD Million) By Type (2018-2022)
Figure 20 South America Milling Tools Revenue (USD Million) By Applications (2018-2022)
Figure 21 Middle East and Africa Milling Tools Revenue (USD Million) By Region (2018-2022)
Figure 22 Middle East and Africa Milling Tools Revenue (USD Million) By Type (2018-2022)
Figure 23 Middle East and Africa Milling Tools Revenue (USD Million) By Applications (2018-2022)
Figure 24 Global Milling Tools Revenue (USD Million) By Type (2023-2030)
Figure 25 Global Milling Tools Revenue Market Share (%) By Type (2030)
Figure 26 Global Milling Tools Revenue (USD Million) By Applications (2023-2030)
Figure 27 Global Milling Tools Revenue Market Share (%) By Applications (2030)
Figure 28 Global Milling Tools Market Revenue (USD Million) By Regions (2023-2030)
Figure 29 North America Milling Tools Revenue (USD Million) By Country (2023-2030)
Figure 30 North America Milling Tools Revenue (USD Million) By Type (2023-2030)
Figure 31 North America Milling Tools Revenue (USD Million) By Applications (2023-2030)
Figure 32 Europe Milling Tools Revenue (USD Million) By Country (2023-2030)
Figure 33 Europe Milling Tools Revenue (USD Million) By Type (2023-2030)
Figure 34 Europe Milling Tools Revenue (USD Million) By Applications (2023-2030)
Figure 35 Asia Pacific Milling Tools Revenue (USD Million) By Country (2023-2030)
Figure 36 Asia Pacific Milling Tools Revenue (USD Million) By Type (2023-2030)
Figure 37 Asia Pacific Milling Tools Revenue (USD Million) By Applications (2023-2030)
Figure 38 South America Milling Tools Revenue (USD Million) By Country (2023-2030)
Figure 39 South America Milling Tools Revenue (USD Million) By Type (2023-2030)
Figure 40 South America Milling Tools Revenue (USD Million) By Applications (2023-2030)
Figure 41 Middle East and Africa Milling Tools Revenue (USD Million) By Region (2023-2030)
Figure 42 Middle East and Africa Milling Tools Revenue (USD Million) By Region (2023-2030)
Figure 43 Middle East and Africa Milling Tools Revenue (USD Million) By Type (2023-2030)
Figure 44 Middle East and Africa Milling Tools Revenue (USD Million) By Applications (2023-2030)
Figure 45 Bottom-Up and Top-Down Approaches For This Report
Figure 46 Data Triangulation
