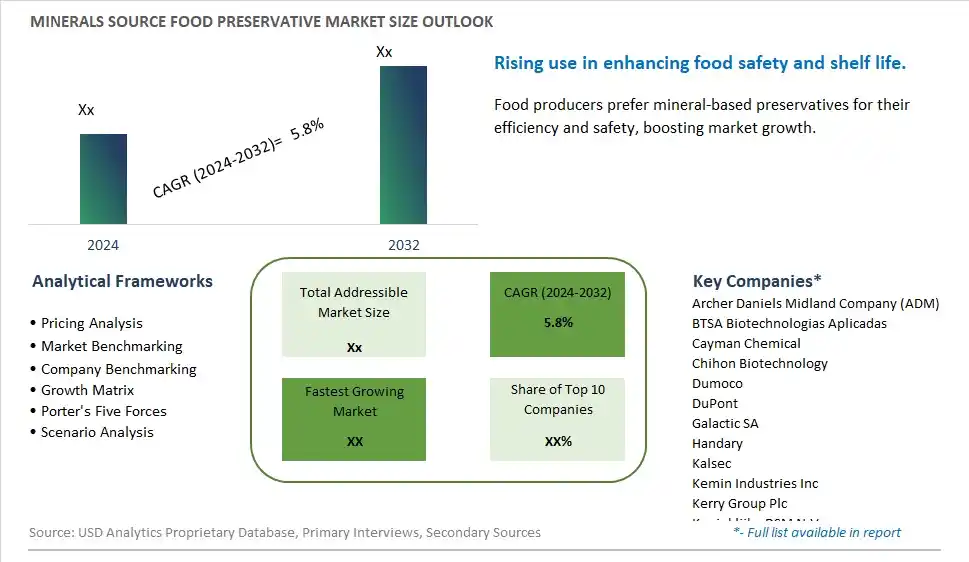
Global Minerals Source Food Preservative Market Size is valued at $XX Million in 2024 and is forecast to register a growth rate (CAGR) of 5.8% to reach $XX Million by 2032.
The global Minerals Source Food Preservative Market Comprehensive Study analyzes and forecasts the market size across 6 regions and 24 countries for diverse segments -By Type (Salts, Natural Acids, Botanical Extracts, Rosemary Extract, Others), By Application (Seasoning, Meat, Fruit Juice, Dairy Products, Others)
An Introduction to Minerals Source Food Preservative Market
The minerals source food preservative market in 2024 is expanding, driven by the demand for natural and effective food preservation methods. Mineral-based preservatives, such as calcium and potassium salts, offer antimicrobial properties that extend the shelf life of various food products. The market benefits from innovations in preservative formulation and application that enhance safety and efficacy. The trend towards clean label and natural ingredients is influencing market dynamics. Increasing consumer awareness of food safety and the desire for preservative-free products are further supporting market growth.
Minerals Source Food Preservative Competitive Landscape
The market report analyses the leading companies in the industry including Archer Daniels Midland Company (ADM), BTSA Biotechnologias Aplicadas, Cayman Chemical, Chihon Biotechnology, Dumoco, DuPont, Galactic SA, Handary, Kalsec, Kemin Industries Inc, Kerry Group Plc, Koninklijke DSM N.V., MAYASAN Food Industries, Merck KGaA, Naturex S.A., Siveele, Wiley Organics, and Others.
Minerals Source Food Preservative Market Dynamics
Minerals Source Food Preservative Market Trend: Increasing Demand for Natural Preservatives
The most prominent trend in the Minerals Source Food Preservative Market is the increasing demand for natural preservatives. Consumers are seeking food products that contain natural and recognizable ingredients, driving the demand for mineral-based preservatives that offer an alternative to synthetic chemicals.
Minerals Source Food Preservative Market Driver: Growth of the Clean Label Movement
A key driver in the Minerals Source Food Preservative Market is the growth of the clean label movement. As more individuals focus on transparency and health in their food choices, there is a rising demand for preservatives that align with clean label standards, supporting the use of mineral-based solutions.
Minerals Source Food Preservative Market Opportunity: Development of Innovative Preservative Blends
One significant opportunity in the Minerals Source Food Preservative Market lies in the development of innovative preservative blends. Companies can create new formulations that combine mineral-based preservatives with other natural ingredients to enhance their effectiveness and appeal. By offering advanced and natural preservative solutions, manufacturers can attract health-conscious consumers and drive market growth.
Minerals Source Food Preservative Market Share Analysis- Largest Segment by Type
In the Minerals Source Food Preservative Market, the Salts segment is the largest. This dominance is due to the widespread use of salts as preservatives in various food products, including meats, snacks, and processed foods. Salts are valued for their ability to inhibit microbial growth and extend the shelf life of food items. Their effectiveness, cost-efficiency, and established role in food preservation make them the most prevalent type of food preservative. Additionally, the versatility of salts in both traditional and modern food preservation techniques supports their leading market position.
Minerals Source Food Preservative Market Share Analysis- Fastest Growing Segment by Application
In the Minerals Source Food Preservative Market, the Meat application segment is poised to grow the fastest over the next five years. This growth is driven by increasing consumer demand for preserved and processed meat products, along with the need for effective preservatives to maintain product quality and safety. The rising popularity of ready-to-eat and convenience meat products, coupled with advancements in preservation technologies, contributes to the segment's rapid expansion. Additionally, the growing focus on extending the shelf life of meat products and improving their safety profiles supports the increasing use of mineral-based preservatives in this sector.
Minerals Source Food Preservative Market Segmentation
By Type
Salts
Natural Acids
Botanical Extracts
Rosemary Extract
Others
By Application
Seasoning
Meat
Fruit Juice
Dairy Products
Others
Countries Analyzed
North America (US, Canada, Mexico)
Europe (Germany, UK, France, Spain, Italy, Russia, Rest of Europe)
Asia Pacific (China, India, Japan, South Korea, Australia, South East Asia, Rest of Asia)
South America (Brazil, Argentina, Rest of South America)
Middle East and Africa (Saudi Arabia, UAE, Rest of Middle East, South Africa, Egypt, Rest of Africa)
Minerals Source Food Preservative Companies Profiled in the Study
Archer Daniels Midland Company (ADM)
BTSA Biotechnologias Aplicadas
Cayman Chemical
Chihon Biotechnology
Dumoco
DuPont
Galactic SA
Handary
Kalsec
Kemin Industries Inc
Kerry Group Plc
Koninklijke DSM N.V.
MAYASAN Food Industries
Merck KGaA
Naturex S.A.
Siveele
Wiley Organics
*- List Not Exhaustive
Chapter 1. TABLE OF CONTENTS
Chapter 2. Introduction to Minerals Source Food Preservative Market
2.1. Market Overview
2.2. Key Statistics and Report Highlights
2.3. Scope of the Comprehensive Study
2.3.1. Market Definition
2.3.2 Countries and Regions Covered
2.3.3 Research Objective
2.3.4 Units, Currency, and Conversions
2.3.5 Industry Value Chain
2.4. Key Market Segments
2.5. Key Companies
2.6. Study Period
Chapter 3. Strategic Analysis Review
3.1. Minerals Source Food Preservative Pricing Analysis and Forecast
3.2. Porter’s Five Forces
3.3. Market Ecosystem
3.4. SWOT Analysis
3.5. Regulatory Scenario
3.3. Effects of Inflation, Russia-Ukraine War, moderating economic growth, and other macroeconomic factors
Chapter 4. Competitive Landscape
4.1. Market Share Analysis
4.1.1. Global Minerals Source Food Preservative Market Share by Company, 2023
4.1.2. Product Offerings of Leading Minerals Source Food Preservative Companies
4.2. Market Entropy
4.2.1. New Product Launches in the Industry
4.2.2. Mergers, Acquisitions, Joint ventures, and Partnerships
4.3. Key Strategies and Best Practices
Chapter 5. Global Market Projections: Best, Reference, and Low Case Scenarios
5.1. Growth Analysis- Case Scenario Definitions
5.2. Low Growth Case Scenario Forecasts
5.3. Reference Growth Case Scenario Forecasts
5.4. High Growth Case Scenario Forecasts
Chapter 6. Market Dynamics
6.1. Minerals Source Food Preservative Market Drivers
6.2. Minerals Source Food Preservative Market Challenges
6.6. Minerals Source Food Preservative Market Opportunities
6.4. Minerals Source Food Preservative Market Trends
Chapter 7. Global Minerals Source Food Preservative Market Outlook Trends
7.1. Global Minerals Source Food Preservative Revenue (USD Million) and CAGR (%) by Type (2021-2032)
7.2. Global Minerals Source Food Preservative Revenue (USD Million) and CAGR (%) by Application (2021-2032)
7.3. Global Minerals Source Food Preservative Revenue (USD Million) and CAGR (%) by Product (2021-2032)
By Type
Salts
Natural Acids
Botanical Extracts
Rosemary Extract
Others
By Application
Seasoning
Meat
Fruit Juice
Dairy Products
Others
Chapter 8. Global Minerals Source Food Preservative Regional Analysis and Outlook
8.1. Global Minerals Source Food Preservative Revenue (USD Million) By Regions (2021- 2032)
8.2. North America Minerals Source Food Preservative Revenue (USD Million) by Country (2021-2032)
8.2.1. United States Minerals Source Food Preservative Regional Analysis and Outlook
8.2.2. Canada Minerals Source Food Preservative Regional Analysis and Outlook
8.2.3. Mexico Minerals Source Food Preservative Regional Analysis and Outlook
8.3. Europe Minerals Source Food Preservative Revenue (USD Million), by Country (2021-2032)
8.3.1. Germany Minerals Source Food Preservative Regional Analysis and Outlook
8.3.2. France Minerals Source Food Preservative Regional Analysis and Outlook
8.3.3. United Kingdom Minerals Source Food Preservative Regional Analysis and Outlook
8.3.4. Spain Minerals Source Food Preservative Regional Analysis and Outlook
8.3.5. Italy Minerals Source Food Preservative Regional Analysis and Outlook
8.3.6. Russia Minerals Source Food Preservative Regional Analysis and Outlook
8.3.7. Rest of Europe Minerals Source Food Preservative Regional Analysis and Outlook
8.4. Asia Pacific Minerals Source Food Preservative Revenue (USD Million) by Country (2021-2032)
8.4.1. China Minerals Source Food Preservative Regional Analysis and Outlook
8.4.2. Japan Minerals Source Food Preservative Regional Analysis and Outlook
8.4.3. India Minerals Source Food Preservative Regional Analysis and Outlook
8.4.4. South Korea Minerals Source Food Preservative Regional Analysis and Outlook
8.4.5. Australia Minerals Source Food Preservative Regional Analysis and Outlook
8.4.6. South East Asia Minerals Source Food Preservative Regional Analysis and Outlook
8.4.7. Rest of Asia Pacific Minerals Source Food Preservative Regional Analysis and Outlook
8.5. South America Minerals Source Food Preservative Revenue (USD Million), by Country (2021-2032)
8.5.1. Brazil Minerals Source Food Preservative Regional Analysis and Outlook
8.5.2. Argentina Minerals Source Food Preservative Regional Analysis and Outlook
8.5.3. Rest of South America Minerals Source Food Preservative Regional Analysis and Outlook
8.6. Middle East and Africa Minerals Source Food Preservative Revenue (USD Million) by Country (2021-2032)
8.6.1. Middle East Minerals Source Food Preservative Regional Analysis and Outlook
8.6.2. Africa Minerals Source Food Preservative Regional Analysis and Outlook
Chapter 9. North America Minerals Source Food Preservative Analysis and Outlook
9.1. North America Minerals Source Food Preservative Revenue (USD Million) by Segments (2021-2032)
9.1.1. North America Minerals Source Food Preservative Revenue (USD Million) by Type (2021-2032)
9.1.2. North America Minerals Source Food Preservative Revenue (USD Million) by Application (2021-2032)
9.1.3. North America Minerals Source Food Preservative Revenue (USD Million) by Product (2021-2032)
By Type
Salts
Natural Acids
Botanical Extracts
Rosemary Extract
Others
By Application
Seasoning
Meat
Fruit Juice
Dairy Products
Others
Chapter 10. Europe Minerals Source Food Preservative Analysis and Outlook
10.1. Europe Minerals Source Food Preservative Revenue (USD Million), by Segments (USD Million) (2021-2032)
10.1.1. Europe Minerals Source Food Preservative Revenue (USD Million) by Type (2021-2032)
10.1.2. Europe Minerals Source Food Preservative Revenue (USD Million) by Application (2021-2032)
10.1.3. Europe Minerals Source Food Preservative Revenue (USD Million) by Product (2021-2032)
By Type
Salts
Natural Acids
Botanical Extracts
Rosemary Extract
Others
By Application
Seasoning
Meat
Fruit Juice
Dairy Products
Others
Chapter 11. Asia Pacific Minerals Source Food Preservative Analysis and Outlook
11.1. Asia Pacific Minerals Source Food Preservative Revenue (USD Million), and Revenue (USD Million) by Segments (2021-2032)
11.1.1. Asia Pacific Minerals Source Food Preservative Revenue (USD Million) by Type (2021-2032)
11.1.2. Asia Pacific Minerals Source Food Preservative Revenue (USD Million) by Application (2021-2032)
11.1.3. Asia Pacific Minerals Source Food Preservative Revenue (USD Million) by Product (2021-2032)
By Type
Salts
Natural Acids
Botanical Extracts
Rosemary Extract
Others
By Application
Seasoning
Meat
Fruit Juice
Dairy Products
Others
Chapter 12. South America Minerals Source Food Preservative Analysis and Outlook
12.1. South America Minerals Source Food Preservative Revenue (USD Million), by Segments (2021-2032)
12.1.1. South America Minerals Source Food Preservative Revenue (USD Million) by Type (2021-2032)
12.1.2. South America Minerals Source Food Preservative Revenue (USD Million) by Application (2021-2032)
12.1.3. South America Minerals Source Food Preservative Revenue (USD Million) by Product (2021-2032)
By Type
Salts
Natural Acids
Botanical Extracts
Rosemary Extract
Others
By Application
Seasoning
Meat
Fruit Juice
Dairy Products
Others
Chapter 13. Middle East and Africa Minerals Source Food Preservative Analysis and Outlook
13.1. Middle East and Africa Minerals Source Food Preservative Revenue (USD Million), by Segments (2021-2032)
13.1.1. Middle East and Africa Minerals Source Food Preservative Revenue (USD Million) by Type (2021-2032)
13.1.2. Middle East and Africa Minerals Source Food Preservative Revenue (USD Million) by Application (2021-2032)
13.1.3. Middle East and Africa Minerals Source Food Preservative Revenue (USD Million) by Product (2021-2032)
By Type
Salts
Natural Acids
Botanical Extracts
Rosemary Extract
Others
By Application
Seasoning
Meat
Fruit Juice
Dairy Products
Others
Chapter 14. Minerals Source Food Preservative Company Profiles
14.1 Business Overview
14.2 Product Profiles
14.3 SWOT Profiles
14.5 Recent Developments
14.6 Financial Profile
List of Companies
Archer Daniels Midland Company (ADM)
BTSA Biotechnologias Aplicadas
Cayman Chemical
Chihon Biotechnology
Dumoco
DuPont
Galactic SA
Handary
Kalsec
Kemin Industries Inc
Kerry Group Plc
Koninklijke DSM N.V.
MAYASAN Food Industries
Merck KGaA
Naturex S.A.
Siveele
Wiley Organics
15. Methodology and Data Sources
15.1 Customization Offerings
15.2 Subscription Services
15.3 Related Reports
15.4 Publisher Expertise
LIST OF TABLES
Table 1 Market Segmentation Analysis
Table 2 Global Minerals Source Food Preservative Market Share of Leading Companies, 2023
Table 3 Product Offerings of Leading Companies
Table 4 Low Growth Scenario Forecasts
Table 5 Reference Case Growth Scenario
Table 6 High Growth Case Scenario
Table 7 Global Minerals Source Food Preservative Revenue (USD Million) And CAGR (%) By Type (2021-2032)
Table 8 Global Minerals Source Food Preservative Revenue (USD Million) And CAGR (%) By Application (2021-2032)
Table 9 Global Minerals Source Food Preservative Revenue (USD Million) And CAGR (%) By Product (2021-2032)
Table 10 Global Minerals Source Food Preservative Market Revenue (USD Million) By Regions (2021-2032)
Table 11 Global Minerals Source Food Preservative Market Share (%) By Regions (2021-2032)
Table 12 North America Minerals Source Food Preservative Revenue (USD Million) By Country (2021-2032)
Table 13 Europe Minerals Source Food Preservative Revenue (USD Million) By Country (2021-2032)
Table 14 Asia Pacific Minerals Source Food Preservative Revenue (USD Million) By Country (2021-2032)
Table 15 South America Minerals Source Food Preservative Revenue (USD Million) By Country (2021-2032)
Table 16 Middle East and Africa Minerals Source Food Preservative Revenue (USD Million) By Region (2021-2032)
Table 17 North America Minerals Source Food Preservative Revenue (USD Million) By Type (2021-2032)
Table 18 North America Minerals Source Food Preservative Revenue (USD Million) By Application (2021-2032)
Table 19 North America Minerals Source Food Preservative Revenue (USD Million) By Product (2021-2032)
Table 20 Europe Minerals Source Food Preservative Revenue (USD Million) By Type (2021-2032)
Table 21 Europe Minerals Source Food Preservative Revenue (USD Million) By Application (2021-2032)
Table 22 Europe Minerals Source Food Preservative Revenue (USD Million) By Product (2021-2032)
Table 23 Asia Pacific Minerals Source Food Preservative Revenue (USD Million) By Type (2021-2032)
Table 24 Asia Pacific Minerals Source Food Preservative Revenue (USD Million) By Application (2021-2032)
Table 25 Asia Pacific Minerals Source Food Preservative Revenue (USD Million) By Product (2021-2032)
Table 26 South America Minerals Source Food Preservative Revenue (USD Million) By Type (2021-2032)
Table 27 South America Minerals Source Food Preservative Revenue (USD Million) By Application (2021-2032)
Table 28 South America Minerals Source Food Preservative Revenue (USD Million) By Product (2021-2032)
Table 29 Middle East and Africa Minerals Source Food Preservative Revenue (USD Million) By Type (2021-2032)
Table 30 Middle East and Africa Minerals Source Food Preservative Revenue (USD Million) By Application (2021-2032)
Table 31 Middle East and Africa Minerals Source Food Preservative Revenue (USD Million) By Product (2021-2032)
LIST OF FIGURES
Figure 1. Market Scope
Figure 2. Pricing Forecasts Per Unit, 2023- 2032
Figure 3. Porter’s Five Forces
Figure 4. Global Minerals Source Food Preservative Market Revenue (USD Million) By Regions (2021-2032)
Figure 5. Global Minerals Source Food Preservative Market Share (%) By Regions (2023)
Figure 6. North America Minerals Source Food Preservative Revenue (USD Million) By Country (2021-2032)
Figure 7. United States Minerals Source Food Preservative Revenue (USD Million) By Country (2021-2032)
Figure 8. Canada Minerals Source Food Preservative Revenue (USD Million) By Country (2021-2032)
Figure 9. Mexico Minerals Source Food Preservative Revenue (USD Million) By Country (2021-2032)
Figure 10. Europe Minerals Source Food Preservative Revenue (USD Million) By Country (2021-2032)
Figure 11. Germany Minerals Source Food Preservative Revenue (USD Million) By Country (2021-2032)
Figure 12. France Minerals Source Food Preservative Revenue (USD Million) By Country (2021-2032)
Figure 13. United Kingdom Minerals Source Food Preservative Revenue (USD Million) By Country (2021-2032)
Figure 14. Spain Minerals Source Food Preservative Revenue (USD Million) By Country (2021-2032)
Figure 15. Italy Minerals Source Food Preservative Revenue (USD Million) By Country (2021-2032)
Figure 16. Russia Minerals Source Food Preservative Revenue (USD Million) By Country (2021-2032)
Figure 17. Rest of Europe Minerals Source Food Preservative Revenue (USD Million) By Country (2021-2032)
Figure 11. Asia Pacific Minerals Source Food Preservative Revenue (USD Million) By Country (2021-2032)
Figure 12. China Minerals Source Food Preservative Revenue (USD Million) By Country (2021-2032)
Figure 13. Japan Minerals Source Food Preservative Revenue (USD Million) By Country (2021-2032)
Figure 14. India Minerals Source Food Preservative Revenue (USD Million) By Country (2021-2032)
Figure 15. South Korea Minerals Source Food Preservative Revenue (USD Million) By Country (2021-2032)
Figure 16. Australia Minerals Source Food Preservative Revenue (USD Million) By Country (2021-2032)
Figure 17. South East Asia Minerals Source Food Preservative Revenue (USD Million) By Country (2021-2032)
Figure 18. South America Minerals Source Food Preservative Revenue (USD Million) By Country (2021-2032)
Figure 19. Brazil Minerals Source Food Preservative Revenue (USD Million) By Country (2021-2032)
Figure 20. Argentina Minerals Source Food Preservative Revenue (USD Million) By Country (2021-2032)
Figure 21. Rest of Asia Pacific Minerals Source Food Preservative Revenue (USD Million) By Country (2021-2032)
Figure 22. Middle East and Africa Minerals Source Food Preservative Revenue (USD Million) By Region (2021-2032)
Figure 23. Saudi Arabia Minerals Source Food Preservative Revenue (USD Million) By Region (2021-2032)
Figure 24. The UAE Minerals Source Food Preservative Revenue (USD Million) By Region (2021-2032)
Figure 25. Rest of Middle East Minerals Source Food Preservative Revenue (USD Million) By Region (2021-2032)
Figure 26. South Africa Minerals Source Food Preservative Revenue (USD Million) By Region (2021-2032)
Figure 27. Africa Minerals Source Food Preservative Revenue (USD Million) By Region (2021-2032)
Figure 28. North America Minerals Source Food Preservative Revenue (USD Million) By Type (2021-2032)
Figure 29. North America Minerals Source Food Preservative Revenue (USD Million) By Application (2021-2032)
Figure 30. North America Minerals Source Food Preservative Revenue (USD Million) By Product (2021-2032)
Figure 31. Europe Minerals Source Food Preservative Revenue (USD Million) By Type (2021-2032)
Figure 32. Europe Minerals Source Food Preservative Revenue (USD Million) By Application (2021-2032)
Figure 33. Europe Minerals Source Food Preservative Revenue (USD Million) By Product (2021-2032)
Figure 34. Asia Pacific Minerals Source Food Preservative Revenue (USD Million) By Type (2021-2032)
Figure 35. Asia Pacific Minerals Source Food Preservative Revenue (USD Million) By Application (2021-2032)
Figure 36. Asia Pacific Minerals Source Food Preservative Revenue (USD Million) By Product (2021-2032)
Figure 37. South America Minerals Source Food Preservative Revenue (USD Million) By Type (2021-2032)
Figure 38. South America Minerals Source Food Preservative Revenue (USD Million) By Application (2021-2032)
Figure 39. South America Minerals Source Food Preservative Revenue (USD Million) By Product (2021-2032)
Figure 40. Middle East and Africa Minerals Source Food Preservative Revenue (USD Million) By Type (2021-2032)
Figure 41. Middle East and Africa Minerals Source Food Preservative Revenue (USD Million) By Application (2021-2032)
Figure 42. Middle East and Africa Minerals Source Food Preservative Revenue (USD Million) By Product (2021-2032)
By Type
Salts
Natural Acids
Botanical Extracts
Rosemary Extract
Others
By Application
Seasoning
Meat
Fruit Juice
Dairy Products
Others
Countries Analyzed
North America (US, Canada, Mexico)
Europe (Germany, UK, France, Spain, Italy, Russia, Rest of Europe)
Asia Pacific (China, India, Japan, South Korea, Australia, South East Asia, Rest of Asia)
South America (Brazil, Argentina, Rest of South America)
Middle East and Africa (Saudi Arabia, UAE, Rest of Middle East, South Africa, Egypt, Rest of Africa)
