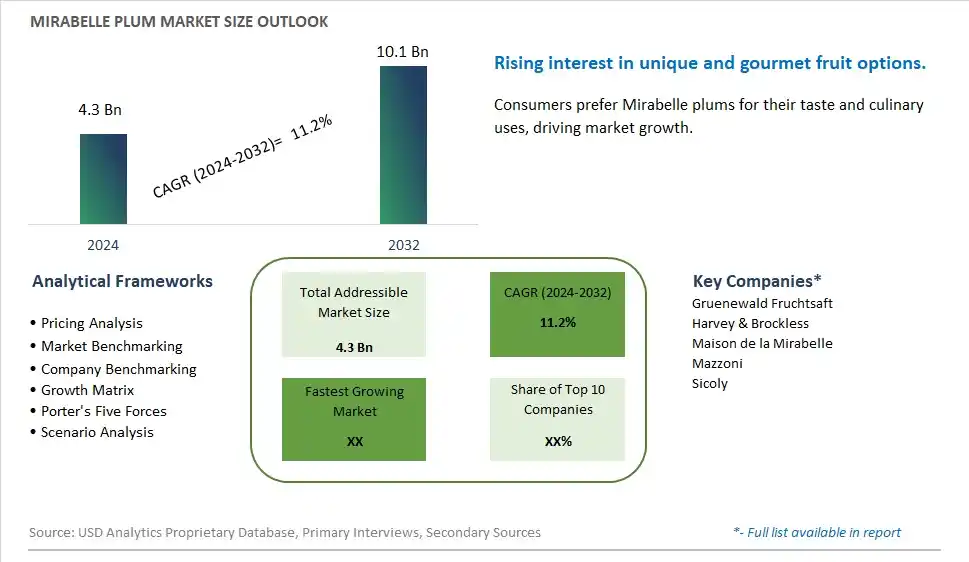
Global Mirabelle Plum Market Size is valued at $4.3 Billion in 2024 and is forecast to register a growth rate (CAGR) of 11.2% to reach $10.1 Billion by 2032.
The global Mirabelle Plum Market Comprehensive Study analyzes and forecasts the market size across 6 regions and 24 countries for diverse segments -By Type (Raw, Processed), By Application (Food and Beverages, Pharmaceutical, Cosmetics, Personal Care, Others)
An Introduction to Mirabelle Plum Market
In 2024, the Mirabelle plum market is thriving, fueled by the growing interest in unique and exotic fruits. Mirabelle plums, known for their sweet flavor and vibrant color, are used in various culinary applications, including desserts, preserves, and beverages. The market benefits from innovations in cultivation and post-harvest technologies that enhance fruit quality and shelf life. The trend towards clean label and natural ingredients is influencing product development. Increasing consumer interest in premium and gourmet fruits, along with the popularity of artisanal and specialty foods, is further supporting market growth.
Mirabelle Plum Competitive Landscape
The market report analyses the leading companies in the industry including Gruenewald Fruchtsaft, Harvey & Brockless, Maison de la Mirabelle, Mazzoni, Sicoly, and Others.
Mirabelle Plum Market Dynamics
Mirabelle Plum Market Trend: Increasing Demand for Exotic and Specialty Fruits
The most prominent trend in the Mirabelle Plum Market is the increasing demand for exotic and specialty fruits. Consumers are seeking unique and flavorful fruit options, such as Mirabelle plums, driven by the desire for diverse and gourmet food experiences.
Mirabelle Plum Market Driver: Growth of the Premium Fruit Market
Mirabelle Plum Market Share Analysis- Largest Segment by Type
In the Mirabelle Plum Market, the Processed segment is the largest. This predominance is attributed to the broader range of applications for processed mirabelle plums compared to raw ones. Processed mirabelle plums are used in various products such as jams, preserves, juices, and baked goods, which significantly expands their market reach. The processing of mirabelle plums not only extends their shelf life but also enhances their versatility, making them a popular choice for both food and beverage manufacturers. The ability to incorporate processed mirabelle plums into a variety of value-added products contributes to their leading position in the market.
Mirabelle Plum Market Share Analysis- Fastest Growing Segment by Application
In the Mirabelle Plum Market, the Food and Beverages application segment is poised to grow the fastest over the next five years. This growth is driven by the increasing consumer preference for natural and artisanal products in the food and beverage sector. Mirabelle plums, with their unique flavor and natural sweetness, are gaining popularity in premium food products, including gourmet preserves, craft beverages, and specialty baked goods. The trend towards clean-label and minimally processed ingredients further supports the growth of this segment. Additionally, the expanding use of mirabelle plums in innovative culinary applications and the rise in consumer interest in diverse fruit flavors contribute to this segment's rapid growth.
Mirabelle Plum Market Segmentation
By Type
Raw
Processed
By Application
Food and Beverages
Pharmaceutical
Cosmetics
Personal Care
Others
Countries Analyzed
North America (US, Canada, Mexico)
Europe (Germany, UK, France, Spain, Italy, Russia, Rest of Europe)
Asia Pacific (China, India, Japan, South Korea, Australia, South East Asia, Rest of Asia)
South America (Brazil, Argentina, Rest of South America)
Middle East and Africa (Saudi Arabia, UAE, Rest of Middle East, South Africa, Egypt, Rest of Africa)
Mirabelle Plum Companies Profiled in the Study
Gruenewald Fruchtsaft
Harvey & Brockless
Maison de la Mirabelle
Mazzoni
Sicoly
*- List Not Exhaustive
Chapter 1. TABLE OF CONTENTS
Chapter 2. Introduction to Mirabelle Plum Market
2.1. Market Overview
2.2. Key Statistics and Report Highlights
2.3. Scope of the Comprehensive Study
2.3.1. Market Definition
2.3.2 Countries and Regions Covered
2.3.3 Research Objective
2.3.4 Units, Currency, and Conversions
2.3.5 Industry Value Chain
2.4. Key Market Segments
2.5. Key Companies
2.6. Study Period
Chapter 3. Strategic Analysis Review
3.1. Mirabelle Plum Pricing Analysis and Forecast
3.2. Porter’s Five Forces
3.3. Market Ecosystem
3.4. SWOT Analysis
3.5. Regulatory Scenario
3.3. Effects of Inflation, Russia-Ukraine War, moderating economic growth, and other macroeconomic factors
Chapter 4. Competitive Landscape
4.1. Market Share Analysis
4.1.1. Global Mirabelle Plum Market Share by Company, 2023
4.1.2. Product Offerings of Leading Mirabelle Plum Companies
4.2. Market Entropy
4.2.1. New Product Launches in the Industry
4.2.2. Mergers, Acquisitions, Joint ventures, and Partnerships
4.3. Key Strategies and Best Practices
Chapter 5. Global Market Projections: Best, Reference, and Low Case Scenarios
5.1. Growth Analysis- Case Scenario Definitions
5.2. Low Growth Case Scenario Forecasts
5.3. Reference Growth Case Scenario Forecasts
5.4. High Growth Case Scenario Forecasts
Chapter 6. Market Dynamics
6.1. Mirabelle Plum Market Drivers
6.2. Mirabelle Plum Market Challenges
6.6. Mirabelle Plum Market Opportunities
6.4. Mirabelle Plum Market Trends
Chapter 7. Global Mirabelle Plum Market Outlook Trends
7.1. Global Mirabelle Plum Revenue (USD Million) and CAGR (%) by Type (2021-2032)
7.2. Global Mirabelle Plum Revenue (USD Million) and CAGR (%) by Application (2021-2032)
7.3. Global Mirabelle Plum Revenue (USD Million) and CAGR (%) by Product (2021-2032)
By Type
Raw
Processed
By Application
Food and Beverages
Pharmaceutical
Cosmetics
Personal Care
Others
Chapter 8. Global Mirabelle Plum Regional Analysis and Outlook
8.1. Global Mirabelle Plum Revenue (USD Million) By Regions (2021- 2032)
8.2. North America Mirabelle Plum Revenue (USD Million) by Country (2021-2032)
8.2.1. United States Mirabelle Plum Regional Analysis and Outlook
8.2.2. Canada Mirabelle Plum Regional Analysis and Outlook
8.2.3. Mexico Mirabelle Plum Regional Analysis and Outlook
8.3. Europe Mirabelle Plum Revenue (USD Million), by Country (2021-2032)
8.3.1. Germany Mirabelle Plum Regional Analysis and Outlook
8.3.2. France Mirabelle Plum Regional Analysis and Outlook
8.3.3. United Kingdom Mirabelle Plum Regional Analysis and Outlook
8.3.4. Spain Mirabelle Plum Regional Analysis and Outlook
8.3.5. Italy Mirabelle Plum Regional Analysis and Outlook
8.3.6. Russia Mirabelle Plum Regional Analysis and Outlook
8.3.7. Rest of Europe Mirabelle Plum Regional Analysis and Outlook
8.4. Asia Pacific Mirabelle Plum Revenue (USD Million) by Country (2021-2032)
8.4.1. China Mirabelle Plum Regional Analysis and Outlook
8.4.2. Japan Mirabelle Plum Regional Analysis and Outlook
8.4.3. India Mirabelle Plum Regional Analysis and Outlook
8.4.4. South Korea Mirabelle Plum Regional Analysis and Outlook
8.4.5. Australia Mirabelle Plum Regional Analysis and Outlook
8.4.6. South East Asia Mirabelle Plum Regional Analysis and Outlook
8.4.7. Rest of Asia Pacific Mirabelle Plum Regional Analysis and Outlook
8.5. South America Mirabelle Plum Revenue (USD Million), by Country (2021-2032)
8.5.1. Brazil Mirabelle Plum Regional Analysis and Outlook
8.5.2. Argentina Mirabelle Plum Regional Analysis and Outlook
8.5.3. Rest of South America Mirabelle Plum Regional Analysis and Outlook
8.6. Middle East and Africa Mirabelle Plum Revenue (USD Million) by Country (2021-2032)
8.6.1. Middle East Mirabelle Plum Regional Analysis and Outlook
8.6.2. Africa Mirabelle Plum Regional Analysis and Outlook
Chapter 9. North America Mirabelle Plum Analysis and Outlook
9.1. North America Mirabelle Plum Revenue (USD Million) by Segments (2021-2032)
9.1.1. North America Mirabelle Plum Revenue (USD Million) by Type (2021-2032)
9.1.2. North America Mirabelle Plum Revenue (USD Million) by Application (2021-2032)
9.1.3. North America Mirabelle Plum Revenue (USD Million) by Product (2021-2032)
By Type
Raw
Processed
By Application
Food and Beverages
Pharmaceutical
Cosmetics
Personal Care
Others
Chapter 10. Europe Mirabelle Plum Analysis and Outlook
10.1. Europe Mirabelle Plum Revenue (USD Million), by Segments (USD Million) (2021-2032)
10.1.1. Europe Mirabelle Plum Revenue (USD Million) by Type (2021-2032)
10.1.2. Europe Mirabelle Plum Revenue (USD Million) by Application (2021-2032)
10.1.3. Europe Mirabelle Plum Revenue (USD Million) by Product (2021-2032)
By Type
Raw
Processed
By Application
Food and Beverages
Pharmaceutical
Cosmetics
Personal Care
Others
Chapter 11. Asia Pacific Mirabelle Plum Analysis and Outlook
11.1. Asia Pacific Mirabelle Plum Revenue (USD Million), and Revenue (USD Million) by Segments (2021-2032)
11.1.1. Asia Pacific Mirabelle Plum Revenue (USD Million) by Type (2021-2032)
11.1.2. Asia Pacific Mirabelle Plum Revenue (USD Million) by Application (2021-2032)
11.1.3. Asia Pacific Mirabelle Plum Revenue (USD Million) by Product (2021-2032)
By Type
Raw
Processed
By Application
Food and Beverages
Pharmaceutical
Cosmetics
Personal Care
Others
Chapter 12. South America Mirabelle Plum Analysis and Outlook
12.1. South America Mirabelle Plum Revenue (USD Million), by Segments (2021-2032)
12.1.1. South America Mirabelle Plum Revenue (USD Million) by Type (2021-2032)
12.1.2. South America Mirabelle Plum Revenue (USD Million) by Application (2021-2032)
12.1.3. South America Mirabelle Plum Revenue (USD Million) by Product (2021-2032)
By Type
Raw
Processed
By Application
Food and Beverages
Pharmaceutical
Cosmetics
Personal Care
Others
Chapter 13. Middle East and Africa Mirabelle Plum Analysis and Outlook
13.1. Middle East and Africa Mirabelle Plum Revenue (USD Million), by Segments (2021-2032)
13.1.1. Middle East and Africa Mirabelle Plum Revenue (USD Million) by Type (2021-2032)
13.1.2. Middle East and Africa Mirabelle Plum Revenue (USD Million) by Application (2021-2032)
13.1.3. Middle East and Africa Mirabelle Plum Revenue (USD Million) by Product (2021-2032)
By Type
Raw
Processed
By Application
Food and Beverages
Pharmaceutical
Cosmetics
Personal Care
Others
Chapter 14. Mirabelle Plum Company Profiles
14.1 Business Overview
14.2 Product Profiles
14.3 SWOT Profiles
14.5 Recent Developments
14.6 Financial Profile
List of Companies
Gruenewald Fruchtsaft
Harvey & Brockless
Maison de la Mirabelle
Mazzoni
Sicoly
15. Methodology and Data Sources
15.1 Customization Offerings
15.2 Subscription Services
15.3 Related Reports
15.4 Publisher Expertise
LIST OF TABLES
Table 1 Market Segmentation Analysis
Table 2 Global Mirabelle Plum Market Share of Leading Companies, 2023
Table 3 Product Offerings of Leading Companies
Table 4 Low Growth Scenario Forecasts
Table 5 Reference Case Growth Scenario
Table 6 High Growth Case Scenario
Table 7 Global Mirabelle Plum Revenue (USD Million) And CAGR (%) By Type (2021-2032)
Table 8 Global Mirabelle Plum Revenue (USD Million) And CAGR (%) By Application (2021-2032)
Table 9 Global Mirabelle Plum Revenue (USD Million) And CAGR (%) By Product (2021-2032)
Table 10 Global Mirabelle Plum Market Revenue (USD Million) By Regions (2021-2032)
Table 11 Global Mirabelle Plum Market Share (%) By Regions (2021-2032)
Table 12 North America Mirabelle Plum Revenue (USD Million) By Country (2021-2032)
Table 13 Europe Mirabelle Plum Revenue (USD Million) By Country (2021-2032)
Table 14 Asia Pacific Mirabelle Plum Revenue (USD Million) By Country (2021-2032)
Table 15 South America Mirabelle Plum Revenue (USD Million) By Country (2021-2032)
Table 16 Middle East and Africa Mirabelle Plum Revenue (USD Million) By Region (2021-2032)
Table 17 North America Mirabelle Plum Revenue (USD Million) By Type (2021-2032)
Table 18 North America Mirabelle Plum Revenue (USD Million) By Application (2021-2032)
Table 19 North America Mirabelle Plum Revenue (USD Million) By Product (2021-2032)
Table 20 Europe Mirabelle Plum Revenue (USD Million) By Type (2021-2032)
Table 21 Europe Mirabelle Plum Revenue (USD Million) By Application (2021-2032)
Table 22 Europe Mirabelle Plum Revenue (USD Million) By Product (2021-2032)
Table 23 Asia Pacific Mirabelle Plum Revenue (USD Million) By Type (2021-2032)
Table 24 Asia Pacific Mirabelle Plum Revenue (USD Million) By Application (2021-2032)
Table 25 Asia Pacific Mirabelle Plum Revenue (USD Million) By Product (2021-2032)
Table 26 South America Mirabelle Plum Revenue (USD Million) By Type (2021-2032)
Table 27 South America Mirabelle Plum Revenue (USD Million) By Application (2021-2032)
Table 28 South America Mirabelle Plum Revenue (USD Million) By Product (2021-2032)
Table 29 Middle East and Africa Mirabelle Plum Revenue (USD Million) By Type (2021-2032)
Table 30 Middle East and Africa Mirabelle Plum Revenue (USD Million) By Application (2021-2032)
Table 31 Middle East and Africa Mirabelle Plum Revenue (USD Million) By Product (2021-2032)
LIST OF FIGURES
Figure 1. Market Scope
Figure 2. Pricing Forecasts Per Unit, 2023- 2032
Figure 3. Porter’s Five Forces
Figure 4. Global Mirabelle Plum Market Revenue (USD Million) By Regions (2021-2032)
Figure 5. Global Mirabelle Plum Market Share (%) By Regions (2023)
Figure 6. North America Mirabelle Plum Revenue (USD Million) By Country (2021-2032)
Figure 7. United States Mirabelle Plum Revenue (USD Million) By Country (2021-2032)
Figure 8. Canada Mirabelle Plum Revenue (USD Million) By Country (2021-2032)
Figure 9. Mexico Mirabelle Plum Revenue (USD Million) By Country (2021-2032)
Figure 10. Europe Mirabelle Plum Revenue (USD Million) By Country (2021-2032)
Figure 11. Germany Mirabelle Plum Revenue (USD Million) By Country (2021-2032)
Figure 12. France Mirabelle Plum Revenue (USD Million) By Country (2021-2032)
Figure 13. United Kingdom Mirabelle Plum Revenue (USD Million) By Country (2021-2032)
Figure 14. Spain Mirabelle Plum Revenue (USD Million) By Country (2021-2032)
Figure 15. Italy Mirabelle Plum Revenue (USD Million) By Country (2021-2032)
Figure 16. Russia Mirabelle Plum Revenue (USD Million) By Country (2021-2032)
Figure 17. Rest of Europe Mirabelle Plum Revenue (USD Million) By Country (2021-2032)
Figure 11. Asia Pacific Mirabelle Plum Revenue (USD Million) By Country (2021-2032)
Figure 12. China Mirabelle Plum Revenue (USD Million) By Country (2021-2032)
Figure 13. Japan Mirabelle Plum Revenue (USD Million) By Country (2021-2032)
Figure 14. India Mirabelle Plum Revenue (USD Million) By Country (2021-2032)
Figure 15. South Korea Mirabelle Plum Revenue (USD Million) By Country (2021-2032)
Figure 16. Australia Mirabelle Plum Revenue (USD Million) By Country (2021-2032)
Figure 17. South East Asia Mirabelle Plum Revenue (USD Million) By Country (2021-2032)
Figure 18. South America Mirabelle Plum Revenue (USD Million) By Country (2021-2032)
Figure 19. Brazil Mirabelle Plum Revenue (USD Million) By Country (2021-2032)
Figure 20. Argentina Mirabelle Plum Revenue (USD Million) By Country (2021-2032)
Figure 21. Rest of Asia Pacific Mirabelle Plum Revenue (USD Million) By Country (2021-2032)
Figure 22. Middle East and Africa Mirabelle Plum Revenue (USD Million) By Region (2021-2032)
Figure 23. Saudi Arabia Mirabelle Plum Revenue (USD Million) By Region (2021-2032)
Figure 24. The UAE Mirabelle Plum Revenue (USD Million) By Region (2021-2032)
Figure 25. Rest of Middle East Mirabelle Plum Revenue (USD Million) By Region (2021-2032)
Figure 26. South Africa Mirabelle Plum Revenue (USD Million) By Region (2021-2032)
Figure 27. Africa Mirabelle Plum Revenue (USD Million) By Region (2021-2032)
Figure 28. North America Mirabelle Plum Revenue (USD Million) By Type (2021-2032)
Figure 29. North America Mirabelle Plum Revenue (USD Million) By Application (2021-2032)
Figure 30. North America Mirabelle Plum Revenue (USD Million) By Product (2021-2032)
Figure 31. Europe Mirabelle Plum Revenue (USD Million) By Type (2021-2032)
Figure 32. Europe Mirabelle Plum Revenue (USD Million) By Application (2021-2032)
Figure 33. Europe Mirabelle Plum Revenue (USD Million) By Product (2021-2032)
Figure 34. Asia Pacific Mirabelle Plum Revenue (USD Million) By Type (2021-2032)
Figure 35. Asia Pacific Mirabelle Plum Revenue (USD Million) By Application (2021-2032)
Figure 36. Asia Pacific Mirabelle Plum Revenue (USD Million) By Product (2021-2032)
Figure 37. South America Mirabelle Plum Revenue (USD Million) By Type (2021-2032)
Figure 38. South America Mirabelle Plum Revenue (USD Million) By Application (2021-2032)
Figure 39. South America Mirabelle Plum Revenue (USD Million) By Product (2021-2032)
Figure 40. Middle East and Africa Mirabelle Plum Revenue (USD Million) By Type (2021-2032)
Figure 41. Middle East and Africa Mirabelle Plum Revenue (USD Million) By Application (2021-2032)
Figure 42. Middle East and Africa Mirabelle Plum Revenue (USD Million) By Product (2021-2032)
By Type
Raw
Processed
By Application
Food and Beverages
Pharmaceutical
Cosmetics
Personal Care
Others
Countries Analyzed
North America (US, Canada, Mexico)
Europe (Germany, UK, France, Spain, Italy, Russia, Rest of Europe)
Asia Pacific (China, India, Japan, South Korea, Australia, South East Asia, Rest of Asia)
South America (Brazil, Argentina, Rest of South America)
Middle East and Africa (Saudi Arabia, UAE, Rest of Middle East, South Africa, Egypt, Rest of Africa)
