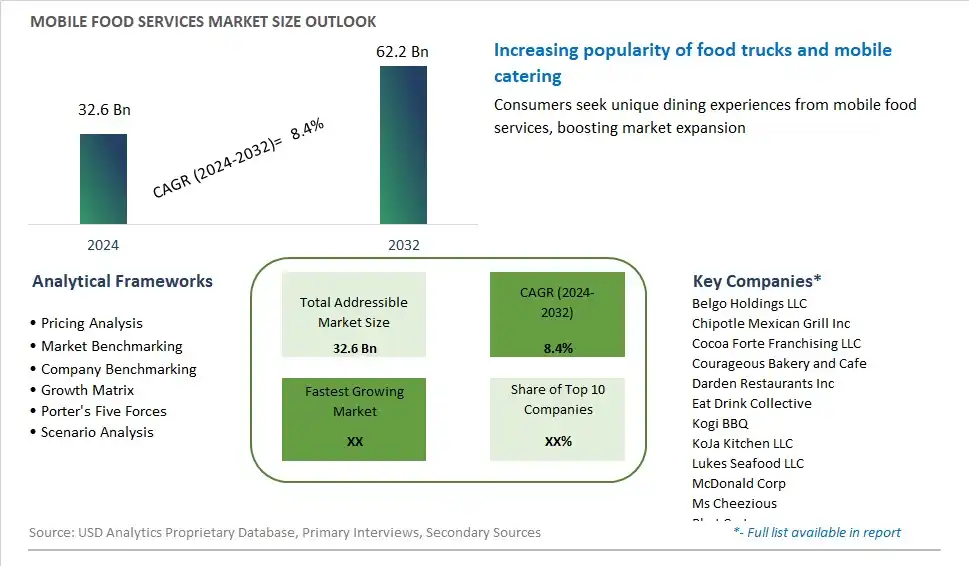
Global Mobile Food Services Market Size is valued at $32.6 Billion in 2024 and is forecast to register a growth rate (CAGR) of 8.4% to reach $62.2 Billion by 2032.
The global Mobile Food Services Market Comprehensive Study analyzes and forecasts the market size across 6 regions and 24 countries for diverse segments -By Type (Food, Beverages), By Application (Food truck, Removable container)
An Introduction to Mobile Food Services Market
In 2024, the mobile food services sector continues to thrive as a dynamic and innovative segment of the food industry, catering to the evolving preferences of urban consumers and the demand for convenient, on-the-go dining experiences. From food trucks and pop-up eateries to mobile app-based delivery services, the landscape of mobile food services is characterized by diversity and adaptability. Technological advancements, including GPS tracking, online ordering platforms, and contactless payment systems, are revolutionizing the way mobile food vendors operate, enhancing efficiency, and expanding reach. Moreover, the proliferation of gourmet and artisanal offerings within the mobile food space reflects a broader trend towards culinary experimentation and niche market segmentation, driving creativity and competition in street food culture.
Mobile Food Services Competitive Landscape
The market report analyses the leading companies in the industry including Belgo Holdings LLC, Chipotle Mexican Grill Inc, Cocoa Forte Franchising LLC, Courageous Bakery and Cafe, Darden Restaurants Inc, Eat Drink Collective, Kogi BBQ, KoJa Kitchen LLC, Lukes Seafood LLC, McDonald Corp, Ms Cheezious, Phat Cart, Restaurant Brands International Inc, The Grilled Cheeserie, The Subway Group, and Others.
Mobile Food Services Market Dynamics
Mobile Food Services Market Trend: Rising Popularity of Food Trucks and Street Food
The most prominent trend in the mobile food services market is the increasing popularity of food trucks and street food vendors. This trend is fueled by the growing consumer appetite for unique, gourmet, and diverse culinary experiences that are often not available in traditional brick-and-mortar restaurants. Food trucks offer a wide range of cuisines, from fusion dishes to local favorites, which appeal to adventurous eaters and those seeking high-quality, affordable dining options. The convenience and accessibility of food trucks, combined with their ability to quickly adapt to changing consumer preferences, have made them a staple in urban areas and at events such as festivals and farmers' markets. Additionally, social media plays a crucial role in this trend, as food truck operators use platforms like Instagram and Twitter to attract customers and build loyal followings.
Market Driver: Urbanization and Busy Lifestyles
A key driver of the mobile food services market is the rapid urbanization and increasingly busy lifestyles of consumers. As more people move to urban areas, the demand for quick, convenient, and on-the-go meal options has surged. Mobile food services cater perfectly to the needs of urban dwellers who often have limited time for traditional dining experiences. The flexibility and mobility of food trucks allow them to operate in high-traffic areas, such as business districts, college campuses, and entertainment venues, where they can serve large numbers of customers efficiently. Moreover, the growing trend of remote working and flexible schedules has increased the appeal of food trucks, as they provide a convenient dining solution for people looking for a quick lunch or snack between work commitments. The emphasis on convenience without compromising on quality or variety makes mobile food services a preferred choice for many urban consumers.
Market Opportunity: Expansion into Corporate and Private Events
There is a significant opportunity for growth in the mobile food services market through expansion into corporate and private events. Food trucks and mobile caterers can tap into the lucrative event catering segment by offering customized menus and unique dining experiences for corporate gatherings, weddings, parties, and other special occasions. Businesses are increasingly looking for innovative and memorable catering options to enhance their events, and mobile food services can provide just that. By partnering with event planners and leveraging their flexibility to serve at various locations, food truck operators can secure a steady stream of revenue. Additionally, offering tailored packages and themed menus can attract a diverse clientele, further boosting market presence and profitability. This opportunity also extends to collaborations with local breweries, wineries, and event venues, creating a symbiotic relationship that benefits both parties and enhances the overall customer experience.
Mobile Food Services Market Share Analysis: Food held the dominant market share in 2024
The "Food" segment reigns as the largest within the Mobile Food Services market due to several compelling reasons. Primarily, food trucks and mobile vendors offering a variety of cuisines have garnered immense popularity among consumers seeking convenient and diverse dining options. The inherent flexibility and mobility of food trucks enable them to cater to a wide array of locations, including festivals, events, office complexes, and high-traffic areas, tapping into a broad customer base. Additionally, the trend towards experiential dining and street food culture has fueled the demand for mobile food services, with consumers relishing the opportunity to indulge in gourmet meals on-the-go. Further, the relatively lower overhead costs associated with operating food trucks compared to traditional brick-and-mortar establishments have incentivized entrepreneurs to venture into this lucrative market, further expanding the food segment's dominance. As a result, amidst the dynamic culinary landscape, the food segment is the cornerstone of the Mobile Food Services market, driving its sustained growth and prominence.
Mobile Food Services Market Share Analysis: Removable Container market is poised to register the fastest growth rae over the forecast period to 2032
The "Removable Container" segment stands out as the fastest-growing within the Mobile Food Services market, propelled by its innovative approach and adaptability to evolving consumer needs. As urbanization reshapes cityscapes and consumer behaviors, the demand for convenient dining experiences has surged, driving the rapid expansion of removable container-based mobile food services. These versatile containers, often converted from shipping containers or modular structures, offer a cost-effective and flexible solution for entrepreneurs to establish food businesses in prime locations with limited space availability. Further, the customizable nature of removable containers allows for seamless integration into various environments, including urban centers, parks, and event venues, enhancing accessibility and visibility to a diverse customer base. Additionally, the sustainability aspect of repurposing containers aligns with the growing eco-conscious consumer mindset, further fueling the segment's growth trajectory. Thus, amidst the dynamic culinary landscape and changing urban dynamics, the removable container segment emerges as a pioneering force, reshaping the Mobile Food Services market with its innovative approach and rapid expansion.
Mobile Food Services Market Segmentation
By Type
Food
Beverages
By Application
Food truck
Removable container
Countries Analyzed
North America (US, Canada, Mexico)
Europe (Germany, UK, France, Spain, Italy, Russia, Rest of Europe)
Asia Pacific (China, India, Japan, South Korea, Australia, South East Asia, Rest of Asia)
South America (Brazil, Argentina, Rest of South America)
Middle East and Africa (Saudi Arabia, UAE, Rest of Middle East, South Africa, Egypt, Rest of Africa)
Mobile Food Services Companies Profiled in the Study
Belgo Holdings LLC
Chipotle Mexican Grill Inc
Cocoa Forte Franchising LLC
Courageous Bakery and Cafe
Darden Restaurants Inc
Eat Drink Collective
Kogi BBQ
KoJa Kitchen LLC
Lukes Seafood LLC
McDonald Corp
Ms Cheezious
Phat Cart
Restaurant Brands International Inc
The Grilled Cheeserie
The Subway Group
*- List Not Exhaustive
Chapter 1. TABLE OF CONTENTS
Chapter 2. Introduction to Mobile Food Services Market
2.1. Market Overview
2.2. Key Statistics and Report Highlights
2.3. Scope of the Comprehensive Study
2.3.1. Market Definition
2.3.2 Countries and Regions Covered
2.3.3 Research Objective
2.3.4 Units, Currency, and Conversions
2.3.5 Industry Value Chain
2.4. Key Market Segments
2.5. Key Companies
2.6. Study Period
Chapter 3. Strategic Analysis Review
3.1. Mobile Food Services Pricing Analysis and Forecast
3.2. Porter’s Five Forces
3.3. Market Ecosystem
3.4. SWOT Analysis
3.5. Regulatory Scenario
3.3. Effects of Inflation, Russia-Ukraine War, moderating economic growth, and other macroeconomic factors
Chapter 4. Competitive Landscape
4.1. Market Share Analysis
4.1.1. Global Mobile Food Services Market Share by Company, 2023
4.1.2. Product Offerings of Leading Mobile Food Services Companies
4.2. Market Entropy
4.2.1. New Product Launches in the Industry
4.2.2. Mergers, Acquisitions, Joint ventures, and Partnerships
4.3. Key Strategies and Best Practices
Chapter 5. Global Market Projections: Best, Reference, and Low Case Scenarios
5.1. Growth Analysis- Case Scenario Definitions
5.2. Low Growth Case Scenario Forecasts
5.3. Reference Growth Case Scenario Forecasts
5.4. High Growth Case Scenario Forecasts
Chapter 6. Market Dynamics
6.1. Mobile Food Services Market Drivers
6.2. Mobile Food Services Market Challenges
6.6. Mobile Food Services Market Opportunities
6.4. Mobile Food Services Market Trends
Chapter 7. Global Mobile Food Services Market Outlook Trends
7.1. Global Mobile Food Services Revenue (USD Million) and CAGR (%) by Type (2021-2032)
7.2. Global Mobile Food Services Revenue (USD Million) and CAGR (%) by Application (2021-2032)
7.3. Global Mobile Food Services Revenue (USD Million) and CAGR (%) by Product (2021-2032)
By Type
Food
Beverages
By Application
Food truck
Removable container
Chapter 8. Global Mobile Food Services Regional Analysis and Outlook
8.1. Global Mobile Food Services Revenue (USD Million) By Regions (2021- 2032)
8.2. North America Mobile Food Services Revenue (USD Million) by Country (2021-2032)
8.2.1. United States Mobile Food Services Regional Analysis and Outlook
8.2.2. Canada Mobile Food Services Regional Analysis and Outlook
8.2.3. Mexico Mobile Food Services Regional Analysis and Outlook
8.3. Europe Mobile Food Services Revenue (USD Million), by Country (2021-2032)
8.3.1. Germany Mobile Food Services Regional Analysis and Outlook
8.3.2. France Mobile Food Services Regional Analysis and Outlook
8.3.3. United Kingdom Mobile Food Services Regional Analysis and Outlook
8.3.4. Spain Mobile Food Services Regional Analysis and Outlook
8.3.5. Italy Mobile Food Services Regional Analysis and Outlook
8.3.6. Russia Mobile Food Services Regional Analysis and Outlook
8.3.7. Rest of Europe Mobile Food Services Regional Analysis and Outlook
8.4. Asia Pacific Mobile Food Services Revenue (USD Million) by Country (2021-2032)
8.4.1. China Mobile Food Services Regional Analysis and Outlook
8.4.2. Japan Mobile Food Services Regional Analysis and Outlook
8.4.3. India Mobile Food Services Regional Analysis and Outlook
8.4.4. South Korea Mobile Food Services Regional Analysis and Outlook
8.4.5. Australia Mobile Food Services Regional Analysis and Outlook
8.4.6. South East Asia Mobile Food Services Regional Analysis and Outlook
8.4.7. Rest of Asia Pacific Mobile Food Services Regional Analysis and Outlook
8.5. South America Mobile Food Services Revenue (USD Million), by Country (2021-2032)
8.5.1. Brazil Mobile Food Services Regional Analysis and Outlook
8.5.2. Argentina Mobile Food Services Regional Analysis and Outlook
8.5.3. Rest of South America Mobile Food Services Regional Analysis and Outlook
8.6. Middle East and Africa Mobile Food Services Revenue (USD Million) by Country (2021-2032)
8.6.1. Middle East Mobile Food Services Regional Analysis and Outlook
8.6.2. Africa Mobile Food Services Regional Analysis and Outlook
Chapter 9. North America Mobile Food Services Analysis and Outlook
9.1. North America Mobile Food Services Revenue (USD Million) by Segments (2021-2032)
9.1.1. North America Mobile Food Services Revenue (USD Million) by Type (2021-2032)
9.1.2. North America Mobile Food Services Revenue (USD Million) by Application (2021-2032)
9.1.3. North America Mobile Food Services Revenue (USD Million) by Product (2021-2032)
By Type
Food
Beverages
By Application
Food truck
Removable container
Chapter 10. Europe Mobile Food Services Analysis and Outlook
10.1. Europe Mobile Food Services Revenue (USD Million), by Segments (USD Million) (2021-2032)
10.1.1. Europe Mobile Food Services Revenue (USD Million) by Type (2021-2032)
10.1.2. Europe Mobile Food Services Revenue (USD Million) by Application (2021-2032)
10.1.3. Europe Mobile Food Services Revenue (USD Million) by Product (2021-2032)
By Type
Food
Beverages
By Application
Food truck
Removable container
Chapter 11. Asia Pacific Mobile Food Services Analysis and Outlook
11.1. Asia Pacific Mobile Food Services Revenue (USD Million), and Revenue (USD Million) by Segments (2021-2032)
11.1.1. Asia Pacific Mobile Food Services Revenue (USD Million) by Type (2021-2032)
11.1.2. Asia Pacific Mobile Food Services Revenue (USD Million) by Application (2021-2032)
11.1.3. Asia Pacific Mobile Food Services Revenue (USD Million) by Product (2021-2032)
By Type
Food
Beverages
By Application
Food truck
Removable container
Chapter 12. South America Mobile Food Services Analysis and Outlook
12.1. South America Mobile Food Services Revenue (USD Million), by Segments (2021-2032)
12.1.1. South America Mobile Food Services Revenue (USD Million) by Type (2021-2032)
12.1.2. South America Mobile Food Services Revenue (USD Million) by Application (2021-2032)
12.1.3. South America Mobile Food Services Revenue (USD Million) by Product (2021-2032)
By Type
Food
Beverages
By Application
Food truck
Removable container
Chapter 13. Middle East and Africa Mobile Food Services Analysis and Outlook
13.1. Middle East and Africa Mobile Food Services Revenue (USD Million), by Segments (2021-2032)
13.1.1. Middle East and Africa Mobile Food Services Revenue (USD Million) by Type (2021-2032)
13.1.2. Middle East and Africa Mobile Food Services Revenue (USD Million) by Application (2021-2032)
13.1.3. Middle East and Africa Mobile Food Services Revenue (USD Million) by Product (2021-2032)
By Type
Food
Beverages
By Application
Food truck
Removable container
Chapter 14. Mobile Food Services Company Profiles
14.1 Business Overview
14.2 Product Profiles
14.3 SWOT Profiles
14.5 Recent Developments
14.6 Financial Profile
List of Companies
Belgo Holdings LLC
Chipotle Mexican Grill Inc
Cocoa Forte Franchising LLC
Courageous Bakery and Cafe
Darden Restaurants Inc
Eat Drink Collective
Kogi BBQ
KoJa Kitchen LLC
Lukes Seafood LLC
McDonald Corp
Ms Cheezious
Phat Cart
Restaurant Brands International Inc
The Grilled Cheeserie
The Subway Group
15. Methodology and Data Sources
15.1 Customization Offerings
15.2 Subscription Services
15.3 Related Reports
15.4 Publisher Expertise
LIST OF TABLES
Table 1 Market Segmentation Analysis
Table 2 Global Mobile Food Services Market Share of Leading Companies, 2023
Table 3 Product Offerings of Leading Companies
Table 4 Low Growth Scenario Forecasts
Table 5 Reference Case Growth Scenario
Table 6 High Growth Case Scenario
Table 7 Global Mobile Food Services Revenue (USD Million) And CAGR (%) By Type (2021-2032)
Table 8 Global Mobile Food Services Revenue (USD Million) And CAGR (%) By Application (2021-2032)
Table 9 Global Mobile Food Services Revenue (USD Million) And CAGR (%) By Product (2021-2032)
Table 10 Global Mobile Food Services Market Revenue (USD Million) By Regions (2021-2032)
Table 11 Global Mobile Food Services Market Share (%) By Regions (2021-2032)
Table 12 North America Mobile Food Services Revenue (USD Million) By Country (2021-2032)
Table 13 Europe Mobile Food Services Revenue (USD Million) By Country (2021-2032)
Table 14 Asia Pacific Mobile Food Services Revenue (USD Million) By Country (2021-2032)
Table 15 South America Mobile Food Services Revenue (USD Million) By Country (2021-2032)
Table 16 Middle East and Africa Mobile Food Services Revenue (USD Million) By Region (2021-2032)
Table 17 North America Mobile Food Services Revenue (USD Million) By Type (2021-2032)
Table 18 North America Mobile Food Services Revenue (USD Million) By Application (2021-2032)
Table 19 North America Mobile Food Services Revenue (USD Million) By Product (2021-2032)
Table 20 Europe Mobile Food Services Revenue (USD Million) By Type (2021-2032)
Table 21 Europe Mobile Food Services Revenue (USD Million) By Application (2021-2032)
Table 22 Europe Mobile Food Services Revenue (USD Million) By Product (2021-2032)
Table 23 Asia Pacific Mobile Food Services Revenue (USD Million) By Type (2021-2032)
Table 24 Asia Pacific Mobile Food Services Revenue (USD Million) By Application (2021-2032)
Table 25 Asia Pacific Mobile Food Services Revenue (USD Million) By Product (2021-2032)
Table 26 South America Mobile Food Services Revenue (USD Million) By Type (2021-2032)
Table 27 South America Mobile Food Services Revenue (USD Million) By Application (2021-2032)
Table 28 South America Mobile Food Services Revenue (USD Million) By Product (2021-2032)
Table 29 Middle East and Africa Mobile Food Services Revenue (USD Million) By Type (2021-2032)
Table 30 Middle East and Africa Mobile Food Services Revenue (USD Million) By Application (2021-2032)
Table 31 Middle East and Africa Mobile Food Services Revenue (USD Million) By Product (2021-2032)
LIST OF FIGURES
Figure 1. Market Scope
Figure 2. Pricing Forecasts Per Unit, 2023- 2032
Figure 3. Porter’s Five Forces
Figure 4. Global Mobile Food Services Market Revenue (USD Million) By Regions (2021-2032)
Figure 5. Global Mobile Food Services Market Share (%) By Regions (2023)
Figure 6. North America Mobile Food Services Revenue (USD Million) By Country (2021-2032)
Figure 7. United States Mobile Food Services Revenue (USD Million) By Country (2021-2032)
Figure 8. Canada Mobile Food Services Revenue (USD Million) By Country (2021-2032)
Figure 9. Mexico Mobile Food Services Revenue (USD Million) By Country (2021-2032)
Figure 10. Europe Mobile Food Services Revenue (USD Million) By Country (2021-2032)
Figure 11. Germany Mobile Food Services Revenue (USD Million) By Country (2021-2032)
Figure 12. France Mobile Food Services Revenue (USD Million) By Country (2021-2032)
Figure 13. United Kingdom Mobile Food Services Revenue (USD Million) By Country (2021-2032)
Figure 14. Spain Mobile Food Services Revenue (USD Million) By Country (2021-2032)
Figure 15. Italy Mobile Food Services Revenue (USD Million) By Country (2021-2032)
Figure 16. Russia Mobile Food Services Revenue (USD Million) By Country (2021-2032)
Figure 17. Rest of Europe Mobile Food Services Revenue (USD Million) By Country (2021-2032)
Figure 11. Asia Pacific Mobile Food Services Revenue (USD Million) By Country (2021-2032)
Figure 12. China Mobile Food Services Revenue (USD Million) By Country (2021-2032)
Figure 13. Japan Mobile Food Services Revenue (USD Million) By Country (2021-2032)
Figure 14. India Mobile Food Services Revenue (USD Million) By Country (2021-2032)
Figure 15. South Korea Mobile Food Services Revenue (USD Million) By Country (2021-2032)
Figure 16. Australia Mobile Food Services Revenue (USD Million) By Country (2021-2032)
Figure 17. South East Asia Mobile Food Services Revenue (USD Million) By Country (2021-2032)
Figure 18. South America Mobile Food Services Revenue (USD Million) By Country (2021-2032)
Figure 19. Brazil Mobile Food Services Revenue (USD Million) By Country (2021-2032)
Figure 20. Argentina Mobile Food Services Revenue (USD Million) By Country (2021-2032)
Figure 21. Rest of Asia Pacific Mobile Food Services Revenue (USD Million) By Country (2021-2032)
Figure 22. Middle East and Africa Mobile Food Services Revenue (USD Million) By Region (2021-2032)
Figure 23. Saudi Arabia Mobile Food Services Revenue (USD Million) By Region (2021-2032)
Figure 24. The UAE Mobile Food Services Revenue (USD Million) By Region (2021-2032)
Figure 25. Rest of Middle East Mobile Food Services Revenue (USD Million) By Region (2021-2032)
Figure 26. South Africa Mobile Food Services Revenue (USD Million) By Region (2021-2032)
Figure 27. Africa Mobile Food Services Revenue (USD Million) By Region (2021-2032)
Figure 28. North America Mobile Food Services Revenue (USD Million) By Type (2021-2032)
Figure 29. North America Mobile Food Services Revenue (USD Million) By Application (2021-2032)
Figure 30. North America Mobile Food Services Revenue (USD Million) By Product (2021-2032)
Figure 31. Europe Mobile Food Services Revenue (USD Million) By Type (2021-2032)
Figure 32. Europe Mobile Food Services Revenue (USD Million) By Application (2021-2032)
Figure 33. Europe Mobile Food Services Revenue (USD Million) By Product (2021-2032)
Figure 34. Asia Pacific Mobile Food Services Revenue (USD Million) By Type (2021-2032)
Figure 35. Asia Pacific Mobile Food Services Revenue (USD Million) By Application (2021-2032)
Figure 36. Asia Pacific Mobile Food Services Revenue (USD Million) By Product (2021-2032)
Figure 37. South America Mobile Food Services Revenue (USD Million) By Type (2021-2032)
Figure 38. South America Mobile Food Services Revenue (USD Million) By Application (2021-2032)
Figure 39. South America Mobile Food Services Revenue (USD Million) By Product (2021-2032)
Figure 40. Middle East and Africa Mobile Food Services Revenue (USD Million) By Type (2021-2032)
Figure 41. Middle East and Africa Mobile Food Services Revenue (USD Million) By Application (2021-2032)
Figure 42. Middle East and Africa Mobile Food Services Revenue (USD Million) By Product (2021-2032)
By Type
Food
Beverages
By Application
Food truck
Removable container
Countries Analyzed
North America (US, Canada, Mexico)
Europe (Germany, UK, France, Spain, Italy, Russia, Rest of Europe)
Asia Pacific (China, India, Japan, South Korea, Australia, South East Asia, Rest of Asia)
South America (Brazil, Argentina, Rest of South America)
Middle East and Africa (Saudi Arabia, UAE, Rest of Middle East, South Africa, Egypt, Rest of Africa)
