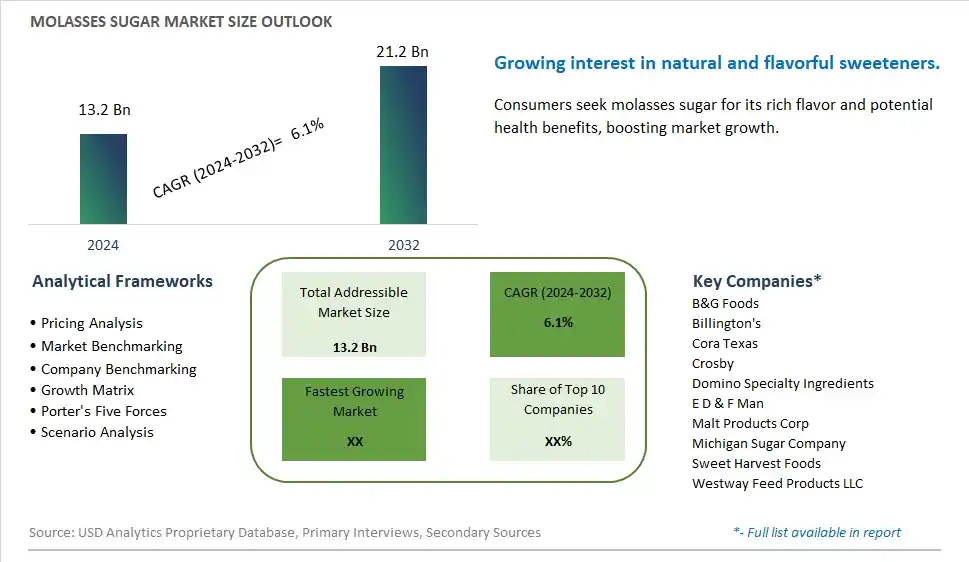
Global Molasses Sugar Market Size is valued at $13.2 Billion in 2024 and is forecast to register a growth rate (CAGR) of 6.1% to reach $21.2 Billion by 2032.
The global Molasses Sugar Market Comprehensive Study analyzes and forecasts the market size across 6 regions and 24 countries for diverse segments -By Type (Light, Dark, Blackstrap), By Application (Food & Beverages, Animal Feed, Biofuel, Others)
An Introduction to Molasses Sugar Market
The molasses sugar market in 2024 is expanding, driven by the demand for natural sweeteners with a rich flavor profile and nutritional benefits. Molasses sugar, derived from the processing of sugar cane or sugar beets, is used in baking, confectionery, and beverages. The market benefits from innovations in molasses processing and sugar formulation that enhance product quality and usability. The trend towards clean label and natural ingredients is influencing product development. Increasing consumer interest in traditional and minimally processed sweeteners is further supporting market growth.
Molasses Sugar Competitive Landscape
The market report analyses the leading companies in the industry including B&G Foods, Billington's, Cora Texas, Crosby, Domino Specialty Ingredients, E D & F Man, Malt Products Corp, Michigan Sugar Company, Sweet Harvest Foods, Westway Feed Products LLC, and Others.
Molasses Sugar Market Dynamics
Molasses Sugar Market Trend: Growing Popularity of Natural Sweeteners
The most prominent trend in the Molasses Sugar Market is the growing popularity of natural sweeteners. Consumers are increasingly seeking alternatives to refined sugar, and molasses sugar, with its rich flavor and nutritional benefits, is becoming a preferred choice.
Molasses Sugar Market Driver: Health Consciousness and Nutritional Benefits
A key driver in the Molasses Sugar Market is health consciousness and the nutritional benefits of molasses sugar. Rich in minerals and antioxidants, molasses sugar is valued for its potential health benefits, supporting its demand among health-conscious consumers.
Molasses Sugar Market Opportunity: Expansion into Specialty Food Products
One significant opportunity in the Molasses Sugar Market lies in the expansion into specialty food products. Companies can innovate by incorporating molasses sugar into a variety of products, such as baked goods, sauces, and beverages, offering a natural and nutritious alternative to traditional sweeteners and driving market growth.
Molasses Sugar Market Share Analysis- Largest Segment by Type
In the Molasses Sugar Market, the Light Molasses segment is the largest. Light molasses is preferred due to its mild flavor and versatility in culinary applications. It is commonly used in baking and cooking, providing a subtle sweetness and moistness to products. The relatively higher demand for light molasses in comparison to dark and blackstrap types, due to its broader acceptance and use in consumer goods, supports its position as the largest segment in the molasses sugar market.
Molasses Sugar Market Share Analysis- Fastest Growing Segment by Application
The Biofuel application segment within the Molasses Sugar Market is poised to grow the fastest over the next five years. This growth is driven by the increasing focus on renewable energy sources and sustainable practices. Molasses is used as a feedstock in the production of bioethanol, which is gaining traction as a cleaner alternative to fossil fuels. Government incentives and regulations supporting renewable energy and biofuel production are expected to accelerate the demand for molasses in this sector. As the global shift towards sustainable energy solutions continues, the biofuel application of molasses is set to experience significant growth.
Molasses Sugar Market Segmentation
By Type
Light
Dark
Blackstrap
By Application
Food & Beverages
Animal Feed
Biofuel
Others
Countries Analyzed
North America (US, Canada, Mexico)
Europe (Germany, UK, France, Spain, Italy, Russia, Rest of Europe)
Asia Pacific (China, India, Japan, South Korea, Australia, South East Asia, Rest of Asia)
South America (Brazil, Argentina, Rest of South America)
Middle East and Africa (Saudi Arabia, UAE, Rest of Middle East, South Africa, Egypt, Rest of Africa)
Molasses Sugar Companies Profiled in the Study
B&G Foods
Billington's
Cora Texas
Crosby
Domino Specialty Ingredients
E D & F Man
Malt Products Corp
Michigan Sugar Company
Sweet Harvest Foods
Westway Feed Products LLC
*- List Not Exhaustive
Chapter 1. TABLE OF CONTENTS
Chapter 2. Introduction to Molasses Sugar Market
2.1. Market Overview
2.2. Key Statistics and Report Highlights
2.3. Scope of the Comprehensive Study
2.3.1. Market Definition
2.3.2 Countries and Regions Covered
2.3.3 Research Objective
2.3.4 Units, Currency, and Conversions
2.3.5 Industry Value Chain
2.4. Key Market Segments
2.5. Key Companies
2.6. Study Period
Chapter 3. Strategic Analysis Review
3.1. Molasses Sugar Pricing Analysis and Forecast
3.2. Porter’s Five Forces
3.3. Market Ecosystem
3.4. SWOT Analysis
3.5. Regulatory Scenario
3.3. Effects of Inflation, Russia-Ukraine War, moderating economic growth, and other macroeconomic factors
Chapter 4. Competitive Landscape
4.1. Market Share Analysis
4.1.1. Global Molasses Sugar Market Share by Company, 2023
4.1.2. Product Offerings of Leading Molasses Sugar Companies
4.2. Market Entropy
4.2.1. New Product Launches in the Industry
4.2.2. Mergers, Acquisitions, Joint ventures, and Partnerships
4.3. Key Strategies and Best Practices
Chapter 5. Global Market Projections: Best, Reference, and Low Case Scenarios
5.1. Growth Analysis- Case Scenario Definitions
5.2. Low Growth Case Scenario Forecasts
5.3. Reference Growth Case Scenario Forecasts
5.4. High Growth Case Scenario Forecasts
Chapter 6. Market Dynamics
6.1. Molasses Sugar Market Drivers
6.2. Molasses Sugar Market Challenges
6.6. Molasses Sugar Market Opportunities
6.4. Molasses Sugar Market Trends
Chapter 7. Global Molasses Sugar Market Outlook Trends
7.1. Global Molasses Sugar Revenue (USD Million) and CAGR (%) by Type (2021-2032)
7.2. Global Molasses Sugar Revenue (USD Million) and CAGR (%) by Application (2021-2032)
7.3. Global Molasses Sugar Revenue (USD Million) and CAGR (%) by Product (2021-2032)
By Type
Light
Dark
Blackstrap
By Application
Food & Beverages
Animal Feed
Biofuel
Others
Chapter 8. Global Molasses Sugar Regional Analysis and Outlook
8.1. Global Molasses Sugar Revenue (USD Million) By Regions (2021- 2032)
8.2. North America Molasses Sugar Revenue (USD Million) by Country (2021-2032)
8.2.1. United States Molasses Sugar Regional Analysis and Outlook
8.2.2. Canada Molasses Sugar Regional Analysis and Outlook
8.2.3. Mexico Molasses Sugar Regional Analysis and Outlook
8.3. Europe Molasses Sugar Revenue (USD Million), by Country (2021-2032)
8.3.1. Germany Molasses Sugar Regional Analysis and Outlook
8.3.2. France Molasses Sugar Regional Analysis and Outlook
8.3.3. United Kingdom Molasses Sugar Regional Analysis and Outlook
8.3.4. Spain Molasses Sugar Regional Analysis and Outlook
8.3.5. Italy Molasses Sugar Regional Analysis and Outlook
8.3.6. Russia Molasses Sugar Regional Analysis and Outlook
8.3.7. Rest of Europe Molasses Sugar Regional Analysis and Outlook
8.4. Asia Pacific Molasses Sugar Revenue (USD Million) by Country (2021-2032)
8.4.1. China Molasses Sugar Regional Analysis and Outlook
8.4.2. Japan Molasses Sugar Regional Analysis and Outlook
8.4.3. India Molasses Sugar Regional Analysis and Outlook
8.4.4. South Korea Molasses Sugar Regional Analysis and Outlook
8.4.5. Australia Molasses Sugar Regional Analysis and Outlook
8.4.6. South East Asia Molasses Sugar Regional Analysis and Outlook
8.4.7. Rest of Asia Pacific Molasses Sugar Regional Analysis and Outlook
8.5. South America Molasses Sugar Revenue (USD Million), by Country (2021-2032)
8.5.1. Brazil Molasses Sugar Regional Analysis and Outlook
8.5.2. Argentina Molasses Sugar Regional Analysis and Outlook
8.5.3. Rest of South America Molasses Sugar Regional Analysis and Outlook
8.6. Middle East and Africa Molasses Sugar Revenue (USD Million) by Country (2021-2032)
8.6.1. Middle East Molasses Sugar Regional Analysis and Outlook
8.6.2. Africa Molasses Sugar Regional Analysis and Outlook
Chapter 9. North America Molasses Sugar Analysis and Outlook
9.1. North America Molasses Sugar Revenue (USD Million) by Segments (2021-2032)
9.1.1. North America Molasses Sugar Revenue (USD Million) by Type (2021-2032)
9.1.2. North America Molasses Sugar Revenue (USD Million) by Application (2021-2032)
9.1.3. North America Molasses Sugar Revenue (USD Million) by Product (2021-2032)
By Type
Light
Dark
Blackstrap
By Application
Food & Beverages
Animal Feed
Biofuel
Others
Chapter 10. Europe Molasses Sugar Analysis and Outlook
10.1. Europe Molasses Sugar Revenue (USD Million), by Segments (USD Million) (2021-2032)
10.1.1. Europe Molasses Sugar Revenue (USD Million) by Type (2021-2032)
10.1.2. Europe Molasses Sugar Revenue (USD Million) by Application (2021-2032)
10.1.3. Europe Molasses Sugar Revenue (USD Million) by Product (2021-2032)
By Type
Light
Dark
Blackstrap
By Application
Food & Beverages
Animal Feed
Biofuel
Others
Chapter 11. Asia Pacific Molasses Sugar Analysis and Outlook
11.1. Asia Pacific Molasses Sugar Revenue (USD Million), and Revenue (USD Million) by Segments (2021-2032)
11.1.1. Asia Pacific Molasses Sugar Revenue (USD Million) by Type (2021-2032)
11.1.2. Asia Pacific Molasses Sugar Revenue (USD Million) by Application (2021-2032)
11.1.3. Asia Pacific Molasses Sugar Revenue (USD Million) by Product (2021-2032)
By Type
Light
Dark
Blackstrap
By Application
Food & Beverages
Animal Feed
Biofuel
Others
Chapter 12. South America Molasses Sugar Analysis and Outlook
12.1. South America Molasses Sugar Revenue (USD Million), by Segments (2021-2032)
12.1.1. South America Molasses Sugar Revenue (USD Million) by Type (2021-2032)
12.1.2. South America Molasses Sugar Revenue (USD Million) by Application (2021-2032)
12.1.3. South America Molasses Sugar Revenue (USD Million) by Product (2021-2032)
By Type
Light
Dark
Blackstrap
By Application
Food & Beverages
Animal Feed
Biofuel
Others
Chapter 13. Middle East and Africa Molasses Sugar Analysis and Outlook
13.1. Middle East and Africa Molasses Sugar Revenue (USD Million), by Segments (2021-2032)
13.1.1. Middle East and Africa Molasses Sugar Revenue (USD Million) by Type (2021-2032)
13.1.2. Middle East and Africa Molasses Sugar Revenue (USD Million) by Application (2021-2032)
13.1.3. Middle East and Africa Molasses Sugar Revenue (USD Million) by Product (2021-2032)
By Type
Light
Dark
Blackstrap
By Application
Food & Beverages
Animal Feed
Biofuel
Others
Chapter 14. Molasses Sugar Company Profiles
14.1 Business Overview
14.2 Product Profiles
14.3 SWOT Profiles
14.5 Recent Developments
14.6 Financial Profile
List of Companies
B&G Foods
Billington's
Cora Texas
Crosby
Domino Specialty Ingredients
E D & F Man
Malt Products Corp
Michigan Sugar Company
Sweet Harvest Foods
Westway Feed Products LLC
15. Methodology and Data Sources
15.1 Customization Offerings
15.2 Subscription Services
15.3 Related Reports
15.4 Publisher Expertise
LIST OF TABLES
Table 1 Market Segmentation Analysis
Table 2 Global Molasses Sugar Market Share of Leading Companies, 2023
Table 3 Product Offerings of Leading Companies
Table 4 Low Growth Scenario Forecasts
Table 5 Reference Case Growth Scenario
Table 6 High Growth Case Scenario
Table 7 Global Molasses Sugar Revenue (USD Million) And CAGR (%) By Type (2021-2032)
Table 8 Global Molasses Sugar Revenue (USD Million) And CAGR (%) By Application (2021-2032)
Table 9 Global Molasses Sugar Revenue (USD Million) And CAGR (%) By Product (2021-2032)
Table 10 Global Molasses Sugar Market Revenue (USD Million) By Regions (2021-2032)
Table 11 Global Molasses Sugar Market Share (%) By Regions (2021-2032)
Table 12 North America Molasses Sugar Revenue (USD Million) By Country (2021-2032)
Table 13 Europe Molasses Sugar Revenue (USD Million) By Country (2021-2032)
Table 14 Asia Pacific Molasses Sugar Revenue (USD Million) By Country (2021-2032)
Table 15 South America Molasses Sugar Revenue (USD Million) By Country (2021-2032)
Table 16 Middle East and Africa Molasses Sugar Revenue (USD Million) By Region (2021-2032)
Table 17 North America Molasses Sugar Revenue (USD Million) By Type (2021-2032)
Table 18 North America Molasses Sugar Revenue (USD Million) By Application (2021-2032)
Table 19 North America Molasses Sugar Revenue (USD Million) By Product (2021-2032)
Table 20 Europe Molasses Sugar Revenue (USD Million) By Type (2021-2032)
Table 21 Europe Molasses Sugar Revenue (USD Million) By Application (2021-2032)
Table 22 Europe Molasses Sugar Revenue (USD Million) By Product (2021-2032)
Table 23 Asia Pacific Molasses Sugar Revenue (USD Million) By Type (2021-2032)
Table 24 Asia Pacific Molasses Sugar Revenue (USD Million) By Application (2021-2032)
Table 25 Asia Pacific Molasses Sugar Revenue (USD Million) By Product (2021-2032)
Table 26 South America Molasses Sugar Revenue (USD Million) By Type (2021-2032)
Table 27 South America Molasses Sugar Revenue (USD Million) By Application (2021-2032)
Table 28 South America Molasses Sugar Revenue (USD Million) By Product (2021-2032)
Table 29 Middle East and Africa Molasses Sugar Revenue (USD Million) By Type (2021-2032)
Table 30 Middle East and Africa Molasses Sugar Revenue (USD Million) By Application (2021-2032)
Table 31 Middle East and Africa Molasses Sugar Revenue (USD Million) By Product (2021-2032)
LIST OF FIGURES
Figure 1. Market Scope
Figure 2. Pricing Forecasts Per Unit, 2023- 2032
Figure 3. Porter’s Five Forces
Figure 4. Global Molasses Sugar Market Revenue (USD Million) By Regions (2021-2032)
Figure 5. Global Molasses Sugar Market Share (%) By Regions (2023)
Figure 6. North America Molasses Sugar Revenue (USD Million) By Country (2021-2032)
Figure 7. United States Molasses Sugar Revenue (USD Million) By Country (2021-2032)
Figure 8. Canada Molasses Sugar Revenue (USD Million) By Country (2021-2032)
Figure 9. Mexico Molasses Sugar Revenue (USD Million) By Country (2021-2032)
Figure 10. Europe Molasses Sugar Revenue (USD Million) By Country (2021-2032)
Figure 11. Germany Molasses Sugar Revenue (USD Million) By Country (2021-2032)
Figure 12. France Molasses Sugar Revenue (USD Million) By Country (2021-2032)
Figure 13. United Kingdom Molasses Sugar Revenue (USD Million) By Country (2021-2032)
Figure 14. Spain Molasses Sugar Revenue (USD Million) By Country (2021-2032)
Figure 15. Italy Molasses Sugar Revenue (USD Million) By Country (2021-2032)
Figure 16. Russia Molasses Sugar Revenue (USD Million) By Country (2021-2032)
Figure 17. Rest of Europe Molasses Sugar Revenue (USD Million) By Country (2021-2032)
Figure 11. Asia Pacific Molasses Sugar Revenue (USD Million) By Country (2021-2032)
Figure 12. China Molasses Sugar Revenue (USD Million) By Country (2021-2032)
Figure 13. Japan Molasses Sugar Revenue (USD Million) By Country (2021-2032)
Figure 14. India Molasses Sugar Revenue (USD Million) By Country (2021-2032)
Figure 15. South Korea Molasses Sugar Revenue (USD Million) By Country (2021-2032)
Figure 16. Australia Molasses Sugar Revenue (USD Million) By Country (2021-2032)
Figure 17. South East Asia Molasses Sugar Revenue (USD Million) By Country (2021-2032)
Figure 18. South America Molasses Sugar Revenue (USD Million) By Country (2021-2032)
Figure 19. Brazil Molasses Sugar Revenue (USD Million) By Country (2021-2032)
Figure 20. Argentina Molasses Sugar Revenue (USD Million) By Country (2021-2032)
Figure 21. Rest of Asia Pacific Molasses Sugar Revenue (USD Million) By Country (2021-2032)
Figure 22. Middle East and Africa Molasses Sugar Revenue (USD Million) By Region (2021-2032)
Figure 23. Saudi Arabia Molasses Sugar Revenue (USD Million) By Region (2021-2032)
Figure 24. The UAE Molasses Sugar Revenue (USD Million) By Region (2021-2032)
Figure 25. Rest of Middle East Molasses Sugar Revenue (USD Million) By Region (2021-2032)
Figure 26. South Africa Molasses Sugar Revenue (USD Million) By Region (2021-2032)
Figure 27. Africa Molasses Sugar Revenue (USD Million) By Region (2021-2032)
Figure 28. North America Molasses Sugar Revenue (USD Million) By Type (2021-2032)
Figure 29. North America Molasses Sugar Revenue (USD Million) By Application (2021-2032)
Figure 30. North America Molasses Sugar Revenue (USD Million) By Product (2021-2032)
Figure 31. Europe Molasses Sugar Revenue (USD Million) By Type (2021-2032)
Figure 32. Europe Molasses Sugar Revenue (USD Million) By Application (2021-2032)
Figure 33. Europe Molasses Sugar Revenue (USD Million) By Product (2021-2032)
Figure 34. Asia Pacific Molasses Sugar Revenue (USD Million) By Type (2021-2032)
Figure 35. Asia Pacific Molasses Sugar Revenue (USD Million) By Application (2021-2032)
Figure 36. Asia Pacific Molasses Sugar Revenue (USD Million) By Product (2021-2032)
Figure 37. South America Molasses Sugar Revenue (USD Million) By Type (2021-2032)
Figure 38. South America Molasses Sugar Revenue (USD Million) By Application (2021-2032)
Figure 39. South America Molasses Sugar Revenue (USD Million) By Product (2021-2032)
Figure 40. Middle East and Africa Molasses Sugar Revenue (USD Million) By Type (2021-2032)
Figure 41. Middle East and Africa Molasses Sugar Revenue (USD Million) By Application (2021-2032)
Figure 42. Middle East and Africa Molasses Sugar Revenue (USD Million) By Product (2021-2032)
By Type
Light
Dark
Blackstrap
By Application
Food & Beverages
Animal Feed
Biofuel
Others
Countries Analyzed
North America (US, Canada, Mexico)
Europe (Germany, UK, France, Spain, Italy, Russia, Rest of Europe)
Asia Pacific (China, India, Japan, South Korea, Australia, South East Asia, Rest of Asia)
South America (Brazil, Argentina, Rest of South America)
Middle East and Africa (Saudi Arabia, UAE, Rest of Middle East, South Africa, Egypt, Rest of Africa)
