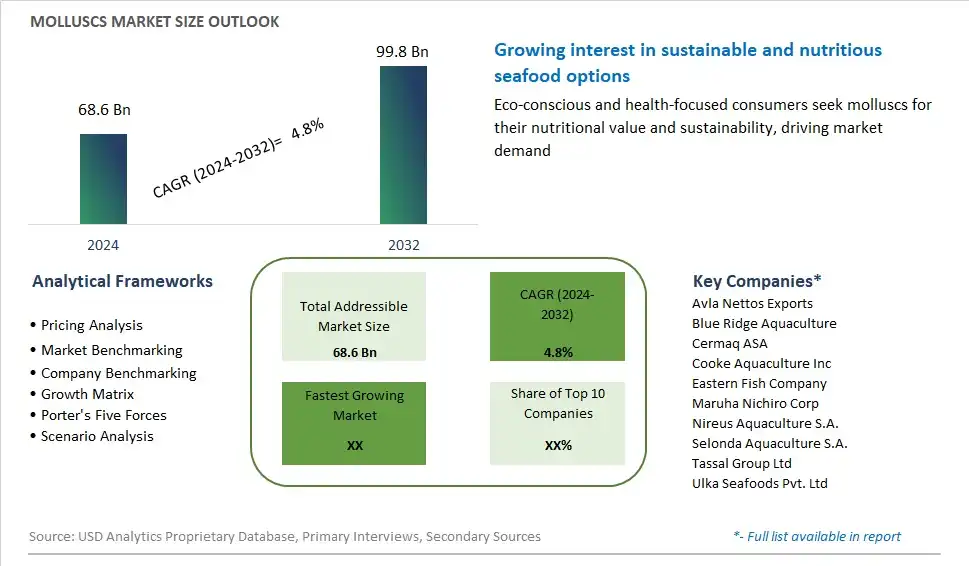
Global Molluscs Market Size is valued at $68.6 Billion in 2024 and is forecast to register a growth rate (CAGR) of 4.8% to reach $99.8 Billion by 2032.
The global Molluscs Market Comprehensive Study analyzes and forecasts the market size across 6 regions and 24 countries for diverse segments -By Species (Crassostrea, Ruditapes philippinarum, Scallops, Others), By Form (Frozen, Canned), By Distribution Channel (Hypermarkets/Supermarkets, Convenience Store, Online, Others)
An Introduction to Molluscs Market
The molluscs market in 2024 is characterized by robust growth, driven by increasing consumer demand for diverse and nutritious seafood options. This market includes a variety of molluscs such as clams, oysters, mussels, and squid, which are prized for their rich flavors, high protein content, and essential nutrients like omega-3 fatty acids, vitamins, and minerals. The health benefits associated with molluscs, including improved heart health and cognitive function, have boosted their popularity among health-conscious consumers. Sustainable aquaculture practices and advancements in harvesting and processing technologies have improved the quality and availability of molluscs, supporting market expansion. Additionally, the culinary versatility of molluscs makes them a favorite in various cuisines, from traditional seafood dishes to gourmet and fusion recipes. As consumers continue to seek out nutritious and environmentally sustainable food sources, the molluscs market is set for continued growth and innovation.
Molluscs Competitive Landscape
The market report analyses the leading companies in the industry including Avla Nettos Exports, Blue Ridge Aquaculture, Cermaq ASA, Cooke Aquaculture Inc, Eastern Fish Company, Maruha Nichiro Corp, Nireus Aquaculture S.A., Selonda Aquaculture S.A., Tassal Group Ltd, Ulka Seafoods Pvt. Ltd, and Others.
Molluscs Market Dynamics
Molluscs Market Trend: Increasing Demand for Sustainable Protein Sources
The market trend in molluscs is witnessing a notable surge due to the increasing demand for sustainable protein sources. With concerns over the environmental impact of traditional livestock farming and overfishing of marine species, consumers are turning to alternative protein options that are more environmentally friendly. Molluscs, including clams, mussels, oysters, and scallops, are known for their low environmental footprint as they require minimal resources and do not contribute to habitat destruction or pollution when farmed sustainably. This trend is fueled by the growing awareness of sustainability issues and the desire among consumers to make eco-conscious food choices, positioning molluscs as an attractive protein source in the market.
Market Driver: Health Benefits and Nutritional Value
A significant driver propelling the molluscs market is the recognition of their health benefits and nutritional value. Molluscs are rich in essential nutrients such as protein, omega-3 fatty acids, vitamins, and minerals, making them a nutritious addition to a balanced diet. With increasing concerns about health and wellness, consumers are seeking foods that not only satisfy their nutritional needs but also offer specific health benefits. Molluscs are known to promote heart health, support brain function, and boost the immune system, making them appealing to health-conscious individuals looking to improve their overall well-being. As the demand for nutritious and functional foods continues to grow, molluscs are poised to meet consumers' dietary preferences and contribute to the expansion of the market.
Market Opportunity: Product Innovation and Diversification
A significant opportunity within the molluscs market lies in product innovation and diversification to cater to evolving consumer preferences and expand market reach. While molluscs have been consumed for centuries, there is potential for introducing new and value-added products that appeal to modern consumers. This includes ready-to-eat mollusc-based snacks, convenient meal solutions, and gourmet seafood offerings targeting discerning consumers. Furthermore, exploring different culinary preparations and flavor profiles can attract consumers seeking unique dining experiences. Additionally, expanding into new geographical markets and distribution channels can help tap into previously untapped segments and drive further growth. By embracing innovation and diversification, stakeholders in the molluscs industry can capitalize on emerging opportunities and solidify their position in the market.
Molluscs Market Share Analysis: By Species (Crassostrea, Ruditapes philippinarum, Scallops, Others)
Scallops are expected to be the fastest-growing segment in the Molluscs Market by species to 2032. Scallops are highly valued for their delicate texture and sweet flavor, making them a popular choice in fine dining and culinary applications. The increasing consumer preference for seafood, driven by its perceived health benefits and the rise of high-protein, low-fat diets, contributes to the growing demand for scallops. Additionally, advancements in aquaculture techniques and sustainable harvesting practices have improved the availability and quality of scallops, further driving market growth. The expansion of the foodservice industry, particularly in emerging markets, also plays a significant role in boosting the demand for scallops.
Molluscs Market Share Analysis: By Form (Frozen, Canned)
The frozen segment is anticipated to be the fastest-growing in the Molluscs Market by form to 2032. Frozen molluscs offer several advantages, including extended shelf life, convenience, and the ability to preserve the nutritional value and flavor of the seafood. The increasing consumer demand for high-quality, ready-to-cook seafood products drives the growth of the frozen segment. Additionally, the expansion of the cold chain infrastructure and improvements in freezing technologies enhance the distribution and availability of frozen molluscs. The rise of e-commerce and online grocery shopping also supports the growth of this segment, as consumers increasingly seek convenient and reliable seafood options that can be delivered directly to their homes.
Molluscs Market Share Analysis: By Distribution Channel (Hypermarkets/Supermarkets, Convenience Store, Online, Others)
The online distribution channel is expected to be the fastest-growing segment in the Molluscs Market by distribution channel to 2032. The shift towards online shopping, driven by the convenience and variety it offers, has significantly impacted the seafood market. Consumers are increasingly turning to e-commerce platforms for their seafood purchases, benefiting from detailed product information, customer reviews, and competitive pricing. The COVID-19 pandemic has further accelerated the adoption of online grocery shopping, making it a preferred option for many consumers. Subscription services and direct-to-consumer models also contribute to the segment's rapid expansion, allowing consumers to receive fresh or frozen molluscs directly at their doorstep with ease.
Molluscs Market Segmentation
By Species
Crassostrea
Ruditapes Philippinarum
Scallops
Others
By Form
Frozen
Canned
By Distribution Channel
Hypermarkets/Supermarkets
Convenience Store
Online
Others
Countries Analyzed
North America (US, Canada, Mexico)
Europe (Germany, UK, France, Spain, Italy, Russia, Rest of Europe)
Asia Pacific (China, India, Japan, South Korea, Australia, South East Asia, Rest of Asia)
South America (Brazil, Argentina, Rest of South America)
Middle East and Africa (Saudi Arabia, UAE, Rest of Middle East, South Africa, Egypt, Rest of Africa)
Molluscs Companies Profiled in the Study
Avla Nettos Exports
Blue Ridge Aquaculture
Cermaq ASA
Cooke Aquaculture Inc
Eastern Fish Company
Maruha Nichiro Corp
Nireus Aquaculture S.A.
Selonda Aquaculture S.A.
Tassal Group Ltd
Ulka Seafoods Pvt. Ltd
*- List Not Exhaustive
Chapter 1. TABLE OF CONTENTS
Chapter 2. Introduction to Molluscs Market
2.1. Market Overview
2.2. Key Statistics and Report Highlights
2.3. Scope of the Comprehensive Study
2.3.1. Market Definition
2.3.2 Countries and Regions Covered
2.3.3 Research Objective
2.3.4 Units, Currency, and Conversions
2.3.5 Industry Value Chain
2.4. Key Market Segments
2.5. Key Companies
2.6. Study Period
Chapter 3. Strategic Analysis Review
3.1. Molluscs Pricing Analysis and Forecast
3.2. Porter’s Five Forces
3.3. Market Ecosystem
3.4. SWOT Analysis
3.5. Regulatory Scenario
3.3. Effects of Inflation, Russia-Ukraine War, moderating economic growth, and other macroeconomic factors
Chapter 4. Competitive Landscape
4.1. Market Share Analysis
4.1.1. Global Molluscs Market Share by Company, 2023
4.1.2. Product Offerings of Leading Molluscs Companies
4.2. Market Entropy
4.2.1. New Product Launches in the Industry
4.2.2. Mergers, Acquisitions, Joint ventures, and Partnerships
4.3. Key Strategies and Best Practices
Chapter 5. Global Market Projections: Best, Reference, and Low Case Scenarios
5.1. Growth Analysis- Case Scenario Definitions
5.2. Low Growth Case Scenario Forecasts
5.3. Reference Growth Case Scenario Forecasts
5.4. High Growth Case Scenario Forecasts
Chapter 6. Market Dynamics
6.1. Molluscs Market Drivers
6.2. Molluscs Market Challenges
6.6. Molluscs Market Opportunities
6.4. Molluscs Market Trends
Chapter 7. Global Molluscs Market Outlook Trends
7.1. Global Molluscs Revenue (USD Million) and CAGR (%) by Type (2021-2032)
7.2. Global Molluscs Revenue (USD Million) and CAGR (%) by Application (2021-2032)
7.3. Global Molluscs Revenue (USD Million) and CAGR (%) by Product (2021-2032)
By Species
Crassostrea
Ruditapes Philippinarum
Scallops
Others
By Form
Frozen
Canned
By Distribution Channel
Hypermarkets/Supermarkets
Convenience Store
Online
Others
Chapter 8. Global Molluscs Regional Analysis and Outlook
8.1. Global Molluscs Revenue (USD Million) By Regions (2021- 2032)
8.2. North America Molluscs Revenue (USD Million) by Country (2021-2032)
8.2.1. United States Molluscs Regional Analysis and Outlook
8.2.2. Canada Molluscs Regional Analysis and Outlook
8.2.3. Mexico Molluscs Regional Analysis and Outlook
8.3. Europe Molluscs Revenue (USD Million), by Country (2021-2032)
8.3.1. Germany Molluscs Regional Analysis and Outlook
8.3.2. France Molluscs Regional Analysis and Outlook
8.3.3. United Kingdom Molluscs Regional Analysis and Outlook
8.3.4. Spain Molluscs Regional Analysis and Outlook
8.3.5. Italy Molluscs Regional Analysis and Outlook
8.3.6. Russia Molluscs Regional Analysis and Outlook
8.3.7. Rest of Europe Molluscs Regional Analysis and Outlook
8.4. Asia Pacific Molluscs Revenue (USD Million) by Country (2021-2032)
8.4.1. China Molluscs Regional Analysis and Outlook
8.4.2. Japan Molluscs Regional Analysis and Outlook
8.4.3. India Molluscs Regional Analysis and Outlook
8.4.4. South Korea Molluscs Regional Analysis and Outlook
8.4.5. Australia Molluscs Regional Analysis and Outlook
8.4.6. South East Asia Molluscs Regional Analysis and Outlook
8.4.7. Rest of Asia Pacific Molluscs Regional Analysis and Outlook
8.5. South America Molluscs Revenue (USD Million), by Country (2021-2032)
8.5.1. Brazil Molluscs Regional Analysis and Outlook
8.5.2. Argentina Molluscs Regional Analysis and Outlook
8.5.3. Rest of South America Molluscs Regional Analysis and Outlook
8.6. Middle East and Africa Molluscs Revenue (USD Million) by Country (2021-2032)
8.6.1. Middle East Molluscs Regional Analysis and Outlook
8.6.2. Africa Molluscs Regional Analysis and Outlook
Chapter 9. North America Molluscs Analysis and Outlook
9.1. North America Molluscs Revenue (USD Million) by Segments (2021-2032)
9.1.1. North America Molluscs Revenue (USD Million) by Type (2021-2032)
9.1.2. North America Molluscs Revenue (USD Million) by Application (2021-2032)
9.1.3. North America Molluscs Revenue (USD Million) by Product (2021-2032)
By Species
Crassostrea
Ruditapes Philippinarum
Scallops
Others
By Form
Frozen
Canned
By Distribution Channel
Hypermarkets/Supermarkets
Convenience Store
Online
Others
Chapter 10. Europe Molluscs Analysis and Outlook
10.1. Europe Molluscs Revenue (USD Million), by Segments (USD Million) (2021-2032)
10.1.1. Europe Molluscs Revenue (USD Million) by Type (2021-2032)
10.1.2. Europe Molluscs Revenue (USD Million) by Application (2021-2032)
10.1.3. Europe Molluscs Revenue (USD Million) by Product (2021-2032)
By Species
Crassostrea
Ruditapes Philippinarum
Scallops
Others
By Form
Frozen
Canned
By Distribution Channel
Hypermarkets/Supermarkets
Convenience Store
Online
Others
Chapter 11. Asia Pacific Molluscs Analysis and Outlook
11.1. Asia Pacific Molluscs Revenue (USD Million), and Revenue (USD Million) by Segments (2021-2032)
11.1.1. Asia Pacific Molluscs Revenue (USD Million) by Type (2021-2032)
11.1.2. Asia Pacific Molluscs Revenue (USD Million) by Application (2021-2032)
11.1.3. Asia Pacific Molluscs Revenue (USD Million) by Product (2021-2032)
By Species
Crassostrea
Ruditapes Philippinarum
Scallops
Others
By Form
Frozen
Canned
By Distribution Channel
Hypermarkets/Supermarkets
Convenience Store
Online
Others
Chapter 12. South America Molluscs Analysis and Outlook
12.1. South America Molluscs Revenue (USD Million), by Segments (2021-2032)
12.1.1. South America Molluscs Revenue (USD Million) by Type (2021-2032)
12.1.2. South America Molluscs Revenue (USD Million) by Application (2021-2032)
12.1.3. South America Molluscs Revenue (USD Million) by Product (2021-2032)
By Species
Crassostrea
Ruditapes Philippinarum
Scallops
Others
By Form
Frozen
Canned
By Distribution Channel
Hypermarkets/Supermarkets
Convenience Store
Online
Others
Chapter 13. Middle East and Africa Molluscs Analysis and Outlook
13.1. Middle East and Africa Molluscs Revenue (USD Million), by Segments (2021-2032)
13.1.1. Middle East and Africa Molluscs Revenue (USD Million) by Type (2021-2032)
13.1.2. Middle East and Africa Molluscs Revenue (USD Million) by Application (2021-2032)
13.1.3. Middle East and Africa Molluscs Revenue (USD Million) by Product (2021-2032)
By Species
Crassostrea
Ruditapes Philippinarum
Scallops
Others
By Form
Frozen
Canned
By Distribution Channel
Hypermarkets/Supermarkets
Convenience Store
Online
Others
Chapter 14. Molluscs Company Profiles
14.1 Business Overview
14.2 Product Profiles
14.3 SWOT Profiles
14.5 Recent Developments
14.6 Financial Profile
List of Companies
Avla Nettos Exports
Blue Ridge Aquaculture
Cermaq ASA
Cooke Aquaculture Inc
Eastern Fish Company
Maruha Nichiro Corp
Nireus Aquaculture S.A.
Selonda Aquaculture S.A.
Tassal Group Ltd
Ulka Seafoods Pvt. Ltd
15. Methodology and Data Sources
15.1 Customization Offerings
15.2 Subscription Services
15.3 Related Reports
15.4 Publisher Expertise
LIST OF TABLES
Table 1 Market Segmentation Analysis
Table 2 Global Molluscs Market Share of Leading Companies, 2023
Table 3 Product Offerings of Leading Companies
Table 4 Low Growth Scenario Forecasts
Table 5 Reference Case Growth Scenario
Table 6 High Growth Case Scenario
Table 7 Global Molluscs Revenue (USD Million) And CAGR (%) By Type (2021-2032)
Table 8 Global Molluscs Revenue (USD Million) And CAGR (%) By Application (2021-2032)
Table 9 Global Molluscs Revenue (USD Million) And CAGR (%) By Product (2021-2032)
Table 10 Global Molluscs Market Revenue (USD Million) By Regions (2021-2032)
Table 11 Global Molluscs Market Share (%) By Regions (2021-2032)
Table 12 North America Molluscs Revenue (USD Million) By Country (2021-2032)
Table 13 Europe Molluscs Revenue (USD Million) By Country (2021-2032)
Table 14 Asia Pacific Molluscs Revenue (USD Million) By Country (2021-2032)
Table 15 South America Molluscs Revenue (USD Million) By Country (2021-2032)
Table 16 Middle East and Africa Molluscs Revenue (USD Million) By Region (2021-2032)
Table 17 North America Molluscs Revenue (USD Million) By Type (2021-2032)
Table 18 North America Molluscs Revenue (USD Million) By Application (2021-2032)
Table 19 North America Molluscs Revenue (USD Million) By Product (2021-2032)
Table 20 Europe Molluscs Revenue (USD Million) By Type (2021-2032)
Table 21 Europe Molluscs Revenue (USD Million) By Application (2021-2032)
Table 22 Europe Molluscs Revenue (USD Million) By Product (2021-2032)
Table 23 Asia Pacific Molluscs Revenue (USD Million) By Type (2021-2032)
Table 24 Asia Pacific Molluscs Revenue (USD Million) By Application (2021-2032)
Table 25 Asia Pacific Molluscs Revenue (USD Million) By Product (2021-2032)
Table 26 South America Molluscs Revenue (USD Million) By Type (2021-2032)
Table 27 South America Molluscs Revenue (USD Million) By Application (2021-2032)
Table 28 South America Molluscs Revenue (USD Million) By Product (2021-2032)
Table 29 Middle East and Africa Molluscs Revenue (USD Million) By Type (2021-2032)
Table 30 Middle East and Africa Molluscs Revenue (USD Million) By Application (2021-2032)
Table 31 Middle East and Africa Molluscs Revenue (USD Million) By Product (2021-2032)
LIST OF FIGURES
Figure 1. Market Scope
Figure 2. Pricing Forecasts Per Unit, 2023- 2032
Figure 3. Porter’s Five Forces
Figure 4. Global Molluscs Market Revenue (USD Million) By Regions (2021-2032)
Figure 5. Global Molluscs Market Share (%) By Regions (2023)
Figure 6. North America Molluscs Revenue (USD Million) By Country (2021-2032)
Figure 7. United States Molluscs Revenue (USD Million) By Country (2021-2032)
Figure 8. Canada Molluscs Revenue (USD Million) By Country (2021-2032)
Figure 9. Mexico Molluscs Revenue (USD Million) By Country (2021-2032)
Figure 10. Europe Molluscs Revenue (USD Million) By Country (2021-2032)
Figure 11. Germany Molluscs Revenue (USD Million) By Country (2021-2032)
Figure 12. France Molluscs Revenue (USD Million) By Country (2021-2032)
Figure 13. United Kingdom Molluscs Revenue (USD Million) By Country (2021-2032)
Figure 14. Spain Molluscs Revenue (USD Million) By Country (2021-2032)
Figure 15. Italy Molluscs Revenue (USD Million) By Country (2021-2032)
Figure 16. Russia Molluscs Revenue (USD Million) By Country (2021-2032)
Figure 17. Rest of Europe Molluscs Revenue (USD Million) By Country (2021-2032)
Figure 11. Asia Pacific Molluscs Revenue (USD Million) By Country (2021-2032)
Figure 12. China Molluscs Revenue (USD Million) By Country (2021-2032)
Figure 13. Japan Molluscs Revenue (USD Million) By Country (2021-2032)
Figure 14. India Molluscs Revenue (USD Million) By Country (2021-2032)
Figure 15. South Korea Molluscs Revenue (USD Million) By Country (2021-2032)
Figure 16. Australia Molluscs Revenue (USD Million) By Country (2021-2032)
Figure 17. South East Asia Molluscs Revenue (USD Million) By Country (2021-2032)
Figure 18. South America Molluscs Revenue (USD Million) By Country (2021-2032)
Figure 19. Brazil Molluscs Revenue (USD Million) By Country (2021-2032)
Figure 20. Argentina Molluscs Revenue (USD Million) By Country (2021-2032)
Figure 21. Rest of Asia Pacific Molluscs Revenue (USD Million) By Country (2021-2032)
Figure 22. Middle East and Africa Molluscs Revenue (USD Million) By Region (2021-2032)
Figure 23. Saudi Arabia Molluscs Revenue (USD Million) By Region (2021-2032)
Figure 24. The UAE Molluscs Revenue (USD Million) By Region (2021-2032)
Figure 25. Rest of Middle East Molluscs Revenue (USD Million) By Region (2021-2032)
Figure 26. South Africa Molluscs Revenue (USD Million) By Region (2021-2032)
Figure 27. Africa Molluscs Revenue (USD Million) By Region (2021-2032)
Figure 28. North America Molluscs Revenue (USD Million) By Type (2021-2032)
Figure 29. North America Molluscs Revenue (USD Million) By Application (2021-2032)
Figure 30. North America Molluscs Revenue (USD Million) By Product (2021-2032)
Figure 31. Europe Molluscs Revenue (USD Million) By Type (2021-2032)
Figure 32. Europe Molluscs Revenue (USD Million) By Application (2021-2032)
Figure 33. Europe Molluscs Revenue (USD Million) By Product (2021-2032)
Figure 34. Asia Pacific Molluscs Revenue (USD Million) By Type (2021-2032)
Figure 35. Asia Pacific Molluscs Revenue (USD Million) By Application (2021-2032)
Figure 36. Asia Pacific Molluscs Revenue (USD Million) By Product (2021-2032)
Figure 37. South America Molluscs Revenue (USD Million) By Type (2021-2032)
Figure 38. South America Molluscs Revenue (USD Million) By Application (2021-2032)
Figure 39. South America Molluscs Revenue (USD Million) By Product (2021-2032)
Figure 40. Middle East and Africa Molluscs Revenue (USD Million) By Type (2021-2032)
Figure 41. Middle East and Africa Molluscs Revenue (USD Million) By Application (2021-2032)
Figure 42. Middle East and Africa Molluscs Revenue (USD Million) By Product (2021-2032)
By Species
Crassostrea
Ruditapes Philippinarum
Scallops
Others
By Form
Frozen
Canned
By Distribution Channel
Hypermarkets/Supermarkets
Convenience Store
Online
Others
Countries Analyzed
North America (US, Canada, Mexico)
Europe (Germany, UK, France, Spain, Italy, Russia, Rest of Europe)
Asia Pacific (China, India, Japan, South Korea, Australia, South East Asia, Rest of Asia)
South America (Brazil, Argentina, Rest of South America)
Middle East and Africa (Saudi Arabia, UAE, Rest of Middle East, South Africa, Egypt, Rest of Africa)
