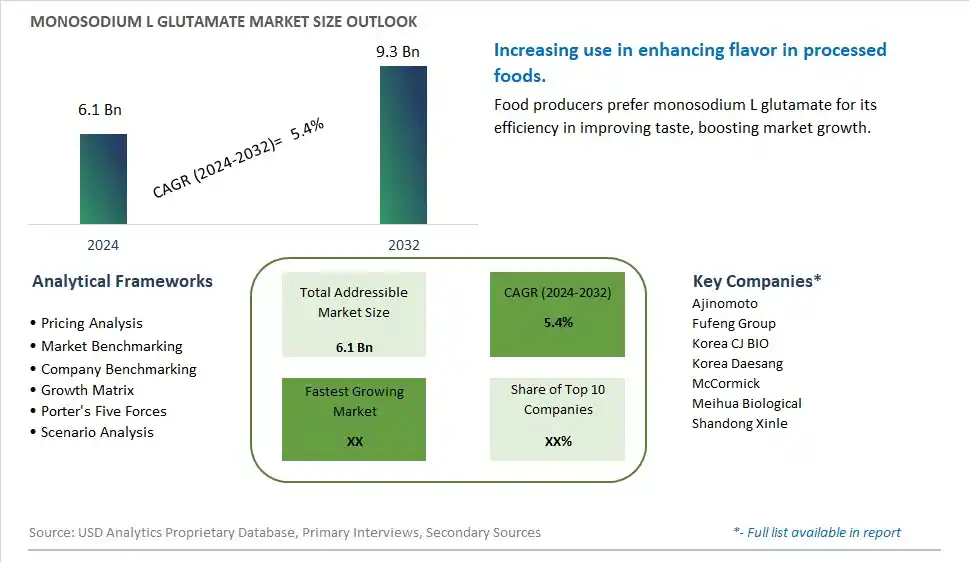
Global Monosodium L Glutamate Market Size is valued at $6.1 Billion in 2024 and is forecast to register a growth rate (CAGR) of 5.4% to reach $9.3 Billion by 2032.
The global Monosodium L Glutamate Market Comprehensive Study analyzes and forecasts the market size across 6 regions and 24 countries for diverse segments -By Type (99% MSG, 80% MSG, Others), By Application (Food Manufacturing, Catering, Family)
An Introduction to Monosodium L Glutamate Market
The Monosodium L-Glutamate (MSG) Market involves the production and sale of MSG, a flavor enhancer commonly used in processed foods, snacks, and restaurant dishes. The market is driven by increasing demand for savory and umami flavors, rising popularity of convenience foods, and growing applications in the food and beverage industry. Additionally, advancements in MSG production technologies and the expansion of product applications support market growth.
Monosodium L glutamate Competitive Landscape
The market report analyses the leading companies in the industry including Ajinomoto, Fufeng Group, Korea CJ BIO, Korea Daesang, McCormick, Meihua Biological, Shandong Xinle, and Others.
Monosodium L glutamate Market Dynamics
Monosodium L Glutamate Market Trend: Increasing Use in Flavor Enhancement
The most prominent trend in the Monosodium L Glutamate (MSG) Market is the increasing use in flavor enhancement. MSG is widely used to improve the umami taste in a variety of savory foods, including processed foods, snacks, and restaurant dishes, driven by consumer demand for flavorful and appetizing meals.
Monosodium L Glutamate Market Driver: Growth of the Processed Food Industry
A key driver in the Monosodium L Glutamate Market is the growth of the processed food industry. As the consumption of convenience and packaged foods continues to rise, there is a growing need for flavor enhancers like MSG that can improve taste and appeal, supporting market expansion.
Monosodium L Glutamate Market Opportunity: Development of Natural and Clean Label Alternatives
One significant opportunity in the Monosodium L Glutamate Market lies in the development of natural and clean label alternatives. Companies can innovate by creating MSG products that meet clean label standards and are derived from natural sources, catering to health-conscious consumers who seek transparency and natural ingredients in their food, driving market growth.
Monosodium L Glutamate Market Share Analysis- Largest Segment by Type
The 99% MSG segment is the largest in the Monosodium L Glutamate (MSG) Market. This dominance is attributed to the higher purity and concentration of monosodium glutamate in this category, which delivers a more intense umami flavor and is highly sought after in both commercial and industrial food processing. The 99% MSG is preferred by manufacturers for its superior flavor-enhancing properties, which are essential in a wide range of food products including processed foods, sauces, and seasoning blends. Additionally, the high purity ensures better solubility and consistency in flavor, making it the preferred choice for applications requiring precise control over taste.
Monosodium L Glutamate Market Share Analysis- Fastest Growing Segment by Application
The Food Manufacturing application segment is poised to grow the fastest in the Monosodium L Glutamate Market over the next five years. This growth is driven by the increasing use of MSG as a flavor enhancer in processed foods and ready-to-eat meals. As food manufacturers seek to meet rising consumer demand for convenient and flavorful products, the demand for MSG in large-scale food production is expanding. Additionally, the growing trend of global cuisines in packaged foods and the need for cost-effective flavor solutions contribute to the accelerated growth of MSG use in the food manufacturing sector.
Monosodium L glutamate Market Segmentation
By Type
99% MSG
80% MSG
Others
By Application
Food Manufacturing
Catering
Family
Countries Analyzed
North America (US, Canada, Mexico)
Europe (Germany, UK, France, Spain, Italy, Russia, Rest of Europe)
Asia Pacific (China, India, Japan, South Korea, Australia, South East Asia, Rest of Asia)
South America (Brazil, Argentina, Rest of South America)
Middle East and Africa (Saudi Arabia, UAE, Rest of Middle East, South Africa, Egypt, Rest of Africa)
Monosodium L glutamate Companies Profiled in the Study
Ajinomoto
Fufeng Group
Korea CJ BIO
Korea Daesang
McCormick
Meihua Biological
Shandong Xinle
*- List Not Exhaustive
Chapter 1. TABLE OF CONTENTS
Chapter 2. Introduction to Monosodium L glutamate Market
2.1. Market Overview
2.2. Key Statistics and Report Highlights
2.3. Scope of the Comprehensive Study
2.3.1. Market Definition
2.3.2 Countries and Regions Covered
2.3.3 Research Objective
2.3.4 Units, Currency, and Conversions
2.3.5 Industry Value Chain
2.4. Key Market Segments
2.5. Key Companies
2.6. Study Period
Chapter 3. Strategic Analysis Review
3.1. Monosodium L glutamate Pricing Analysis and Forecast
3.2. Porter’s Five Forces
3.3. Market Ecosystem
3.4. SWOT Analysis
3.5. Regulatory Scenario
3.3. Effects of Inflation, Russia-Ukraine War, moderating economic growth, and other macroeconomic factors
Chapter 4. Competitive Landscape
4.1. Market Share Analysis
4.1.1. Global Monosodium L glutamate Market Share by Company, 2023
4.1.2. Product Offerings of Leading Monosodium L glutamate Companies
4.2. Market Entropy
4.2.1. New Product Launches in the Industry
4.2.2. Mergers, Acquisitions, Joint ventures, and Partnerships
4.3. Key Strategies and Best Practices
Chapter 5. Global Market Projections: Best, Reference, and Low Case Scenarios
5.1. Growth Analysis- Case Scenario Definitions
5.2. Low Growth Case Scenario Forecasts
5.3. Reference Growth Case Scenario Forecasts
5.4. High Growth Case Scenario Forecasts
Chapter 6. Market Dynamics
6.1. Monosodium L glutamate Market Drivers
6.2. Monosodium L glutamate Market Challenges
6.6. Monosodium L glutamate Market Opportunities
6.4. Monosodium L glutamate Market Trends
Chapter 7. Global Monosodium L glutamate Market Outlook Trends
7.1. Global Monosodium L glutamate Revenue (USD Million) and CAGR (%) by Type (2021-2032)
7.2. Global Monosodium L glutamate Revenue (USD Million) and CAGR (%) by Application (2021-2032)
7.3. Global Monosodium L glutamate Revenue (USD Million) and CAGR (%) by Product (2021-2032)
By Type
99% MSG
80% MSG
Others
By Application
Food Manufacturing
Catering
Family
Chapter 8. Global Monosodium L glutamate Regional Analysis and Outlook
8.1. Global Monosodium L glutamate Revenue (USD Million) By Regions (2021- 2032)
8.2. North America Monosodium L glutamate Revenue (USD Million) by Country (2021-2032)
8.2.1. United States Monosodium L glutamate Regional Analysis and Outlook
8.2.2. Canada Monosodium L glutamate Regional Analysis and Outlook
8.2.3. Mexico Monosodium L glutamate Regional Analysis and Outlook
8.3. Europe Monosodium L glutamate Revenue (USD Million), by Country (2021-2032)
8.3.1. Germany Monosodium L glutamate Regional Analysis and Outlook
8.3.2. France Monosodium L glutamate Regional Analysis and Outlook
8.3.3. United Kingdom Monosodium L glutamate Regional Analysis and Outlook
8.3.4. Spain Monosodium L glutamate Regional Analysis and Outlook
8.3.5. Italy Monosodium L glutamate Regional Analysis and Outlook
8.3.6. Russia Monosodium L glutamate Regional Analysis and Outlook
8.3.7. Rest of Europe Monosodium L glutamate Regional Analysis and Outlook
8.4. Asia Pacific Monosodium L glutamate Revenue (USD Million) by Country (2021-2032)
8.4.1. China Monosodium L glutamate Regional Analysis and Outlook
8.4.2. Japan Monosodium L glutamate Regional Analysis and Outlook
8.4.3. India Monosodium L glutamate Regional Analysis and Outlook
8.4.4. South Korea Monosodium L glutamate Regional Analysis and Outlook
8.4.5. Australia Monosodium L glutamate Regional Analysis and Outlook
8.4.6. South East Asia Monosodium L glutamate Regional Analysis and Outlook
8.4.7. Rest of Asia Pacific Monosodium L glutamate Regional Analysis and Outlook
8.5. South America Monosodium L glutamate Revenue (USD Million), by Country (2021-2032)
8.5.1. Brazil Monosodium L glutamate Regional Analysis and Outlook
8.5.2. Argentina Monosodium L glutamate Regional Analysis and Outlook
8.5.3. Rest of South America Monosodium L glutamate Regional Analysis and Outlook
8.6. Middle East and Africa Monosodium L glutamate Revenue (USD Million) by Country (2021-2032)
8.6.1. Middle East Monosodium L glutamate Regional Analysis and Outlook
8.6.2. Africa Monosodium L glutamate Regional Analysis and Outlook
Chapter 9. North America Monosodium L glutamate Analysis and Outlook
9.1. North America Monosodium L glutamate Revenue (USD Million) by Segments (2021-2032)
9.1.1. North America Monosodium L glutamate Revenue (USD Million) by Type (2021-2032)
9.1.2. North America Monosodium L glutamate Revenue (USD Million) by Application (2021-2032)
9.1.3. North America Monosodium L glutamate Revenue (USD Million) by Product (2021-2032)
By Type
99% MSG
80% MSG
Others
By Application
Food Manufacturing
Catering
Family
Chapter 10. Europe Monosodium L glutamate Analysis and Outlook
10.1. Europe Monosodium L glutamate Revenue (USD Million), by Segments (USD Million) (2021-2032)
10.1.1. Europe Monosodium L glutamate Revenue (USD Million) by Type (2021-2032)
10.1.2. Europe Monosodium L glutamate Revenue (USD Million) by Application (2021-2032)
10.1.3. Europe Monosodium L glutamate Revenue (USD Million) by Product (2021-2032)
By Type
99% MSG
80% MSG
Others
By Application
Food Manufacturing
Catering
Family
Chapter 11. Asia Pacific Monosodium L glutamate Analysis and Outlook
11.1. Asia Pacific Monosodium L glutamate Revenue (USD Million), and Revenue (USD Million) by Segments (2021-2032)
11.1.1. Asia Pacific Monosodium L glutamate Revenue (USD Million) by Type (2021-2032)
11.1.2. Asia Pacific Monosodium L glutamate Revenue (USD Million) by Application (2021-2032)
11.1.3. Asia Pacific Monosodium L glutamate Revenue (USD Million) by Product (2021-2032)
By Type
99% MSG
80% MSG
Others
By Application
Food Manufacturing
Catering
Family
Chapter 12. South America Monosodium L glutamate Analysis and Outlook
12.1. South America Monosodium L glutamate Revenue (USD Million), by Segments (2021-2032)
12.1.1. South America Monosodium L glutamate Revenue (USD Million) by Type (2021-2032)
12.1.2. South America Monosodium L glutamate Revenue (USD Million) by Application (2021-2032)
12.1.3. South America Monosodium L glutamate Revenue (USD Million) by Product (2021-2032)
By Type
99% MSG
80% MSG
Others
By Application
Food Manufacturing
Catering
Family
Chapter 13. Middle East and Africa Monosodium L glutamate Analysis and Outlook
13.1. Middle East and Africa Monosodium L glutamate Revenue (USD Million), by Segments (2021-2032)
13.1.1. Middle East and Africa Monosodium L glutamate Revenue (USD Million) by Type (2021-2032)
13.1.2. Middle East and Africa Monosodium L glutamate Revenue (USD Million) by Application (2021-2032)
13.1.3. Middle East and Africa Monosodium L glutamate Revenue (USD Million) by Product (2021-2032)
By Type
99% MSG
80% MSG
Others
By Application
Food Manufacturing
Catering
Family
Chapter 14. Monosodium L glutamate Company Profiles
14.1 Business Overview
14.2 Product Profiles
14.3 SWOT Profiles
14.5 Recent Developments
14.6 Financial Profile
List of Companies
Ajinomoto
Fufeng Group
Korea CJ BIO
Korea Daesang
McCormick
Meihua Biological
Shandong Xinle
15. Methodology and Data Sources
15.1 Customization Offerings
15.2 Subscription Services
15.3 Related Reports
15.4 Publisher Expertise
LIST OF TABLES
Table 1 Market Segmentation Analysis
Table 2 Global Monosodium L glutamate Market Share of Leading Companies, 2023
Table 3 Product Offerings of Leading Companies
Table 4 Low Growth Scenario Forecasts
Table 5 Reference Case Growth Scenario
Table 6 High Growth Case Scenario
Table 7 Global Monosodium L glutamate Revenue (USD Million) And CAGR (%) By Type (2021-2032)
Table 8 Global Monosodium L glutamate Revenue (USD Million) And CAGR (%) By Application (2021-2032)
Table 9 Global Monosodium L glutamate Revenue (USD Million) And CAGR (%) By Product (2021-2032)
Table 10 Global Monosodium L glutamate Market Revenue (USD Million) By Regions (2021-2032)
Table 11 Global Monosodium L glutamate Market Share (%) By Regions (2021-2032)
Table 12 North America Monosodium L glutamate Revenue (USD Million) By Country (2021-2032)
Table 13 Europe Monosodium L glutamate Revenue (USD Million) By Country (2021-2032)
Table 14 Asia Pacific Monosodium L glutamate Revenue (USD Million) By Country (2021-2032)
Table 15 South America Monosodium L glutamate Revenue (USD Million) By Country (2021-2032)
Table 16 Middle East and Africa Monosodium L glutamate Revenue (USD Million) By Region (2021-2032)
Table 17 North America Monosodium L glutamate Revenue (USD Million) By Type (2021-2032)
Table 18 North America Monosodium L glutamate Revenue (USD Million) By Application (2021-2032)
Table 19 North America Monosodium L glutamate Revenue (USD Million) By Product (2021-2032)
Table 20 Europe Monosodium L glutamate Revenue (USD Million) By Type (2021-2032)
Table 21 Europe Monosodium L glutamate Revenue (USD Million) By Application (2021-2032)
Table 22 Europe Monosodium L glutamate Revenue (USD Million) By Product (2021-2032)
Table 23 Asia Pacific Monosodium L glutamate Revenue (USD Million) By Type (2021-2032)
Table 24 Asia Pacific Monosodium L glutamate Revenue (USD Million) By Application (2021-2032)
Table 25 Asia Pacific Monosodium L glutamate Revenue (USD Million) By Product (2021-2032)
Table 26 South America Monosodium L glutamate Revenue (USD Million) By Type (2021-2032)
Table 27 South America Monosodium L glutamate Revenue (USD Million) By Application (2021-2032)
Table 28 South America Monosodium L glutamate Revenue (USD Million) By Product (2021-2032)
Table 29 Middle East and Africa Monosodium L glutamate Revenue (USD Million) By Type (2021-2032)
Table 30 Middle East and Africa Monosodium L glutamate Revenue (USD Million) By Application (2021-2032)
Table 31 Middle East and Africa Monosodium L glutamate Revenue (USD Million) By Product (2021-2032)
LIST OF FIGURES
Figure 1. Market Scope
Figure 2. Pricing Forecasts Per Unit, 2023- 2032
Figure 3. Porter’s Five Forces
Figure 4. Global Monosodium L glutamate Market Revenue (USD Million) By Regions (2021-2032)
Figure 5. Global Monosodium L glutamate Market Share (%) By Regions (2023)
Figure 6. North America Monosodium L glutamate Revenue (USD Million) By Country (2021-2032)
Figure 7. United States Monosodium L glutamate Revenue (USD Million) By Country (2021-2032)
Figure 8. Canada Monosodium L glutamate Revenue (USD Million) By Country (2021-2032)
Figure 9. Mexico Monosodium L glutamate Revenue (USD Million) By Country (2021-2032)
Figure 10. Europe Monosodium L glutamate Revenue (USD Million) By Country (2021-2032)
Figure 11. Germany Monosodium L glutamate Revenue (USD Million) By Country (2021-2032)
Figure 12. France Monosodium L glutamate Revenue (USD Million) By Country (2021-2032)
Figure 13. United Kingdom Monosodium L glutamate Revenue (USD Million) By Country (2021-2032)
Figure 14. Spain Monosodium L glutamate Revenue (USD Million) By Country (2021-2032)
Figure 15. Italy Monosodium L glutamate Revenue (USD Million) By Country (2021-2032)
Figure 16. Russia Monosodium L glutamate Revenue (USD Million) By Country (2021-2032)
Figure 17. Rest of Europe Monosodium L glutamate Revenue (USD Million) By Country (2021-2032)
Figure 11. Asia Pacific Monosodium L glutamate Revenue (USD Million) By Country (2021-2032)
Figure 12. China Monosodium L glutamate Revenue (USD Million) By Country (2021-2032)
Figure 13. Japan Monosodium L glutamate Revenue (USD Million) By Country (2021-2032)
Figure 14. India Monosodium L glutamate Revenue (USD Million) By Country (2021-2032)
Figure 15. South Korea Monosodium L glutamate Revenue (USD Million) By Country (2021-2032)
Figure 16. Australia Monosodium L glutamate Revenue (USD Million) By Country (2021-2032)
Figure 17. South East Asia Monosodium L glutamate Revenue (USD Million) By Country (2021-2032)
Figure 18. South America Monosodium L glutamate Revenue (USD Million) By Country (2021-2032)
Figure 19. Brazil Monosodium L glutamate Revenue (USD Million) By Country (2021-2032)
Figure 20. Argentina Monosodium L glutamate Revenue (USD Million) By Country (2021-2032)
Figure 21. Rest of Asia Pacific Monosodium L glutamate Revenue (USD Million) By Country (2021-2032)
Figure 22. Middle East and Africa Monosodium L glutamate Revenue (USD Million) By Region (2021-2032)
Figure 23. Saudi Arabia Monosodium L glutamate Revenue (USD Million) By Region (2021-2032)
Figure 24. The UAE Monosodium L glutamate Revenue (USD Million) By Region (2021-2032)
Figure 25. Rest of Middle East Monosodium L glutamate Revenue (USD Million) By Region (2021-2032)
Figure 26. South Africa Monosodium L glutamate Revenue (USD Million) By Region (2021-2032)
Figure 27. Africa Monosodium L glutamate Revenue (USD Million) By Region (2021-2032)
Figure 28. North America Monosodium L glutamate Revenue (USD Million) By Type (2021-2032)
Figure 29. North America Monosodium L glutamate Revenue (USD Million) By Application (2021-2032)
Figure 30. North America Monosodium L glutamate Revenue (USD Million) By Product (2021-2032)
Figure 31. Europe Monosodium L glutamate Revenue (USD Million) By Type (2021-2032)
Figure 32. Europe Monosodium L glutamate Revenue (USD Million) By Application (2021-2032)
Figure 33. Europe Monosodium L glutamate Revenue (USD Million) By Product (2021-2032)
Figure 34. Asia Pacific Monosodium L glutamate Revenue (USD Million) By Type (2021-2032)
Figure 35. Asia Pacific Monosodium L glutamate Revenue (USD Million) By Application (2021-2032)
Figure 36. Asia Pacific Monosodium L glutamate Revenue (USD Million) By Product (2021-2032)
Figure 37. South America Monosodium L glutamate Revenue (USD Million) By Type (2021-2032)
Figure 38. South America Monosodium L glutamate Revenue (USD Million) By Application (2021-2032)
Figure 39. South America Monosodium L glutamate Revenue (USD Million) By Product (2021-2032)
Figure 40. Middle East and Africa Monosodium L glutamate Revenue (USD Million) By Type (2021-2032)
Figure 41. Middle East and Africa Monosodium L glutamate Revenue (USD Million) By Application (2021-2032)
Figure 42. Middle East and Africa Monosodium L glutamate Revenue (USD Million) By Product (2021-2032)
By Type
99% MSG
80% MSG
Others
By Application
Food Manufacturing
Catering
Family
Countries Analyzed
North America (US, Canada, Mexico)
Europe (Germany, UK, France, Spain, Italy, Russia, Rest of Europe)
Asia Pacific (China, India, Japan, South Korea, Australia, South East Asia, Rest of Asia)
South America (Brazil, Argentina, Rest of South America)
Middle East and Africa (Saudi Arabia, UAE, Rest of Middle East, South Africa, Egypt, Rest of Africa)
