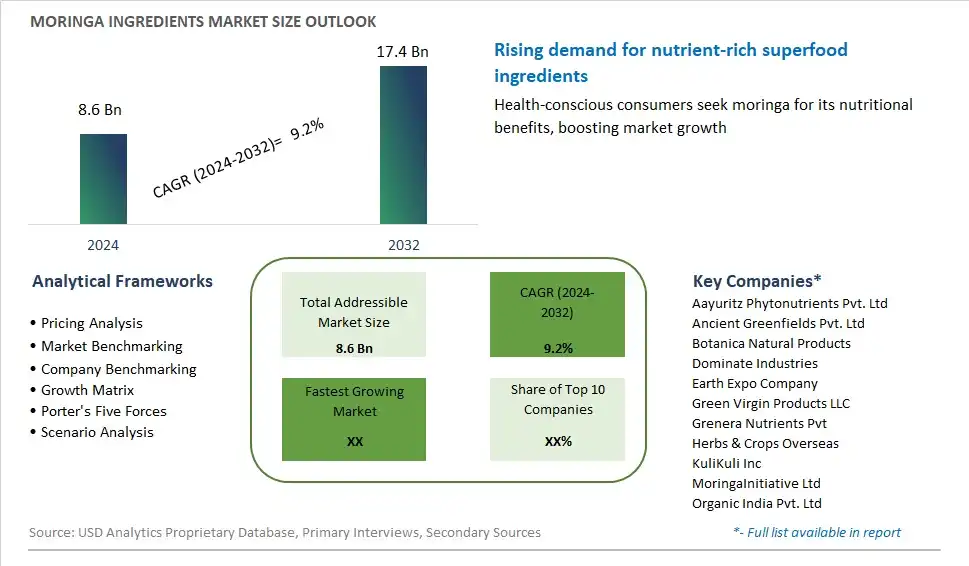
Global Moringa Ingredients Market Size is valued at $8.6 Billion in 2024 and is forecast to register a growth rate (CAGR) of 9.2% to reach $17.4 Billion by 2032.
The global Moringa Ingredients Market Comprehensive Study analyzes and forecasts the market size across 6 regions and 24 countries for diverse segments -By Source (Leaves, Seed, Roots, Flowers, Others), By Origin (Organic, Conventional), By Application (Food & Beverages, Pharmaceuticals, Personal Care, Others)
An Introduction to Moringa Ingredients Market
In 2024, the market for moringa ingredients is experiencing a surge in demand driven by growing awareness of the plant's nutritional and medicinal properties. Moringa, often referred to as the "miracle tree," is prized for its high levels of vitamins, minerals, antioxidants, and bioactive compounds, making it a versatile ingredient in various applications ranging from supplements and functional foods to skincare and cosmetics. As consumers prioritize health and wellness, the popularity of moringa-derived products continues to soar, with the ingredient touted for its anti-inflammatory, antimicrobial, and immune-boosting benefits. Additionally, sustainable sourcing practices and ethical production methods are gaining prominence within the moringa supply chain, aligning with consumer preferences for environmentally conscious and socially responsible products.
Moringa Ingredients Competitive Landscape
The market report analyses the leading companies in the industry including Aayuritz Phytonutrients Pvt. Ltd, Ancient Greenfields Pvt. Ltd, Botanica Natural Products, Dominate Industries, Earth Expo Company, Green Virgin Products LLC, Grenera Nutrients Pvt, Herbs & Crops Overseas, KuliKuli Inc, MoringaInitiative Ltd, Organic India Pvt. Ltd, and Others.
Moringa Ingredients Market Dynamics
Moringa Ingredients Market Trend: Rising Popularity of Superfoods and Health Supplements
The most prominent trend in the moringa ingredients market is the rising popularity of superfoods and health supplements. Moringa, often referred to as the "miracle tree," has gained substantial attention due to its high nutritional content and numerous health benefits, including anti-inflammatory, antioxidant, and anti-diabetic properties. This trend is driven by increasing consumer awareness of the importance of a healthy diet and the growing demand for natural and organic products. The incorporation of moringa into various forms such as powders, capsules, teas, and even beauty products is becoming more common. The superfood trend is also fueled by endorsements from health experts and influencers, which significantly boost consumer interest and adoption. As more scientific studies highlight the benefits of moringa, its popularity as a versatile and potent superfood ingredient continues to rise, making it a staple in the wellness and health supplement industry.
Market Driver: Growing Health Consciousness and Demand for Nutrient-Dense Foods
A major driver of the moringa ingredients market is the growing health consciousness among consumers and the increasing demand for nutrient-dense foods. Modern consumers are becoming more educated about the impact of diet on overall health and are actively seeking out foods that provide comprehensive nutritional benefits. Moringa fits this demand perfectly, as it is rich in vitamins, minerals, and essential amino acids. The rise of lifestyle diseases such as obesity, diabetes, and cardiovascular conditions has further driven consumers towards preventive health measures, including the consumption of superfoods like moringa. Additionally, the trend towards plant-based diets and sustainable eating habits has boosted the appeal of moringa, which is both a highly sustainable crop and a complete plant-based source of nutrition. The emphasis on clean eating and natural health remedies positions moringa as a key ingredient in the health-conscious consumer’s diet.
Market Opportunity: Expansion into Functional Food and Beverage Products
There is a significant opportunity for growth in the moringa ingredients market through expansion into functional food and beverage products. As consumers increasingly look for foods that offer health benefits beyond basic nutrition, incorporating moringa into everyday products such as energy bars, smoothies, juices, and dairy alternatives can meet this demand. Functional foods and beverages are one of the fastest-growing segments in the food industry, and moringa's rich nutrient profile makes it an ideal ingredient for these products. By developing innovative and convenient moringa-infused products, companies can attract health-conscious consumers seeking easy ways to enhance their diets. Furthermore, strategic partnerships with food and beverage manufacturers and retailers can enhance product visibility and availability, driving market penetration. The potential for creating new, health-focused product lines that leverage the superfood status of moringa presents a lucrative opportunity for growth and differentiation in the competitive health and wellness market.
Moringa Ingredients Market Share Analysis: Leaves held the dominant market share in 2024
The "Leaves" segment is the largest within the Moringa Ingredients market, owing to the unparalleled nutritional value and versatile applications of moringa leaves. Renowned for their rich content of vitamins, minerals, and antioxidants, moringa leaves are a powerhouse of health benefits, driving their widespread consumption across various industries, including food, pharmaceuticals, and cosmetics. The growing awareness of the health benefits associated with moringa leaves, such as immune support, anti-inflammatory properties, and cholesterol management, has fueled their demand among health-conscious consumers globally. Further, the leaves' adaptability as a culinary ingredient, herbal supplement, and skincare ingredient amplifies their market appeal, contributing to their dominant market position. Additionally, the sustainable and eco-friendly nature of moringa cultivation further enhances the segment's allure, aligning with the increasing consumer preference for natural and ethically sourced ingredients. As the demand for natural health and wellness products continues to surge, the leaves segment remains at the forefront, driving the sustained growth of the Moringa Ingredients market.
Moringa Ingredients Market Share Analysis: Organic market is poised to register the fastest growth rae over the forecast period to 2032
The "Organic" segment is the fastest-growing within the Moringa Ingredients market, propelled by shifting consumer preferences towards healthier and environmentally sustainable products. As consumers become increasingly conscious of the potential health hazards associated with chemical pesticides and synthetic fertilizers, the demand for organic moringa ingredients has witnessed a significant surge. Organic certification ensures that moringa products are cultivated without the use of harmful chemicals, thereby preserving their nutritional integrity and minimizing environmental impact. Further, the growing preference for ethically sourced and transparently produced ingredients further drives the adoption of organic moringa among health-conscious consumers. Additionally, the increasing availability of organic moringa products in retail outlets and online platforms enhances accessibility, contributing to the segment's rapid growth trajectory. As the organic movement gains momentum globally, the organic segment is poised to continue its exponential growth, reshaping the landscape of the Moringa Ingredients market.
Moringa Ingredients Market Share Analysis: Food & Beverages held the dominant market share in 2024
The "Food & Beverages" segment stands out as the largest within the Moringa Ingredients market, driven by the versatile culinary applications and nutritional benefits of moringa across various food and beverage categories. Moringa's rich nutrient profile, including vitamins, minerals, and antioxidants, has positioned it as a highly sought-after ingredient in the food industry, catering to the growing demand for functional and health-enhancing products. From supplements and energy bars to teas and smoothies, moringa-infused food and beverage products offer consumers a convenient and flavorful way to incorporate wellness into their daily diet. Further, the rising prevalence of lifestyle-related health concerns, coupled with increasing consumer awareness of moringa's medicinal properties, further propels its use in functional foods and beverages. Additionally, the trend towards natural and plant-based ingredients in food formulation drives the adoption of moringa as a sustainable and eco-friendly alternative. As the food and beverage industry continues to innovate and diversify, the dominance of the food & beverages segment in the Moringa Ingredients market is expected to endure, fueled by ongoing consumer demand for nutritious and functional products.
Moringa Ingredients Market Segmentation
By Source
Leaves
Seed
Roots
Flowers
Others
By Origin
Organic
Conventional
By Application
Food & Beverages
Pharmaceuticals
Personal Care
Others
Countries Analyzed
North America (US, Canada, Mexico)
Europe (Germany, UK, France, Spain, Italy, Russia, Rest of Europe)
Asia Pacific (China, India, Japan, South Korea, Australia, South East Asia, Rest of Asia)
South America (Brazil, Argentina, Rest of South America)
Middle East and Africa (Saudi Arabia, UAE, Rest of Middle East, South Africa, Egypt, Rest of Africa)
Moringa Ingredients Companies Profiled in the Study
Aayuritz Phytonutrients Pvt. Ltd
Ancient Greenfields Pvt. Ltd
Botanica Natural Products
Dominate Industries
Earth Expo Company
Green Virgin Products LLC
Grenera Nutrients Pvt
Herbs & Crops Overseas
KuliKuli Inc
MoringaInitiative Ltd
Organic India Pvt. Ltd
*- List Not Exhaustive
Chapter 1. TABLE OF CONTENTS
Chapter 2. Introduction to Moringa Ingredients Market
2.1. Market Overview
2.2. Key Statistics and Report Highlights
2.3. Scope of the Comprehensive Study
2.3.1. Market Definition
2.3.2 Countries and Regions Covered
2.3.3 Research Objective
2.3.4 Units, Currency, and Conversions
2.3.5 Industry Value Chain
2.4. Key Market Segments
2.5. Key Companies
2.6. Study Period
Chapter 3. Strategic Analysis Review
3.1. Moringa Ingredients Pricing Analysis and Forecast
3.2. Porter’s Five Forces
3.3. Market Ecosystem
3.4. SWOT Analysis
3.5. Regulatory Scenario
3.3. Effects of Inflation, Russia-Ukraine War, moderating economic growth, and other macroeconomic factors
Chapter 4. Competitive Landscape
4.1. Market Share Analysis
4.1.1. Global Moringa Ingredients Market Share by Company, 2023
4.1.2. Product Offerings of Leading Moringa Ingredients Companies
4.2. Market Entropy
4.2.1. New Product Launches in the Industry
4.2.2. Mergers, Acquisitions, Joint ventures, and Partnerships
4.3. Key Strategies and Best Practices
Chapter 5. Global Market Projections: Best, Reference, and Low Case Scenarios
5.1. Growth Analysis- Case Scenario Definitions
5.2. Low Growth Case Scenario Forecasts
5.3. Reference Growth Case Scenario Forecasts
5.4. High Growth Case Scenario Forecasts
Chapter 6. Market Dynamics
6.1. Moringa Ingredients Market Drivers
6.2. Moringa Ingredients Market Challenges
6.6. Moringa Ingredients Market Opportunities
6.4. Moringa Ingredients Market Trends
Chapter 7. Global Moringa Ingredients Market Outlook Trends
7.1. Global Moringa Ingredients Revenue (USD Million) and CAGR (%) by Type (2021-2032)
7.2. Global Moringa Ingredients Revenue (USD Million) and CAGR (%) by Application (2021-2032)
7.3. Global Moringa Ingredients Revenue (USD Million) and CAGR (%) by Product (2021-2032)
By Source
Leaves
Seed
Roots
Flowers
Others
By Origin
Organic
Conventional
By Application
Food & Beverages
Pharmaceuticals
Personal Care
Others
Chapter 8. Global Moringa Ingredients Regional Analysis and Outlook
8.1. Global Moringa Ingredients Revenue (USD Million) By Regions (2021- 2032)
8.2. North America Moringa Ingredients Revenue (USD Million) by Country (2021-2032)
8.2.1. United States Moringa Ingredients Regional Analysis and Outlook
8.2.2. Canada Moringa Ingredients Regional Analysis and Outlook
8.2.3. Mexico Moringa Ingredients Regional Analysis and Outlook
8.3. Europe Moringa Ingredients Revenue (USD Million), by Country (2021-2032)
8.3.1. Germany Moringa Ingredients Regional Analysis and Outlook
8.3.2. France Moringa Ingredients Regional Analysis and Outlook
8.3.3. United Kingdom Moringa Ingredients Regional Analysis and Outlook
8.3.4. Spain Moringa Ingredients Regional Analysis and Outlook
8.3.5. Italy Moringa Ingredients Regional Analysis and Outlook
8.3.6. Russia Moringa Ingredients Regional Analysis and Outlook
8.3.7. Rest of Europe Moringa Ingredients Regional Analysis and Outlook
8.4. Asia Pacific Moringa Ingredients Revenue (USD Million) by Country (2021-2032)
8.4.1. China Moringa Ingredients Regional Analysis and Outlook
8.4.2. Japan Moringa Ingredients Regional Analysis and Outlook
8.4.3. India Moringa Ingredients Regional Analysis and Outlook
8.4.4. South Korea Moringa Ingredients Regional Analysis and Outlook
8.4.5. Australia Moringa Ingredients Regional Analysis and Outlook
8.4.6. South East Asia Moringa Ingredients Regional Analysis and Outlook
8.4.7. Rest of Asia Pacific Moringa Ingredients Regional Analysis and Outlook
8.5. South America Moringa Ingredients Revenue (USD Million), by Country (2021-2032)
8.5.1. Brazil Moringa Ingredients Regional Analysis and Outlook
8.5.2. Argentina Moringa Ingredients Regional Analysis and Outlook
8.5.3. Rest of South America Moringa Ingredients Regional Analysis and Outlook
8.6. Middle East and Africa Moringa Ingredients Revenue (USD Million) by Country (2021-2032)
8.6.1. Middle East Moringa Ingredients Regional Analysis and Outlook
8.6.2. Africa Moringa Ingredients Regional Analysis and Outlook
Chapter 9. North America Moringa Ingredients Analysis and Outlook
9.1. North America Moringa Ingredients Revenue (USD Million) by Segments (2021-2032)
9.1.1. North America Moringa Ingredients Revenue (USD Million) by Type (2021-2032)
9.1.2. North America Moringa Ingredients Revenue (USD Million) by Application (2021-2032)
9.1.3. North America Moringa Ingredients Revenue (USD Million) by Product (2021-2032)
By Source
Leaves
Seed
Roots
Flowers
Others
By Origin
Organic
Conventional
By Application
Food & Beverages
Pharmaceuticals
Personal Care
Others
Chapter 10. Europe Moringa Ingredients Analysis and Outlook
10.1. Europe Moringa Ingredients Revenue (USD Million), by Segments (USD Million) (2021-2032)
10.1.1. Europe Moringa Ingredients Revenue (USD Million) by Type (2021-2032)
10.1.2. Europe Moringa Ingredients Revenue (USD Million) by Application (2021-2032)
10.1.3. Europe Moringa Ingredients Revenue (USD Million) by Product (2021-2032)
By Source
Leaves
Seed
Roots
Flowers
Others
By Origin
Organic
Conventional
By Application
Food & Beverages
Pharmaceuticals
Personal Care
Others
Chapter 11. Asia Pacific Moringa Ingredients Analysis and Outlook
11.1. Asia Pacific Moringa Ingredients Revenue (USD Million), and Revenue (USD Million) by Segments (2021-2032)
11.1.1. Asia Pacific Moringa Ingredients Revenue (USD Million) by Type (2021-2032)
11.1.2. Asia Pacific Moringa Ingredients Revenue (USD Million) by Application (2021-2032)
11.1.3. Asia Pacific Moringa Ingredients Revenue (USD Million) by Product (2021-2032)
By Source
Leaves
Seed
Roots
Flowers
Others
By Origin
Organic
Conventional
By Application
Food & Beverages
Pharmaceuticals
Personal Care
Others
Chapter 12. South America Moringa Ingredients Analysis and Outlook
12.1. South America Moringa Ingredients Revenue (USD Million), by Segments (2021-2032)
12.1.1. South America Moringa Ingredients Revenue (USD Million) by Type (2021-2032)
12.1.2. South America Moringa Ingredients Revenue (USD Million) by Application (2021-2032)
12.1.3. South America Moringa Ingredients Revenue (USD Million) by Product (2021-2032)
By Source
Leaves
Seed
Roots
Flowers
Others
By Origin
Organic
Conventional
By Application
Food & Beverages
Pharmaceuticals
Personal Care
Others
Chapter 13. Middle East and Africa Moringa Ingredients Analysis and Outlook
13.1. Middle East and Africa Moringa Ingredients Revenue (USD Million), by Segments (2021-2032)
13.1.1. Middle East and Africa Moringa Ingredients Revenue (USD Million) by Type (2021-2032)
13.1.2. Middle East and Africa Moringa Ingredients Revenue (USD Million) by Application (2021-2032)
13.1.3. Middle East and Africa Moringa Ingredients Revenue (USD Million) by Product (2021-2032)
By Source
Leaves
Seed
Roots
Flowers
Others
By Origin
Organic
Conventional
By Application
Food & Beverages
Pharmaceuticals
Personal Care
Others
Chapter 14. Moringa Ingredients Company Profiles
14.1 Business Overview
14.2 Product Profiles
14.3 SWOT Profiles
14.5 Recent Developments
14.6 Financial Profile
List of Companies
Aayuritz Phytonutrients Pvt. Ltd
Ancient Greenfields Pvt. Ltd
Botanica Natural Products
Dominate Industries
Earth Expo Company
Green Virgin Products LLC
Grenera Nutrients Pvt
Herbs & Crops Overseas
KuliKuli Inc
MoringaInitiative Ltd
Organic India Pvt. Ltd
15. Methodology and Data Sources
15.1 Customization Offerings
15.2 Subscription Services
15.3 Related Reports
15.4 Publisher Expertise
LIST OF TABLES
Table 1 Market Segmentation Analysis
Table 2 Global Moringa Ingredients Market Share of Leading Companies, 2023
Table 3 Product Offerings of Leading Companies
Table 4 Low Growth Scenario Forecasts
Table 5 Reference Case Growth Scenario
Table 6 High Growth Case Scenario
Table 7 Global Moringa Ingredients Revenue (USD Million) And CAGR (%) By Type (2021-2032)
Table 8 Global Moringa Ingredients Revenue (USD Million) And CAGR (%) By Application (2021-2032)
Table 9 Global Moringa Ingredients Revenue (USD Million) And CAGR (%) By Product (2021-2032)
Table 10 Global Moringa Ingredients Market Revenue (USD Million) By Regions (2021-2032)
Table 11 Global Moringa Ingredients Market Share (%) By Regions (2021-2032)
Table 12 North America Moringa Ingredients Revenue (USD Million) By Country (2021-2032)
Table 13 Europe Moringa Ingredients Revenue (USD Million) By Country (2021-2032)
Table 14 Asia Pacific Moringa Ingredients Revenue (USD Million) By Country (2021-2032)
Table 15 South America Moringa Ingredients Revenue (USD Million) By Country (2021-2032)
Table 16 Middle East and Africa Moringa Ingredients Revenue (USD Million) By Region (2021-2032)
Table 17 North America Moringa Ingredients Revenue (USD Million) By Type (2021-2032)
Table 18 North America Moringa Ingredients Revenue (USD Million) By Application (2021-2032)
Table 19 North America Moringa Ingredients Revenue (USD Million) By Product (2021-2032)
Table 20 Europe Moringa Ingredients Revenue (USD Million) By Type (2021-2032)
Table 21 Europe Moringa Ingredients Revenue (USD Million) By Application (2021-2032)
Table 22 Europe Moringa Ingredients Revenue (USD Million) By Product (2021-2032)
Table 23 Asia Pacific Moringa Ingredients Revenue (USD Million) By Type (2021-2032)
Table 24 Asia Pacific Moringa Ingredients Revenue (USD Million) By Application (2021-2032)
Table 25 Asia Pacific Moringa Ingredients Revenue (USD Million) By Product (2021-2032)
Table 26 South America Moringa Ingredients Revenue (USD Million) By Type (2021-2032)
Table 27 South America Moringa Ingredients Revenue (USD Million) By Application (2021-2032)
Table 28 South America Moringa Ingredients Revenue (USD Million) By Product (2021-2032)
Table 29 Middle East and Africa Moringa Ingredients Revenue (USD Million) By Type (2021-2032)
Table 30 Middle East and Africa Moringa Ingredients Revenue (USD Million) By Application (2021-2032)
Table 31 Middle East and Africa Moringa Ingredients Revenue (USD Million) By Product (2021-2032)
LIST OF FIGURES
Figure 1. Market Scope
Figure 2. Pricing Forecasts Per Unit, 2023- 2032
Figure 3. Porter’s Five Forces
Figure 4. Global Moringa Ingredients Market Revenue (USD Million) By Regions (2021-2032)
Figure 5. Global Moringa Ingredients Market Share (%) By Regions (2023)
Figure 6. North America Moringa Ingredients Revenue (USD Million) By Country (2021-2032)
Figure 7. United States Moringa Ingredients Revenue (USD Million) By Country (2021-2032)
Figure 8. Canada Moringa Ingredients Revenue (USD Million) By Country (2021-2032)
Figure 9. Mexico Moringa Ingredients Revenue (USD Million) By Country (2021-2032)
Figure 10. Europe Moringa Ingredients Revenue (USD Million) By Country (2021-2032)
Figure 11. Germany Moringa Ingredients Revenue (USD Million) By Country (2021-2032)
Figure 12. France Moringa Ingredients Revenue (USD Million) By Country (2021-2032)
Figure 13. United Kingdom Moringa Ingredients Revenue (USD Million) By Country (2021-2032)
Figure 14. Spain Moringa Ingredients Revenue (USD Million) By Country (2021-2032)
Figure 15. Italy Moringa Ingredients Revenue (USD Million) By Country (2021-2032)
Figure 16. Russia Moringa Ingredients Revenue (USD Million) By Country (2021-2032)
Figure 17. Rest of Europe Moringa Ingredients Revenue (USD Million) By Country (2021-2032)
Figure 11. Asia Pacific Moringa Ingredients Revenue (USD Million) By Country (2021-2032)
Figure 12. China Moringa Ingredients Revenue (USD Million) By Country (2021-2032)
Figure 13. Japan Moringa Ingredients Revenue (USD Million) By Country (2021-2032)
Figure 14. India Moringa Ingredients Revenue (USD Million) By Country (2021-2032)
Figure 15. South Korea Moringa Ingredients Revenue (USD Million) By Country (2021-2032)
Figure 16. Australia Moringa Ingredients Revenue (USD Million) By Country (2021-2032)
Figure 17. South East Asia Moringa Ingredients Revenue (USD Million) By Country (2021-2032)
Figure 18. South America Moringa Ingredients Revenue (USD Million) By Country (2021-2032)
Figure 19. Brazil Moringa Ingredients Revenue (USD Million) By Country (2021-2032)
Figure 20. Argentina Moringa Ingredients Revenue (USD Million) By Country (2021-2032)
Figure 21. Rest of Asia Pacific Moringa Ingredients Revenue (USD Million) By Country (2021-2032)
Figure 22. Middle East and Africa Moringa Ingredients Revenue (USD Million) By Region (2021-2032)
Figure 23. Saudi Arabia Moringa Ingredients Revenue (USD Million) By Region (2021-2032)
Figure 24. The UAE Moringa Ingredients Revenue (USD Million) By Region (2021-2032)
Figure 25. Rest of Middle East Moringa Ingredients Revenue (USD Million) By Region (2021-2032)
Figure 26. South Africa Moringa Ingredients Revenue (USD Million) By Region (2021-2032)
Figure 27. Africa Moringa Ingredients Revenue (USD Million) By Region (2021-2032)
Figure 28. North America Moringa Ingredients Revenue (USD Million) By Type (2021-2032)
Figure 29. North America Moringa Ingredients Revenue (USD Million) By Application (2021-2032)
Figure 30. North America Moringa Ingredients Revenue (USD Million) By Product (2021-2032)
Figure 31. Europe Moringa Ingredients Revenue (USD Million) By Type (2021-2032)
Figure 32. Europe Moringa Ingredients Revenue (USD Million) By Application (2021-2032)
Figure 33. Europe Moringa Ingredients Revenue (USD Million) By Product (2021-2032)
Figure 34. Asia Pacific Moringa Ingredients Revenue (USD Million) By Type (2021-2032)
Figure 35. Asia Pacific Moringa Ingredients Revenue (USD Million) By Application (2021-2032)
Figure 36. Asia Pacific Moringa Ingredients Revenue (USD Million) By Product (2021-2032)
Figure 37. South America Moringa Ingredients Revenue (USD Million) By Type (2021-2032)
Figure 38. South America Moringa Ingredients Revenue (USD Million) By Application (2021-2032)
Figure 39. South America Moringa Ingredients Revenue (USD Million) By Product (2021-2032)
Figure 40. Middle East and Africa Moringa Ingredients Revenue (USD Million) By Type (2021-2032)
Figure 41. Middle East and Africa Moringa Ingredients Revenue (USD Million) By Application (2021-2032)
Figure 42. Middle East and Africa Moringa Ingredients Revenue (USD Million) By Product (2021-2032)
By Source
Leaves
Seed
Roots
Flowers
Others
By Origin
Organic
Conventional
By Application
Food & Beverages
Pharmaceuticals
Personal Care
Others
Countries Analyzed
North America (US, Canada, Mexico)
Europe (Germany, UK, France, Spain, Italy, Russia, Rest of Europe)
Asia Pacific (China, India, Japan, South Korea, Australia, South East Asia, Rest of Asia)
South America (Brazil, Argentina, Rest of South America)
Middle East and Africa (Saudi Arabia, UAE, Rest of Middle East, South Africa, Egypt, Rest of Africa)
