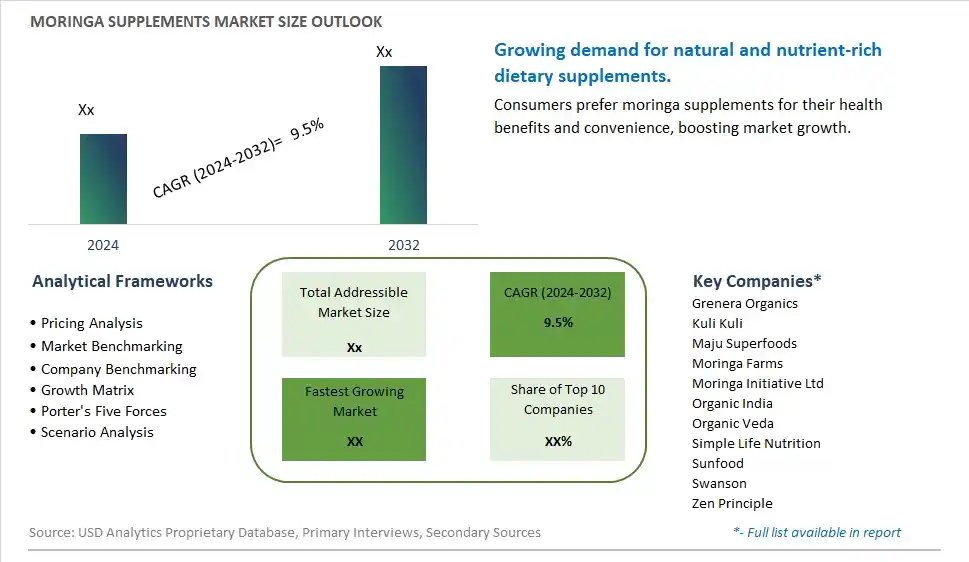
Global Moringa Supplements Market Size is valued at $XX Million in 2024 and is forecast to register a growth rate (CAGR) of 9.5% to reach $XX Million by 2032.
The global Moringa Supplements Market Comprehensive Study analyzes and forecasts the market size across 6 regions and 24 countries for diverse segments -By Type (Moringa Powder, Moringa Capsule, Others), By Application (Supermarkets/Hypermarkets, Specialty Stores, Online Retail, Others)
An Introduction to Moringa Supplements Market
In 2024, the moringa supplements market is thriving, fueled by the growing awareness of the health benefits associated with moringa. Moringa supplements, available in various forms such as capsules, tablets, and powders, offer a convenient way to incorporate the nutritional benefits of moringa into daily diets. The market benefits from innovations in supplement formulation and delivery systems that enhance efficacy and consumer appeal. The trend towards clean label and natural ingredients is influencing product development. Increasing consumer interest in preventive health and wellness, supported by the rise of natural supplements, is further supporting market growth.
Moringa Supplements Competitive Landscape
The market report analyses the leading companies in the industry including Grenera Organics, Kuli Kuli, Maju Superfoods, Moringa Farms, Moringa Initiative Ltd, Organic India, Organic Veda, Simple Life Nutrition, Sunfood, Swanson, Zen Principle, and Others.
Moringa Supplements Market Dynamics
Moringa Supplements Market Trend: Growing Popularity of Natural Health Supplements
The most prominent trend in the Moringa Supplements Market is the growing popularity of natural health supplements. Consumers are increasingly seeking natural and plant-based supplements that offer multiple health benefits, leading to a rise in the demand for moringa supplements, which are known for their rich nutritional profile.
Moringa Supplements Market Driver: Increased Awareness of Health Benefits
A key driver in the Moringa Supplements Market is increased awareness of the health benefits of moringa. Moringa supplements are recognized for their potential to support immune function, enhance energy levels, and improve overall health, driving consumer interest and market demand.
Moringa Supplements Market Opportunity: Innovation in Supplement Formulations
One significant opportunity in the Moringa Supplements Market lies in innovation in supplement formulations. Companies can develop new moringa supplement products that combine moringa with other beneficial ingredients, such as vitamins, minerals, and herbal extracts, to enhance their efficacy and appeal. By offering diverse and effective supplements, manufacturers can attract a broader consumer base and drive market growth.
Moringa Supplements Market Share Analysis- Largest Segment by Type
The Moringa Capsule segment is the largest in the Moringa Supplements Market. Capsules offer convenience, precise dosing, and extended shelf life, which appeal to a wide range of consumers seeking health benefits from moringa. The ease of consumption and the ability to deliver standardized doses make moringa capsules a popular choice among those who prefer dietary supplements in a more controlled form. Additionally, capsules are perceived as a more refined and user-friendly option compared to powders, reinforcing their leading position in the market.
Moringa Supplements Market Share Analysis- Fastest Growing Segment by Application
The Online Retail segment is poised to grow the fastest in the Moringa Supplements Market over the next five years. The rapid expansion of e-commerce platforms and increasing consumer preference for online shopping are driving this growth. Online retail offers the advantage of wider product selection, competitive pricing, and convenience, making it an attractive option for consumers purchasing dietary supplements. Additionally, the ability to reach a global audience and the growing trend of health-conscious consumers seeking supplements online contribute to the accelerated growth of this distribution channel.
Moringa Supplements Market Segmentation
By Type
Moringa Powder
Moringa Capsule
Others
By Application
Supermarkets/Hypermarkets
Specialty Stores
Online Retail
Others
Countries Analyzed
North America (US, Canada, Mexico)
Europe (Germany, UK, France, Spain, Italy, Russia, Rest of Europe)
Asia Pacific (China, India, Japan, South Korea, Australia, South East Asia, Rest of Asia)
South America (Brazil, Argentina, Rest of South America)
Middle East and Africa (Saudi Arabia, UAE, Rest of Middle East, South Africa, Egypt, Rest of Africa)
Moringa Supplements Companies Profiled in the Study
Grenera Organics
Kuli Kuli
Maju Superfoods
Moringa Farms
Moringa Initiative Ltd
Organic India
Organic Veda
Simple Life Nutrition
Sunfood
Swanson
Zen Principle
*- List Not Exhaustive
Chapter 1. TABLE OF CONTENTS
Chapter 2. Introduction to Moringa Supplements Market
2.1. Market Overview
2.2. Key Statistics and Report Highlights
2.3. Scope of the Comprehensive Study
2.3.1. Market Definition
2.3.2 Countries and Regions Covered
2.3.3 Research Objective
2.3.4 Units, Currency, and Conversions
2.3.5 Industry Value Chain
2.4. Key Market Segments
2.5. Key Companies
2.6. Study Period
Chapter 3. Strategic Analysis Review
3.1. Moringa Supplements Pricing Analysis and Forecast
3.2. Porter’s Five Forces
3.3. Market Ecosystem
3.4. SWOT Analysis
3.5. Regulatory Scenario
3.3. Effects of Inflation, Russia-Ukraine War, moderating economic growth, and other macroeconomic factors
Chapter 4. Competitive Landscape
4.1. Market Share Analysis
4.1.1. Global Moringa Supplements Market Share by Company, 2023
4.1.2. Product Offerings of Leading Moringa Supplements Companies
4.2. Market Entropy
4.2.1. New Product Launches in the Industry
4.2.2. Mergers, Acquisitions, Joint ventures, and Partnerships
4.3. Key Strategies and Best Practices
Chapter 5. Global Market Projections: Best, Reference, and Low Case Scenarios
5.1. Growth Analysis- Case Scenario Definitions
5.2. Low Growth Case Scenario Forecasts
5.3. Reference Growth Case Scenario Forecasts
5.4. High Growth Case Scenario Forecasts
Chapter 6. Market Dynamics
6.1. Moringa Supplements Market Drivers
6.2. Moringa Supplements Market Challenges
6.6. Moringa Supplements Market Opportunities
6.4. Moringa Supplements Market Trends
Chapter 7. Global Moringa Supplements Market Outlook Trends
7.1. Global Moringa Supplements Revenue (USD Million) and CAGR (%) by Type (2021-2032)
7.2. Global Moringa Supplements Revenue (USD Million) and CAGR (%) by Application (2021-2032)
7.3. Global Moringa Supplements Revenue (USD Million) and CAGR (%) by Product (2021-2032)
By Type
Moringa Powder
Moringa Capsule
Others
By Application
Supermarkets/Hypermarkets
Specialty Stores
Online Retail
Others
Chapter 8. Global Moringa Supplements Regional Analysis and Outlook
8.1. Global Moringa Supplements Revenue (USD Million) By Regions (2021- 2032)
8.2. North America Moringa Supplements Revenue (USD Million) by Country (2021-2032)
8.2.1. United States Moringa Supplements Regional Analysis and Outlook
8.2.2. Canada Moringa Supplements Regional Analysis and Outlook
8.2.3. Mexico Moringa Supplements Regional Analysis and Outlook
8.3. Europe Moringa Supplements Revenue (USD Million), by Country (2021-2032)
8.3.1. Germany Moringa Supplements Regional Analysis and Outlook
8.3.2. France Moringa Supplements Regional Analysis and Outlook
8.3.3. United Kingdom Moringa Supplements Regional Analysis and Outlook
8.3.4. Spain Moringa Supplements Regional Analysis and Outlook
8.3.5. Italy Moringa Supplements Regional Analysis and Outlook
8.3.6. Russia Moringa Supplements Regional Analysis and Outlook
8.3.7. Rest of Europe Moringa Supplements Regional Analysis and Outlook
8.4. Asia Pacific Moringa Supplements Revenue (USD Million) by Country (2021-2032)
8.4.1. China Moringa Supplements Regional Analysis and Outlook
8.4.2. Japan Moringa Supplements Regional Analysis and Outlook
8.4.3. India Moringa Supplements Regional Analysis and Outlook
8.4.4. South Korea Moringa Supplements Regional Analysis and Outlook
8.4.5. Australia Moringa Supplements Regional Analysis and Outlook
8.4.6. South East Asia Moringa Supplements Regional Analysis and Outlook
8.4.7. Rest of Asia Pacific Moringa Supplements Regional Analysis and Outlook
8.5. South America Moringa Supplements Revenue (USD Million), by Country (2021-2032)
8.5.1. Brazil Moringa Supplements Regional Analysis and Outlook
8.5.2. Argentina Moringa Supplements Regional Analysis and Outlook
8.5.3. Rest of South America Moringa Supplements Regional Analysis and Outlook
8.6. Middle East and Africa Moringa Supplements Revenue (USD Million) by Country (2021-2032)
8.6.1. Middle East Moringa Supplements Regional Analysis and Outlook
8.6.2. Africa Moringa Supplements Regional Analysis and Outlook
Chapter 9. North America Moringa Supplements Analysis and Outlook
9.1. North America Moringa Supplements Revenue (USD Million) by Segments (2021-2032)
9.1.1. North America Moringa Supplements Revenue (USD Million) by Type (2021-2032)
9.1.2. North America Moringa Supplements Revenue (USD Million) by Application (2021-2032)
9.1.3. North America Moringa Supplements Revenue (USD Million) by Product (2021-2032)
By Type
Moringa Powder
Moringa Capsule
Others
By Application
Supermarkets/Hypermarkets
Specialty Stores
Online Retail
Others
Chapter 10. Europe Moringa Supplements Analysis and Outlook
10.1. Europe Moringa Supplements Revenue (USD Million), by Segments (USD Million) (2021-2032)
10.1.1. Europe Moringa Supplements Revenue (USD Million) by Type (2021-2032)
10.1.2. Europe Moringa Supplements Revenue (USD Million) by Application (2021-2032)
10.1.3. Europe Moringa Supplements Revenue (USD Million) by Product (2021-2032)
By Type
Moringa Powder
Moringa Capsule
Others
By Application
Supermarkets/Hypermarkets
Specialty Stores
Online Retail
Others
Chapter 11. Asia Pacific Moringa Supplements Analysis and Outlook
11.1. Asia Pacific Moringa Supplements Revenue (USD Million), and Revenue (USD Million) by Segments (2021-2032)
11.1.1. Asia Pacific Moringa Supplements Revenue (USD Million) by Type (2021-2032)
11.1.2. Asia Pacific Moringa Supplements Revenue (USD Million) by Application (2021-2032)
11.1.3. Asia Pacific Moringa Supplements Revenue (USD Million) by Product (2021-2032)
By Type
Moringa Powder
Moringa Capsule
Others
By Application
Supermarkets/Hypermarkets
Specialty Stores
Online Retail
Others
Chapter 12. South America Moringa Supplements Analysis and Outlook
12.1. South America Moringa Supplements Revenue (USD Million), by Segments (2021-2032)
12.1.1. South America Moringa Supplements Revenue (USD Million) by Type (2021-2032)
12.1.2. South America Moringa Supplements Revenue (USD Million) by Application (2021-2032)
12.1.3. South America Moringa Supplements Revenue (USD Million) by Product (2021-2032)
By Type
Moringa Powder
Moringa Capsule
Others
By Application
Supermarkets/Hypermarkets
Specialty Stores
Online Retail
Others
Chapter 13. Middle East and Africa Moringa Supplements Analysis and Outlook
13.1. Middle East and Africa Moringa Supplements Revenue (USD Million), by Segments (2021-2032)
13.1.1. Middle East and Africa Moringa Supplements Revenue (USD Million) by Type (2021-2032)
13.1.2. Middle East and Africa Moringa Supplements Revenue (USD Million) by Application (2021-2032)
13.1.3. Middle East and Africa Moringa Supplements Revenue (USD Million) by Product (2021-2032)
By Type
Moringa Powder
Moringa Capsule
Others
By Application
Supermarkets/Hypermarkets
Specialty Stores
Online Retail
Others
Chapter 14. Moringa Supplements Company Profiles
14.1 Business Overview
14.2 Product Profiles
14.3 SWOT Profiles
14.5 Recent Developments
14.6 Financial Profile
List of Companies
Grenera Organics
Kuli Kuli
Maju Superfoods
Moringa Farms
Moringa Initiative Ltd
Organic India
Organic Veda
Simple Life Nutrition
Sunfood
Swanson
Zen Principle
15. Methodology and Data Sources
15.1 Customization Offerings
15.2 Subscription Services
15.3 Related Reports
15.4 Publisher Expertise
LIST OF TABLES
Table 1 Market Segmentation Analysis
Table 2 Global Moringa Supplements Market Share of Leading Companies, 2023
Table 3 Product Offerings of Leading Companies
Table 4 Low Growth Scenario Forecasts
Table 5 Reference Case Growth Scenario
Table 6 High Growth Case Scenario
Table 7 Global Moringa Supplements Revenue (USD Million) And CAGR (%) By Type (2021-2032)
Table 8 Global Moringa Supplements Revenue (USD Million) And CAGR (%) By Application (2021-2032)
Table 9 Global Moringa Supplements Revenue (USD Million) And CAGR (%) By Product (2021-2032)
Table 10 Global Moringa Supplements Market Revenue (USD Million) By Regions (2021-2032)
Table 11 Global Moringa Supplements Market Share (%) By Regions (2021-2032)
Table 12 North America Moringa Supplements Revenue (USD Million) By Country (2021-2032)
Table 13 Europe Moringa Supplements Revenue (USD Million) By Country (2021-2032)
Table 14 Asia Pacific Moringa Supplements Revenue (USD Million) By Country (2021-2032)
Table 15 South America Moringa Supplements Revenue (USD Million) By Country (2021-2032)
Table 16 Middle East and Africa Moringa Supplements Revenue (USD Million) By Region (2021-2032)
Table 17 North America Moringa Supplements Revenue (USD Million) By Type (2021-2032)
Table 18 North America Moringa Supplements Revenue (USD Million) By Application (2021-2032)
Table 19 North America Moringa Supplements Revenue (USD Million) By Product (2021-2032)
Table 20 Europe Moringa Supplements Revenue (USD Million) By Type (2021-2032)
Table 21 Europe Moringa Supplements Revenue (USD Million) By Application (2021-2032)
Table 22 Europe Moringa Supplements Revenue (USD Million) By Product (2021-2032)
Table 23 Asia Pacific Moringa Supplements Revenue (USD Million) By Type (2021-2032)
Table 24 Asia Pacific Moringa Supplements Revenue (USD Million) By Application (2021-2032)
Table 25 Asia Pacific Moringa Supplements Revenue (USD Million) By Product (2021-2032)
Table 26 South America Moringa Supplements Revenue (USD Million) By Type (2021-2032)
Table 27 South America Moringa Supplements Revenue (USD Million) By Application (2021-2032)
Table 28 South America Moringa Supplements Revenue (USD Million) By Product (2021-2032)
Table 29 Middle East and Africa Moringa Supplements Revenue (USD Million) By Type (2021-2032)
Table 30 Middle East and Africa Moringa Supplements Revenue (USD Million) By Application (2021-2032)
Table 31 Middle East and Africa Moringa Supplements Revenue (USD Million) By Product (2021-2032)
LIST OF FIGURES
Figure 1. Market Scope
Figure 2. Pricing Forecasts Per Unit, 2023- 2032
Figure 3. Porter’s Five Forces
Figure 4. Global Moringa Supplements Market Revenue (USD Million) By Regions (2021-2032)
Figure 5. Global Moringa Supplements Market Share (%) By Regions (2023)
Figure 6. North America Moringa Supplements Revenue (USD Million) By Country (2021-2032)
Figure 7. United States Moringa Supplements Revenue (USD Million) By Country (2021-2032)
Figure 8. Canada Moringa Supplements Revenue (USD Million) By Country (2021-2032)
Figure 9. Mexico Moringa Supplements Revenue (USD Million) By Country (2021-2032)
Figure 10. Europe Moringa Supplements Revenue (USD Million) By Country (2021-2032)
Figure 11. Germany Moringa Supplements Revenue (USD Million) By Country (2021-2032)
Figure 12. France Moringa Supplements Revenue (USD Million) By Country (2021-2032)
Figure 13. United Kingdom Moringa Supplements Revenue (USD Million) By Country (2021-2032)
Figure 14. Spain Moringa Supplements Revenue (USD Million) By Country (2021-2032)
Figure 15. Italy Moringa Supplements Revenue (USD Million) By Country (2021-2032)
Figure 16. Russia Moringa Supplements Revenue (USD Million) By Country (2021-2032)
Figure 17. Rest of Europe Moringa Supplements Revenue (USD Million) By Country (2021-2032)
Figure 11. Asia Pacific Moringa Supplements Revenue (USD Million) By Country (2021-2032)
Figure 12. China Moringa Supplements Revenue (USD Million) By Country (2021-2032)
Figure 13. Japan Moringa Supplements Revenue (USD Million) By Country (2021-2032)
Figure 14. India Moringa Supplements Revenue (USD Million) By Country (2021-2032)
Figure 15. South Korea Moringa Supplements Revenue (USD Million) By Country (2021-2032)
Figure 16. Australia Moringa Supplements Revenue (USD Million) By Country (2021-2032)
Figure 17. South East Asia Moringa Supplements Revenue (USD Million) By Country (2021-2032)
Figure 18. South America Moringa Supplements Revenue (USD Million) By Country (2021-2032)
Figure 19. Brazil Moringa Supplements Revenue (USD Million) By Country (2021-2032)
Figure 20. Argentina Moringa Supplements Revenue (USD Million) By Country (2021-2032)
Figure 21. Rest of Asia Pacific Moringa Supplements Revenue (USD Million) By Country (2021-2032)
Figure 22. Middle East and Africa Moringa Supplements Revenue (USD Million) By Region (2021-2032)
Figure 23. Saudi Arabia Moringa Supplements Revenue (USD Million) By Region (2021-2032)
Figure 24. The UAE Moringa Supplements Revenue (USD Million) By Region (2021-2032)
Figure 25. Rest of Middle East Moringa Supplements Revenue (USD Million) By Region (2021-2032)
Figure 26. South Africa Moringa Supplements Revenue (USD Million) By Region (2021-2032)
Figure 27. Africa Moringa Supplements Revenue (USD Million) By Region (2021-2032)
Figure 28. North America Moringa Supplements Revenue (USD Million) By Type (2021-2032)
Figure 29. North America Moringa Supplements Revenue (USD Million) By Application (2021-2032)
Figure 30. North America Moringa Supplements Revenue (USD Million) By Product (2021-2032)
Figure 31. Europe Moringa Supplements Revenue (USD Million) By Type (2021-2032)
Figure 32. Europe Moringa Supplements Revenue (USD Million) By Application (2021-2032)
Figure 33. Europe Moringa Supplements Revenue (USD Million) By Product (2021-2032)
Figure 34. Asia Pacific Moringa Supplements Revenue (USD Million) By Type (2021-2032)
Figure 35. Asia Pacific Moringa Supplements Revenue (USD Million) By Application (2021-2032)
Figure 36. Asia Pacific Moringa Supplements Revenue (USD Million) By Product (2021-2032)
Figure 37. South America Moringa Supplements Revenue (USD Million) By Type (2021-2032)
Figure 38. South America Moringa Supplements Revenue (USD Million) By Application (2021-2032)
Figure 39. South America Moringa Supplements Revenue (USD Million) By Product (2021-2032)
Figure 40. Middle East and Africa Moringa Supplements Revenue (USD Million) By Type (2021-2032)
Figure 41. Middle East and Africa Moringa Supplements Revenue (USD Million) By Application (2021-2032)
Figure 42. Middle East and Africa Moringa Supplements Revenue (USD Million) By Product (2021-2032)
By Type
Moringa Powder
Moringa Capsule
Others
By Application
Supermarkets/Hypermarkets
Specialty Stores
Online Retail
Others
Countries Analyzed
North America (US, Canada, Mexico)
Europe (Germany, UK, France, Spain, Italy, Russia, Rest of Europe)
Asia Pacific (China, India, Japan, South Korea, Australia, South East Asia, Rest of Asia)
South America (Brazil, Argentina, Rest of South America)
Middle East and Africa (Saudi Arabia, UAE, Rest of Middle East, South Africa, Egypt, Rest of Africa)
