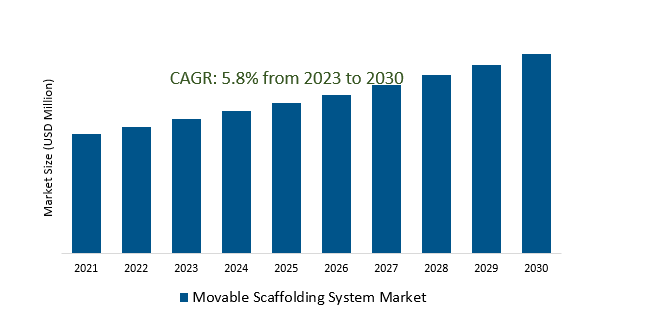
The Movable Scaffolding System Market Size is estimated to register 5.8% growth over the forecast period from 2023 to 2030.
Movable Scaffolding System Market Overview
The global trend of urbanization has led to an increase in construction activities, including the development of infrastructure such as bridges, highways, railways, and buildings leading to the market growth. Movable scaffolding systems with enhanced safety features, such as guardrails, anti-slip surfaces, and improved stability mechanisms, are becoming more prevalent. Increasing emphasis on worker safety and adherence to stringent safety regulations in the construction industry drives the adoption of advanced and safer movable scaffolding systems. Manufacturers are designing scaffolding systems that are not only safe and sturdy but also ergonomic and user-friendly, ensuring ease of assembly, operation, and dismantling by workers. Rapid economic growth and infrastructure development in emerging economies are creating a significant opportunity for the movable scaffolding system market.
Movable Scaffolding System Market Dynamics
Market Trends- Safety-Centric Innovations Drive the Evolution of Movable Scaffolding Systems.
Manufacturers are prioritizing the development of systems equipped with improved stability mechanisms, such as reinforced bases and enhanced weight distribution, to prevent tipping or collapsing.
Anti-slip surfaces, guardrails, and toe boards are becoming standard features, providing additional protection against falls and accidents, thereby driving the market growth.
Additionally, advancements in material sciences are leading to the use of high-strength yet lightweight materials that maintain durability without compromising maneuverability, thereby offering a safer and more manageable scaffolding experience.
Market Driver- Driving Innovations in Response to Reduced Labor Availability and increased focus on Eco-Friendly Solutions in Movable Scaffolding Systems Market.
The persistent scarcity of skilled labor in construction is driving manufacturers to innovate within the movable scaffolding segment by compelling the industry to create more automated, efficient, and user-friendly systems that reduce reliance on extensive manual labor.
The exploration and implementation of recyclable materials, energy-efficient designs, and durable systems that minimize waste generation to promote sustainability is fueling the demand.
Together, these drivers of labor shortage and sustainability are catalyzing innovation and transformation within the Movable Scaffolding System Market.
Market Opportunity- Influence of Rising Infrastructure Development and Versatility in the Movable Scaffolding System Market.
The surge in global infrastructure projects, including bridges, highways, buildings, and other construction endeavors, is propelling the need for advanced and adaptable scaffolding systems.
Manufacturers aim to provide versatile solutions capable of accommodating diverse project requirements. Additionally, the demand for versatility in scaffolding systems is escalating due to the varying needs of construction projects.
Further, manufacturers are offering customizable and adaptable solutions that cater to specific project demands, emphasizing the necessity for flexible designs and functionalities, thereby fueling the demand.
Market Share Analysis- Underslung MSS will register the fastest growth.
The Movable Scaffolding System Market is analyzed across Overhead MSS & Underslung MSS. Underslung MSS is poised to register the fastest growth. These systems are characterized by their adaptability and versatility, particularly in the construction of bridges, viaducts, and elevated structures. What distinguishes underslung MSS is their ability to offer a flexible solution for constructing various types of bridges, accommodating different spans, shapes, and structures. They are designed to support the construction process efficiently by enabling workers to build overhead structures while being suspended from the system, providing a safe and controlled environment for construction tasks at height. Underslung MSS typically consists of a gantry or support structure that moves horizontally along the bridge's length, allowing for the gradual construction of the structure section by section. This method offers precision in the construction process, ensuring uniformity and accuracy in building bridge segments.
Market Share Analysis- Roadway held a significant market share in 2023.
The Movable Scaffolding System Market is analyzed across various applications including Roadway, Railway & Others. Of these, Roadway held a significant market share in 2023. Roadway projects often require advanced and adaptable scaffolding solutions to facilitate the construction of bridges, flyovers, and elevated roadways, where safety, efficiency, and precision is paramount. Movable scaffolding systems play a crucial role in roadway construction by providing a flexible and safe working platform for workers to erect, maintain, and repair various roadway structures. These systems allow for systematic construction, segment by segment, enabling workers to progress gradually while maintaining accuracy and uniformity in the construction process. They offer a stable support structure that moves horizontally along the roadway or bridge, facilitating the construction of different sections with ease. Whether it's a straight bridge, curved structure, or an inclined roadway, these systems can be adjusted to suit the specific requirements of diverse roadway projects.
Movable Scaffolding System Market Segmentation
By Type
- Overhead MSS
- Underslung MSS
By Application
By Region
- North America (United States, Canada, Mexico)
- Europe (Germany, France, United Kingdom, Spain, Italy, Others)
- Asia Pacific (China, India, Japan, South Korea, Australia, Others)
- Latin America (Brazil, Argentina, Others)
- Middle East and Africa (Saudi Arabia, UAE, Kuwait, Other Middle East, South Africa, Nigeria, Other Africa)
Movable Scaffolding System Market Companies
- PERI GmbH (Germany)
- Altrad Group (France)
- Layher GmbH & Co. KG (Germany)
- ULMA Construction (Spain)
- Waco International (South Africa)
- MJ-Gerüst GmbH (Germany)
- RMD Kwikform (United Kingdom)
- Hunnebeck Group (Germany)
- Hünnebeck Formwork Systems (Germany)
- Entrepose Echafaudages (France)
- Instant Upright (Ireland)
- Safway Group (United States)
*List not exhaustive
Movable Scaffolding System Market Outlook 2023
1 Market Overview
1.1 Introduction to the Movable Scaffolding System Market
1.2 Scope of the Study
1.3 Research Objective
1.3.1 Key Market Scope and Segments
1.3.2 Players Covered
1.3.3 Years Considered
2 Executive Summary
2.1 2023 Movable Scaffolding System Industry- Market Statistics
3 Market Dynamics
3.1 Market Drivers
3.2 Market Challenges
3.3 Market Opportunities
3.4 Market Trends
4 Market Factor Analysis
4.1 Porter’s Five Forces
4.2 Market Entropy
4.2.1 Global Movable Scaffolding System Market Companies with Area Served
4.2.2 Products Offerings Global Movable Scaffolding System Market
5 COVID-19 Impact Analysis and Outlook Scenarios
5.1.1 Covid-19 Impact Analysis
5.1.2 post-COVID-19 Scenario- Low Growth Case
5.1.3 post-COVID-19 Scenario- Reference Growth Case
5.1.4 post-COVID-19 Scenario- Low Growth Case
6 Global Movable Scaffolding System Market Trends
6.1 Global Movable Scaffolding System Revenue (USD Million) and CAGR (%) by Type (2018-2030)
6.2 Global Movable Scaffolding System Revenue (USD Million) and CAGR (%) by Applications (2018-2030)
6.3 Global Movable Scaffolding System Revenue (USD Million) and CAGR (%) by regions (2018-2030)
7 Global Movable Scaffolding System Market Revenue (USD Million) by Type, and Applications (2018-2022)
7.1 Global Movable Scaffolding System Revenue (USD Million) by Type (2018-2022)
7.1.1 Global Movable Scaffolding System Revenue (USD Million), Market Share (%) by Type (2018-2022)
7.2 Global Movable Scaffolding System Revenue (USD Million) by Applications (2018-2022)
7.2.1 Global Movable Scaffolding System Revenue (USD Million), Market Share (%) by Applications (2018-2022)
8 Global Movable Scaffolding System Development Regional Status and Outlook
8.1 Global Movable Scaffolding System Revenue (USD Million) By Regions (2018-2022)
8.2 North America Movable Scaffolding System Revenue (USD Million) by Type, and Application (2018-2022)
8.2.1 North America Movable Scaffolding System Revenue (USD Million) by Country (2018-2022)
8.2.2 North America Movable Scaffolding System Revenue (USD Million) by Type (2018-2022)
8.2.3 North America Movable Scaffolding System Revenue (USD Million) by Applications (2018-2022)
8.3 Europe Movable Scaffolding System Revenue (USD Million), by Type, and Applications (USD Million) (2018-2022)
8.3.1 Europe Movable Scaffolding System Revenue (USD Million), by Country (2018-2022)
8.3.2 Europe Movable Scaffolding System Revenue (USD Million) by Type (2018-2022)
8.3.3 Europe Movable Scaffolding System Revenue (USD Million) by Applications (2018-2022)
8.4 Asia Pacific Movable Scaffolding System Revenue (USD Million), and Revenue (USD Million) by Type, and Applications (2018-2022)
8.4.1 Asia Pacific Movable Scaffolding System Revenue (USD Million) by Country (2018-2022)
8.4.2 Asia Pacific Movable Scaffolding System Revenue (USD Million) by Type (2018-2022)
8.4.3 Asia Pacific Movable Scaffolding System Revenue (USD Million) by Applications (2018-2022)
8.5 South America Movable Scaffolding System Revenue (USD Million), by Type, and Applications (2018-2022)
8.5.1 South America Movable Scaffolding System Revenue (USD Million), by Country (2018-2022)
8.5.2 South America Movable Scaffolding System Revenue (USD Million) by Type (2018-2022)
8.5.3 South America Movable Scaffolding System Revenue (USD Million) by Applications (2018-2022)
8.6 Middle East and Africa Movable Scaffolding System Revenue (USD Million), by Type, Technology, Application, Thickness (2018-2022)
8.6.1 Middle East and Africa Movable Scaffolding System Revenue (USD Million) by Country (2018-2022)
8.6.2 Middle East and Africa Movable Scaffolding System Revenue (USD Million) by Type (2018-2022)
8.6.3 Middle East and Africa Movable Scaffolding System Revenue (USD Million) by Applications (2018-2022)
9 Company Profiles
10 Global Movable Scaffolding System Market Revenue (USD Million), by Type, and Applications (2023-2030)
10.1 Global Movable Scaffolding System Revenue (USD Million) and Market Share (%) by Type (2023-2030)
10.1.1 Global Movable Scaffolding System Revenue (USD Million), and Market Share (%) by Type (2023-2030)
10.2 Global Movable Scaffolding System Revenue (USD Million) and Market Share (%) by Applications (2023-2030)
10.2.1 Global Movable Scaffolding System Revenue (USD Million), and Market Share (%) by Applications (2023-2030)
11 Global Movable Scaffolding System Development Regional Status and Outlook Forecast
11.1 Global Movable Scaffolding System Revenue (USD Million) By Regions (2023-2030)
11.2 North America Movable Scaffolding System Revenue (USD Million) by Type, and Applications (2023-2030)
11.2.1 North America Movable Scaffolding System Revenue (USD) Million by Country (2023-2030)
11.2.2 North America Movable Scaffolding System Revenue (USD Million), by Type (2023-2030)
11.2.3 North America Movable Scaffolding System Revenue (USD Million), Market Share (%) by Applications (2023-2030)
11.3 Europe Movable Scaffolding System Revenue (USD Million), by Type, and Applications (2023-2030)
11.3.1 Europe Movable Scaffolding System Revenue (USD Million), by Country (2023-2030)
11.3.2 Europe Movable Scaffolding System Revenue (USD Million), by Type (2023-2030)
11.3.3 Europe Movable Scaffolding System Revenue (USD Million), by Applications (2023-2030)
11.4 Asia Pacific Movable Scaffolding System Revenue (USD Million) by Type, and Applications (2023-2030)
11.4.1 Asia Pacific Movable Scaffolding System Revenue (USD Million), by Country (2023-2030)
11.4.2 Asia Pacific Movable Scaffolding System Revenue (USD Million), by Type (2023-2030)
11.4.3 Asia Pacific Movable Scaffolding System Revenue (USD Million), by Applications (2023-2030)
11.5 South America Movable Scaffolding System Revenue (USD Million), by Type, and Applications (2023-2030)
11.5.1 South America Movable Scaffolding System Revenue (USD Million), by Country (2023-2030)
11.5.2 South America Movable Scaffolding System Revenue (USD Million), by Type (2023-2030)
11.5.3 South America Movable Scaffolding System Revenue (USD Million), by Applications (2023-2030)
11.6 Middle East and Africa Movable Scaffolding System Revenue (USD Million), by Type, and Applications (2023-2030)
11.6.1 Middle East and Africa Movable Scaffolding System Revenue (USD Million), by region (2023-2030)
11.6.2 Middle East and Africa Movable Scaffolding System Revenue (USD Million), by Type (2023-2030)
11.6.3 Middle East and Africa Movable Scaffolding System Revenue (USD Million), by Applications (2023-2030)
12 Methodology and Data Sources
12.1 Methodology/Research Approach
12.1.1 Research Programs/Design
12.1.2 Market Size Estimation
12.1.3 Market Breakdown and Data Triangulation
12.2 Data Sources
12.2.1 Secondary Sources
12.2.2 Primary Sources
12.3 Disclaimer
List of Tables
Table 1 Market Segmentation Analysis
Table 2 Global Movable Scaffolding System Market Companies with Areas Served
Table 3 Products Offerings Global Movable Scaffolding System Market
Table 4 Low Growth Scenario Forecasts
Table 5 Reference Case Growth Scenario
Table 6 High Growth Case Scenario
Table 7 Global Movable Scaffolding System Revenue (USD Million) And CAGR (%) By Type (2018-2030)
Table 8 Global Movable Scaffolding System Revenue (USD Million) And CAGR (%) By Applications (2018-2030)
Table 9 Global Movable Scaffolding System Revenue (USD Million) And CAGR (%) By Regions (2018-2030)
Table 10 Global Movable Scaffolding System Revenue (USD Million) By Type (2018-2022)
Table 11 Global Movable Scaffolding System Revenue Market Share (%) By Type (2018-2022)
Table 12 Global Movable Scaffolding System Revenue (USD Million) By Applications (2018-2022)
Table 13 Global Movable Scaffolding System Revenue Market Share (%) By Applications (2018-2022)
Table 14 Global Movable Scaffolding System Market Revenue (USD Million) By Regions (2018-2022)
Table 15 Global Movable Scaffolding System Market Share (%) By Regions (2018-2022)
Table 16 North America Movable Scaffolding System Revenue (USD Million) By Country (2018-2022)
Table 17 North America Movable Scaffolding System Revenue (USD Million) By Type (2018-2022)
Table 18 North America Movable Scaffolding System Revenue (USD Million) By Applications (2018-2022)
Table 19 Europe Movable Scaffolding System Revenue (USD Million) By Country (2018-2022)
Table 20 Europe Movable Scaffolding System Revenue (USD Million) By Type (2018-2022)
Table 21 Europe Movable Scaffolding System Revenue (USD Million) By Applications (2018-2022)
Table 22 Asia Pacific Movable Scaffolding System Revenue (USD Million) By Country (2018-2022)
Table 23 Asia Pacific Movable Scaffolding System Revenue (USD Million) By Type (2018-2022)
Table 24 Asia Pacific Movable Scaffolding System Revenue (USD Million) By Applications (2018-2022)
Table 25 South America Movable Scaffolding System Revenue (USD Million) By Country (2018-2022)
Table 26 South America Movable Scaffolding System Revenue (USD Million) By Type (2018-2022)
Table 27 South America Movable Scaffolding System Revenue (USD Million) By Applications (2018-2022)
Table 28 Middle East and Africa Movable Scaffolding System Revenue (USD Million) By Region (2018-2022)
Table 29 Middle East and Africa Movable Scaffolding System Revenue (USD Million) By Type (2018-2022)
Table 30 Middle East and Africa Movable Scaffolding System Revenue (USD Million) By Applications (2018-2022)
Table 31 Financial Analysis
Table 32 Global Movable Scaffolding System Revenue (USD Million) By Type (2023-2030)
Table 33 Global Movable Scaffolding System Revenue Market Share (%) By Type (2023-2030)
Table 34 Global Movable Scaffolding System Revenue (USD Million) By Applications (2023-2030)
Table 35 Global Movable Scaffolding System Revenue Market Share (%) By Applications (2023-2030)
Table 36 Global Movable Scaffolding System Market Revenue (USD Million), And Revenue (USD Million) By Regions (2023-2030)
Table 37 North America Movable Scaffolding System Revenue (USD)By Country (2023-2030)
Table 38 North America Movable Scaffolding System Revenue (USD Million) By Type (2023-2030)
Table 39 North America Movable Scaffolding System Revenue (USD Million) By Applications (2023-2030)
Table 40 Europe Movable Scaffolding System Revenue (USD Million) By Country (2023-2030)
Table 41 Europe Movable Scaffolding System Revenue (USD Million) By Type (2023-2030)
Table 42 Europe Movable Scaffolding System Revenue (USD Million) By Applications (2023-2030)
Table 43 Asia Pacific Movable Scaffolding System Revenue (USD Million) By Country (2023-2030)
Table 44 Asia Pacific Movable Scaffolding System Revenue (USD Million) By Type (2023-2030)
Table 45 Asia Pacific Movable Scaffolding System Revenue (USD Million) By Applications (2023-2030)
Table 46 South America Movable Scaffolding System Revenue (USD Million) By Country (2023-2030)
Table 47 South America Movable Scaffolding System Revenue (USD Million) By Type (2023-2030)
Table 48 South America Movable Scaffolding System Revenue (USD Million) By Applications (2023-2030)
Table 49 Middle East and Africa Movable Scaffolding System Revenue (USD Million) By Region (2023-2030)
Table 50 Middle East and Africa Movable Scaffolding System Revenue (USD Million) By Region (2023-2030)
Table 51 Middle East and Africa Movable Scaffolding System Revenue (USD Million) By Type (2023-2030)
Table 52 Middle East and Africa Movable Scaffolding System Revenue (USD Million) By Applications (2023-2030)
Table 53 Research Programs/Design for This Report
Table 54 Key Data Information from Secondary Sources
Table 55 Key Data Information from Primary Sources
List of Figures
Figure 1 Market Scope
Figure 2 Porter’s Five Forces
Figure 3 Global Movable Scaffolding System Revenue (USD Million) By Type (2018-2022)
Figure 4 Global Movable Scaffolding System Revenue Market Share (%) By Type (2022)
Figure 5 Global Movable Scaffolding System Revenue (USD Million) By Applications (2018-2022)
Figure 6 Global Movable Scaffolding System Revenue Market Share (%) By Applications (2022)
Figure 7 Global Movable Scaffolding System Market Revenue (USD Million) By Regions (2018-2022)
Figure 8 Global Movable Scaffolding System Market Share (%) By Regions (2022)
Figure 9 North America Movable Scaffolding System Revenue (USD Million) By Country (2018-2022)
Figure 10 North America Movable Scaffolding System Revenue (USD Million) By Type (2018-2022)
Figure 11 North America Movable Scaffolding System Revenue (USD Million) By Applications (2018-2022)
Figure 12 Europe Movable Scaffolding System Revenue (USD Million) By Country (2018-2022)
Figure 13 Europe Movable Scaffolding System Revenue (USD Million) By Type (2018-2022)
Figure 14 Europe Movable Scaffolding System Revenue (USD Million) By Applications (2018-2022)
Figure 15 Asia Pacific Movable Scaffolding System Revenue (USD Million) By Country (2018-2022)
Figure 16 Asia Pacific Movable Scaffolding System Revenue (USD Million) By Type (2018-2022)
Figure 17 Asia Pacific Movable Scaffolding System Revenue (USD Million) By Applications (2018-2022)
Figure 18 South America Movable Scaffolding System Revenue (USD Million) By Country (2018-2022)
Figure 19 South America Movable Scaffolding System Revenue (USD Million) By Type (2018-2022)
Figure 20 South America Movable Scaffolding System Revenue (USD Million) By Applications (2018-2022)
Figure 21 Middle East and Africa Movable Scaffolding System Revenue (USD Million) By Region (2018-2022)
Figure 22 Middle East and Africa Movable Scaffolding System Revenue (USD Million) By Type (2018-2022)
Figure 23 Middle East and Africa Movable Scaffolding System Revenue (USD Million) By Applications (2018-2022)
Figure 24 Global Movable Scaffolding System Revenue (USD Million) By Type (2023-2030)
Figure 25 Global Movable Scaffolding System Revenue Market Share (%) By Type (2030)
Figure 26 Global Movable Scaffolding System Revenue (USD Million) By Applications (2023-2030)
Figure 27 Global Movable Scaffolding System Revenue Market Share (%) By Applications (2030)
Figure 28 Global Movable Scaffolding System Market Revenue (USD Million) By Regions (2023-2030)
Figure 29 North America Movable Scaffolding System Revenue (USD Million) By Country (2023-2030)
Figure 30 North America Movable Scaffolding System Revenue (USD Million) By Type (2023-2030)
Figure 31 North America Movable Scaffolding System Revenue (USD Million) By Applications (2023-2030)
Figure 32 Europe Movable Scaffolding System Revenue (USD Million) By Country (2023-2030)
Figure 33 Europe Movable Scaffolding System Revenue (USD Million) By Type (2023-2030)
Figure 34 Europe Movable Scaffolding System Revenue (USD Million) By Applications (2023-2030)
Figure 35 Asia Pacific Movable Scaffolding System Revenue (USD Million) By Country (2023-2030)
Figure 36 Asia Pacific Movable Scaffolding System Revenue (USD Million) By Type (2023-2030)
Figure 37 Asia Pacific Movable Scaffolding System Revenue (USD Million) By Applications (2023-2030)
Figure 38 South America Movable Scaffolding System Revenue (USD Million) By Country (2023-2030)
Figure 39 South America Movable Scaffolding System Revenue (USD Million) By Type (2023-2030)
Figure 40 South America Movable Scaffolding System Revenue (USD Million) By Applications (2023-2030)
Figure 41 Middle East and Africa Movable Scaffolding System Revenue (USD Million) By Region (2023-2030)
Figure 42 Middle East and Africa Movable Scaffolding System Revenue (USD Million) By Region (2023-2030)
Figure 43 Middle East and Africa Movable Scaffolding System Revenue (USD Million) By Type (2023-2030)
Figure 44 Middle East and Africa Movable Scaffolding System Revenue (USD Million) By Applications (2023-2030)
Figure 45 Bottom-Up and Top-Down Approaches for This Report
Figure 46 Data Triangulation
