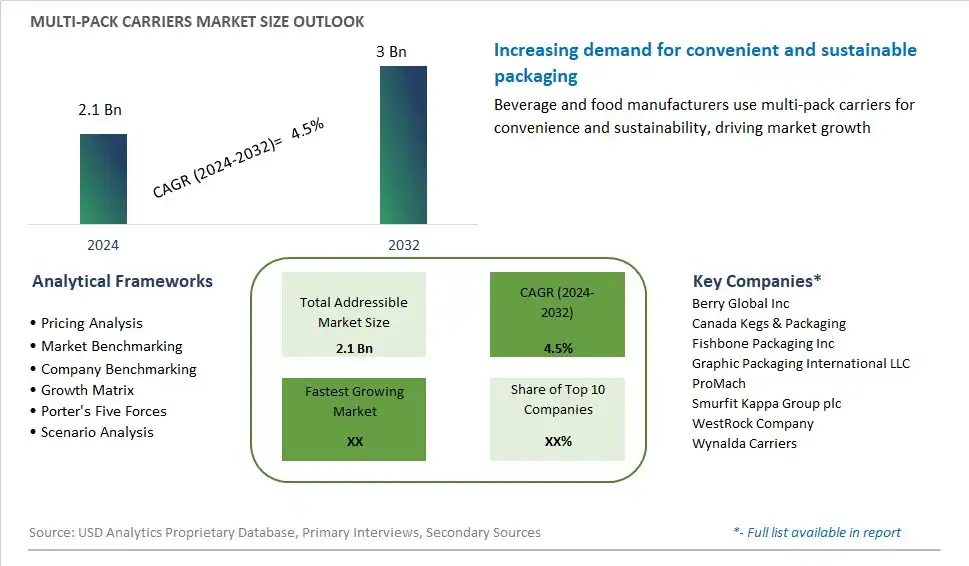
Global Multi-Pack Carriers Market Size is valued at $2.1 Billion in 2024 and is forecast to register a growth rate (CAGR) of 4.5% to reach $3 Billion by 2032.
The global Multi-Pack Carriers Market Comprehensive Study analyzes and forecasts the market size across 6 regions and 24 countries for diverse segments -By End-User (Alcoholic Beverages, Non-Alcoholic Beverages), By Product (Baskets, Trays, Others), By Material (Paper & Paperboard, Plastic, )
An Introduction to Multi-Pack Carriers Market
The Multi-Pack Carriers Market focuses on the production and sale of packaging solutions designed to carry multiple units of products, such as beverage cans and bottles. These carriers are made from materials like plastic, paperboard, and biodegradable materials. The market is driven by increasing demand for convenient and sustainable packaging, the growth of the beverage industry, and rising consumer preference for eco-friendly products. Additionally, innovations in packaging design and materials contribute to market expansion.
Multi Pack Carriers Competitive Landscape
The market report analyses the leading companies in the industry including Berry Global Inc, Canada Kegs & Packaging, Fishbone Packaging Inc, Graphic Packaging International LLC, ProMach, Smurfit Kappa Group plc, WestRock Company, Wynalda Carriers, and Others.
Multi Pack Carriers Market Dynamics
Market Trend: Sustainability and Eco-Friendly Packaging
The most prominent trend in the Multi-Pack Carriers Market is the increasing emphasis on sustainability and eco-friendly packaging. As environmental concerns rise, consumers and businesses are seeking packaging solutions that reduce plastic waste and minimize environmental impact. Multi-pack carriers made from recyclable, biodegradable, or compostable materials are gaining popularity. This trend is driven by the demand for sustainable packaging options that align with eco-conscious values. Companies are investing in innovative materials and designs to create sustainable multi-pack carriers that meet consumer expectations
Market Driver: Growth of the Beverage Industry
The growth of the beverage industry is a major driver of the Multi-Pack Carriers Market. As the consumption of beverages such as beer, soft drinks, and water increases, there is a growing need for efficient and convenient packaging solutions. Multi-pack carriers provide a practical way to bundle and transport multiple beverage containers, making them essential for the beverage industry. The expanding beverage market, driven by consumer demand and product innovation, is boosting the demand for multi-pack carriers
Market Opportunity: Expansion into New Markets
A significant opportunity in the Multi-Pack Carriers Market lies in the expansion into new markets. As the demand for multi-pack carriers grows, there is potential for companies to explore emerging markets in regions such as Asia-Pacific, Latin America, and Africa. These regions offer opportunities for growth due to increasing disposable incomes, urbanization, and changing consumer preferences. By targeting these emerging markets and developing strategies to increase market penetration, companies can expand their customer base and drive growth
Multi-Pack Carriers Market Share Analysis: End-User (Alcoholic Beverages, Non-Alcoholic Beverages)
The non-alcoholic beverages segment is expected to be the fastest-growing in the Multi-Pack Carriers Market by end-user to 2032. The demand for multi-pack carriers in the non-alcoholic beverages industry is driven by the increasing consumption of soft drinks, water, juices, and other non-alcoholic beverages. Multi-pack carriers offer convenience, ease of transport, and attractive packaging solutions for consumers. Additionally, the rising trend of health and wellness and the growing preference for functional and fortified beverages contribute to the segment's rapid growth. The expansion of product offerings and the increasing availability of multi-pack carriers in various retail channels support the growth of the non-alcoholic beverages segment.
Multi-Pack Carriers Market Share Analysis: Product (Baskets, Trays, Others)
The trays segment is projected to be the fastest-growing in the Multi-Pack Carriers Market by product to 2032. Trays offer several advantages, including stability, ease of handling, and efficient use of space, making them a preferred choice for packaging and transporting multiple beverage containers. The demand for trays is driven by the increasing focus on sustainable and recyclable packaging solutions. Additionally, trays provide better protection for beverages during transport and storage, reducing the risk of damage. The expanding use of trays in various retail channels, including supermarkets, convenience stores, and online platforms, further supports the segment's rapid growth.
Multi-Pack Carriers Market Share Analysis: Material (Paper & Paperboard, Plastic)
The paper & paperboard segment is anticipated to be the fastest-growing in the Multi-Pack Carriers Market by material to 2032. The demand for paper & paperboard multi-pack carriers is driven by the increasing focus on sustainability and the growing consumer preference for environmentally friendly packaging solutions. Paper & paperboard carriers are biodegradable, recyclable, and offer a lower environmental impact compared to plastic. Additionally, advancements in packaging technologies and the development of high-quality, durable paper & paperboard materials contribute to the segment's rapid growth. The expansion of the beverage industry and the increasing availability of paper & paperboard multi-pack carriers in various retail channels support the growth of this segment.
Multi Pack Carriers Market Segmentation
By End-User
Alcoholic Beverages
Non-Alcoholic Beverages
By Product
Baskets
Trays
Others
By Material
Paper & Paperboard
- Coated Unbleached Kraft Paperboard
- Bleached Kraft Paperboard
Plastic
- Polyethylene (PE)
- Polypropylene (PP)
- Others
Countries Analyzed
North America (US, Canada, Mexico)
Europe (Germany, UK, France, Spain, Italy, Russia, Rest of Europe)
Asia Pacific (China, India, Japan, South Korea, Australia, South East Asia, Rest of Asia)
South America (Brazil, Argentina, Rest of South America)
Middle East and Africa (Saudi Arabia, UAE, Rest of Middle East, South Africa, Egypt, Rest of Africa)
Multi Pack Carriers Companies Profiled in the Study
Berry Global Inc
Canada Kegs & Packaging
Fishbone Packaging Inc
Graphic Packaging International LLC
ProMach
Smurfit Kappa Group plc
WestRock Company
Wynalda Carriers
*- List Not Exhaustive
Chapter 1. TABLE OF CONTENTS
Chapter 2. Introduction to Multi Pack Carriers Market
2.1. Market Overview
2.2. Key Statistics and Report Highlights
2.3. Scope of the Comprehensive Study
2.3.1. Market Definition
2.3.2 Countries and Regions Covered
2.3.3 Research Objective
2.3.4 Units, Currency, and Conversions
2.3.5 Industry Value Chain
2.4. Key Market Segments
2.5. Key Companies
2.6. Study Period
Chapter 3. Strategic Analysis Review
3.1. Multi Pack Carriers Pricing Analysis and Forecast
3.2. Porter’s Five Forces
3.3. Market Ecosystem
3.4. SWOT Analysis
3.5. Regulatory Scenario
3.3. Effects of Inflation, Russia-Ukraine War, moderating economic growth, and other macroeconomic factors
Chapter 4. Competitive Landscape
4.1. Market Share Analysis
4.1.1. Global Multi Pack Carriers Market Share by Company, 2023
4.1.2. Product Offerings of Leading Multi Pack Carriers Companies
4.2. Market Entropy
4.2.1. New Product Launches in the Industry
4.2.2. Mergers, Acquisitions, Joint ventures, and Partnerships
4.3. Key Strategies and Best Practices
Chapter 5. Global Market Projections: Best, Reference, and Low Case Scenarios
5.1. Growth Analysis- Case Scenario Definitions
5.2. Low Growth Case Scenario Forecasts
5.3. Reference Growth Case Scenario Forecasts
5.4. High Growth Case Scenario Forecasts
Chapter 6. Market Dynamics
6.1. Multi Pack Carriers Market Drivers
6.2. Multi Pack Carriers Market Challenges
6.6. Multi Pack Carriers Market Opportunities
6.4. Multi Pack Carriers Market Trends
Chapter 7. Global Multi Pack Carriers Market Outlook Trends
7.1. Global Multi Pack Carriers Revenue (USD Million) and CAGR (%) by Type (2021-2032)
7.2. Global Multi Pack Carriers Revenue (USD Million) and CAGR (%) by Application (2021-2032)
7.3. Global Multi Pack Carriers Revenue (USD Million) and CAGR (%) by Product (2021-2032)
By End-User
Alcoholic Beverages
Non-Alcoholic Beverages
By Product
Baskets
Trays
Others
By Material
Paper & Paperboard
- Coated Unbleached Kraft Paperboard
- Bleached Kraft Paperboard
Plastic
- Polyethylene (PE)
- Polypropylene (PP)
- Others
Chapter 8. Global Multi Pack Carriers Regional Analysis and Outlook
8.1. Global Multi Pack Carriers Revenue (USD Million) By Regions (2021- 2032)
8.2. North America Multi Pack Carriers Revenue (USD Million) by Country (2021-2032)
8.2.1. United States Multi Pack Carriers Regional Analysis and Outlook
8.2.2. Canada Multi Pack Carriers Regional Analysis and Outlook
8.2.3. Mexico Multi Pack Carriers Regional Analysis and Outlook
8.3. Europe Multi Pack Carriers Revenue (USD Million), by Country (2021-2032)
8.3.1. Germany Multi Pack Carriers Regional Analysis and Outlook
8.3.2. France Multi Pack Carriers Regional Analysis and Outlook
8.3.3. United Kingdom Multi Pack Carriers Regional Analysis and Outlook
8.3.4. Spain Multi Pack Carriers Regional Analysis and Outlook
8.3.5. Italy Multi Pack Carriers Regional Analysis and Outlook
8.3.6. Russia Multi Pack Carriers Regional Analysis and Outlook
8.3.7. Rest of Europe Multi Pack Carriers Regional Analysis and Outlook
8.4. Asia Pacific Multi Pack Carriers Revenue (USD Million) by Country (2021-2032)
8.4.1. China Multi Pack Carriers Regional Analysis and Outlook
8.4.2. Japan Multi Pack Carriers Regional Analysis and Outlook
8.4.3. India Multi Pack Carriers Regional Analysis and Outlook
8.4.4. South Korea Multi Pack Carriers Regional Analysis and Outlook
8.4.5. Australia Multi Pack Carriers Regional Analysis and Outlook
8.4.6. South East Asia Multi Pack Carriers Regional Analysis and Outlook
8.4.7. Rest of Asia Pacific Multi Pack Carriers Regional Analysis and Outlook
8.5. South America Multi Pack Carriers Revenue (USD Million), by Country (2021-2032)
8.5.1. Brazil Multi Pack Carriers Regional Analysis and Outlook
8.5.2. Argentina Multi Pack Carriers Regional Analysis and Outlook
8.5.3. Rest of South America Multi Pack Carriers Regional Analysis and Outlook
8.6. Middle East and Africa Multi Pack Carriers Revenue (USD Million) by Country (2021-2032)
8.6.1. Middle East Multi Pack Carriers Regional Analysis and Outlook
8.6.2. Africa Multi Pack Carriers Regional Analysis and Outlook
Chapter 9. North America Multi Pack Carriers Analysis and Outlook
9.1. North America Multi Pack Carriers Revenue (USD Million) by Segments (2021-2032)
9.1.1. North America Multi Pack Carriers Revenue (USD Million) by Type (2021-2032)
9.1.2. North America Multi Pack Carriers Revenue (USD Million) by Application (2021-2032)
9.1.3. North America Multi Pack Carriers Revenue (USD Million) by Product (2021-2032)
By End-User
Alcoholic Beverages
Non-Alcoholic Beverages
By Product
Baskets
Trays
Others
By Material
Paper & Paperboard
- Coated Unbleached Kraft Paperboard
- Bleached Kraft Paperboard
Plastic
- Polyethylene (PE)
- Polypropylene (PP)
- Others
Chapter 10. Europe Multi Pack Carriers Analysis and Outlook
10.1. Europe Multi Pack Carriers Revenue (USD Million), by Segments (USD Million) (2021-2032)
10.1.1. Europe Multi Pack Carriers Revenue (USD Million) by Type (2021-2032)
10.1.2. Europe Multi Pack Carriers Revenue (USD Million) by Application (2021-2032)
10.1.3. Europe Multi Pack Carriers Revenue (USD Million) by Product (2021-2032)
By End-User
Alcoholic Beverages
Non-Alcoholic Beverages
By Product
Baskets
Trays
Others
By Material
Paper & Paperboard
- Coated Unbleached Kraft Paperboard
- Bleached Kraft Paperboard
Plastic
- Polyethylene (PE)
- Polypropylene (PP)
- Others
Chapter 11. Asia Pacific Multi Pack Carriers Analysis and Outlook
11.1. Asia Pacific Multi Pack Carriers Revenue (USD Million), and Revenue (USD Million) by Segments (2021-2032)
11.1.1. Asia Pacific Multi Pack Carriers Revenue (USD Million) by Type (2021-2032)
11.1.2. Asia Pacific Multi Pack Carriers Revenue (USD Million) by Application (2021-2032)
11.1.3. Asia Pacific Multi Pack Carriers Revenue (USD Million) by Product (2021-2032)
By End-User
Alcoholic Beverages
Non-Alcoholic Beverages
By Product
Baskets
Trays
Others
By Material
Paper & Paperboard
- Coated Unbleached Kraft Paperboard
- Bleached Kraft Paperboard
Plastic
- Polyethylene (PE)
- Polypropylene (PP)
- Others
Chapter 12. South America Multi Pack Carriers Analysis and Outlook
12.1. South America Multi Pack Carriers Revenue (USD Million), by Segments (2021-2032)
12.1.1. South America Multi Pack Carriers Revenue (USD Million) by Type (2021-2032)
12.1.2. South America Multi Pack Carriers Revenue (USD Million) by Application (2021-2032)
12.1.3. South America Multi Pack Carriers Revenue (USD Million) by Product (2021-2032)
By End-User
Alcoholic Beverages
Non-Alcoholic Beverages
By Product
Baskets
Trays
Others
By Material
Paper & Paperboard
- Coated Unbleached Kraft Paperboard
- Bleached Kraft Paperboard
Plastic
- Polyethylene (PE)
- Polypropylene (PP)
- Others
Chapter 13. Middle East and Africa Multi Pack Carriers Analysis and Outlook
13.1. Middle East and Africa Multi Pack Carriers Revenue (USD Million), by Segments (2021-2032)
13.1.1. Middle East and Africa Multi Pack Carriers Revenue (USD Million) by Type (2021-2032)
13.1.2. Middle East and Africa Multi Pack Carriers Revenue (USD Million) by Application (2021-2032)
13.1.3. Middle East and Africa Multi Pack Carriers Revenue (USD Million) by Product (2021-2032)
By End-User
Alcoholic Beverages
Non-Alcoholic Beverages
By Product
Baskets
Trays
Others
By Material
Paper & Paperboard
- Coated Unbleached Kraft Paperboard
- Bleached Kraft Paperboard
Plastic
- Polyethylene (PE)
- Polypropylene (PP)
- Others
Chapter 14. Multi Pack Carriers Company Profiles
14.1 Business Overview
14.2 Product Profiles
14.3 SWOT Profiles
14.5 Recent Developments
14.6 Financial Profile
List of Companies
Berry Global Inc
Canada Kegs & Packaging
Fishbone Packaging Inc
Graphic Packaging International LLC
ProMach
Smurfit Kappa Group plc
WestRock Company
Wynalda Carriers
15. Methodology and Data Sources
15.1 Customization Offerings
15.2 Subscription Services
15.3 Related Reports
15.4 Publisher Expertise
LIST OF TABLES
Table 1 Market Segmentation Analysis
Table 2 Global Multi Pack Carriers Market Share of Leading Companies, 2023
Table 3 Product Offerings of Leading Companies
Table 4 Low Growth Scenario Forecasts
Table 5 Reference Case Growth Scenario
Table 6 High Growth Case Scenario
Table 7 Global Multi Pack Carriers Revenue (USD Million) And CAGR (%) By Type (2021-2032)
Table 8 Global Multi Pack Carriers Revenue (USD Million) And CAGR (%) By Application (2021-2032)
Table 9 Global Multi Pack Carriers Revenue (USD Million) And CAGR (%) By Product (2021-2032)
Table 10 Global Multi Pack Carriers Market Revenue (USD Million) By Regions (2021-2032)
Table 11 Global Multi Pack Carriers Market Share (%) By Regions (2021-2032)
Table 12 North America Multi Pack Carriers Revenue (USD Million) By Country (2021-2032)
Table 13 Europe Multi Pack Carriers Revenue (USD Million) By Country (2021-2032)
Table 14 Asia Pacific Multi Pack Carriers Revenue (USD Million) By Country (2021-2032)
Table 15 South America Multi Pack Carriers Revenue (USD Million) By Country (2021-2032)
Table 16 Middle East and Africa Multi Pack Carriers Revenue (USD Million) By Region (2021-2032)
Table 17 North America Multi Pack Carriers Revenue (USD Million) By Type (2021-2032)
Table 18 North America Multi Pack Carriers Revenue (USD Million) By Application (2021-2032)
Table 19 North America Multi Pack Carriers Revenue (USD Million) By Product (2021-2032)
Table 20 Europe Multi Pack Carriers Revenue (USD Million) By Type (2021-2032)
Table 21 Europe Multi Pack Carriers Revenue (USD Million) By Application (2021-2032)
Table 22 Europe Multi Pack Carriers Revenue (USD Million) By Product (2021-2032)
Table 23 Asia Pacific Multi Pack Carriers Revenue (USD Million) By Type (2021-2032)
Table 24 Asia Pacific Multi Pack Carriers Revenue (USD Million) By Application (2021-2032)
Table 25 Asia Pacific Multi Pack Carriers Revenue (USD Million) By Product (2021-2032)
Table 26 South America Multi Pack Carriers Revenue (USD Million) By Type (2021-2032)
Table 27 South America Multi Pack Carriers Revenue (USD Million) By Application (2021-2032)
Table 28 South America Multi Pack Carriers Revenue (USD Million) By Product (2021-2032)
Table 29 Middle East and Africa Multi Pack Carriers Revenue (USD Million) By Type (2021-2032)
Table 30 Middle East and Africa Multi Pack Carriers Revenue (USD Million) By Application (2021-2032)
Table 31 Middle East and Africa Multi Pack Carriers Revenue (USD Million) By Product (2021-2032)
LIST OF FIGURES
Figure 1. Market Scope
Figure 2. Pricing Forecasts Per Unit, 2023- 2032
Figure 3. Porter’s Five Forces
Figure 4. Global Multi Pack Carriers Market Revenue (USD Million) By Regions (2021-2032)
Figure 5. Global Multi Pack Carriers Market Share (%) By Regions (2023)
Figure 6. North America Multi Pack Carriers Revenue (USD Million) By Country (2021-2032)
Figure 7. United States Multi Pack Carriers Revenue (USD Million) By Country (2021-2032)
Figure 8. Canada Multi Pack Carriers Revenue (USD Million) By Country (2021-2032)
Figure 9. Mexico Multi Pack Carriers Revenue (USD Million) By Country (2021-2032)
Figure 10. Europe Multi Pack Carriers Revenue (USD Million) By Country (2021-2032)
Figure 11. Germany Multi Pack Carriers Revenue (USD Million) By Country (2021-2032)
Figure 12. France Multi Pack Carriers Revenue (USD Million) By Country (2021-2032)
Figure 13. United Kingdom Multi Pack Carriers Revenue (USD Million) By Country (2021-2032)
Figure 14. Spain Multi Pack Carriers Revenue (USD Million) By Country (2021-2032)
Figure 15. Italy Multi Pack Carriers Revenue (USD Million) By Country (2021-2032)
Figure 16. Russia Multi Pack Carriers Revenue (USD Million) By Country (2021-2032)
Figure 17. Rest of Europe Multi Pack Carriers Revenue (USD Million) By Country (2021-2032)
Figure 11. Asia Pacific Multi Pack Carriers Revenue (USD Million) By Country (2021-2032)
Figure 12. China Multi Pack Carriers Revenue (USD Million) By Country (2021-2032)
Figure 13. Japan Multi Pack Carriers Revenue (USD Million) By Country (2021-2032)
Figure 14. India Multi Pack Carriers Revenue (USD Million) By Country (2021-2032)
Figure 15. South Korea Multi Pack Carriers Revenue (USD Million) By Country (2021-2032)
Figure 16. Australia Multi Pack Carriers Revenue (USD Million) By Country (2021-2032)
Figure 17. South East Asia Multi Pack Carriers Revenue (USD Million) By Country (2021-2032)
Figure 18. South America Multi Pack Carriers Revenue (USD Million) By Country (2021-2032)
Figure 19. Brazil Multi Pack Carriers Revenue (USD Million) By Country (2021-2032)
Figure 20. Argentina Multi Pack Carriers Revenue (USD Million) By Country (2021-2032)
Figure 21. Rest of Asia Pacific Multi Pack Carriers Revenue (USD Million) By Country (2021-2032)
Figure 22. Middle East and Africa Multi Pack Carriers Revenue (USD Million) By Region (2021-2032)
Figure 23. Saudi Arabia Multi Pack Carriers Revenue (USD Million) By Region (2021-2032)
Figure 24. The UAE Multi Pack Carriers Revenue (USD Million) By Region (2021-2032)
Figure 25. Rest of Middle East Multi Pack Carriers Revenue (USD Million) By Region (2021-2032)
Figure 26. South Africa Multi Pack Carriers Revenue (USD Million) By Region (2021-2032)
Figure 27. Africa Multi Pack Carriers Revenue (USD Million) By Region (2021-2032)
Figure 28. North America Multi Pack Carriers Revenue (USD Million) By Type (2021-2032)
Figure 29. North America Multi Pack Carriers Revenue (USD Million) By Application (2021-2032)
Figure 30. North America Multi Pack Carriers Revenue (USD Million) By Product (2021-2032)
Figure 31. Europe Multi Pack Carriers Revenue (USD Million) By Type (2021-2032)
Figure 32. Europe Multi Pack Carriers Revenue (USD Million) By Application (2021-2032)
Figure 33. Europe Multi Pack Carriers Revenue (USD Million) By Product (2021-2032)
Figure 34. Asia Pacific Multi Pack Carriers Revenue (USD Million) By Type (2021-2032)
Figure 35. Asia Pacific Multi Pack Carriers Revenue (USD Million) By Application (2021-2032)
Figure 36. Asia Pacific Multi Pack Carriers Revenue (USD Million) By Product (2021-2032)
Figure 37. South America Multi Pack Carriers Revenue (USD Million) By Type (2021-2032)
Figure 38. South America Multi Pack Carriers Revenue (USD Million) By Application (2021-2032)
Figure 39. South America Multi Pack Carriers Revenue (USD Million) By Product (2021-2032)
Figure 40. Middle East and Africa Multi Pack Carriers Revenue (USD Million) By Type (2021-2032)
Figure 41. Middle East and Africa Multi Pack Carriers Revenue (USD Million) By Application (2021-2032)
Figure 42. Middle East and Africa Multi Pack Carriers Revenue (USD Million) By Product (2021-2032)
By End-User
Alcoholic Beverages
Non-Alcoholic Beverages
By Product
Baskets
Trays
Others
By Material
Paper & Paperboard
- Coated Unbleached Kraft Paperboard
- Bleached Kraft Paperboard
Plastic
- Polyethylene (PE)
- Polypropylene (PP)
- Others
Countries Analyzed
North America (US, Canada, Mexico)
Europe (Germany, UK, France, Spain, Italy, Russia, Rest of Europe)
Asia Pacific (China, India, Japan, South Korea, Australia, South East Asia, Rest of Asia)
South America (Brazil, Argentina, Rest of South America)
Middle East and Africa (Saudi Arabia, UAE, Rest of Middle East, South Africa, Egypt, Rest of Africa)
