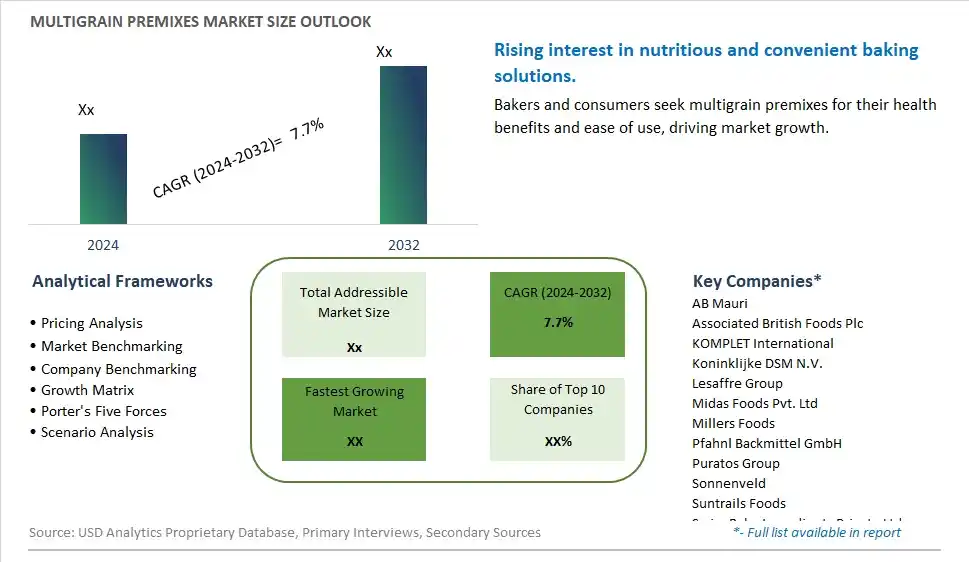
Global Multigrain Premixes Market Size is valued at $XX Million in 2024 and is forecast to register a growth rate (CAGR) of 7.7% to reach $XX Million by 2032.
The global Multigrain Premixes Market Comprehensive Study analyzes and forecasts the market size across 6 regions and 24 countries for diverse segments -By Nature (Organic, Conventional), By Source (Wheat, Sorghum, Oats, Quinoa, Rye, Barley, Maize/Corn, Pulses), By Distribution Channel (Direct Sales, Indirect Sales), By End-User (Bars and Crackers, Bread, Biscuits and Cookies, Brownies and Cakes, Sweet goods)
An Introduction to Multigrain Premixes Market
The multigrain premixes market in 2024 is expanding rapidly, driven by the demand for convenient and nutritious baking solutions. Multigrain premixes, which combine various grains such as wheat, oats, barley, and quinoa, offer the health benefits of multiple grains in one product. The market benefits from innovations in premix formulation and packaging that enhance quality and convenience. The trend towards clean label and natural ingredients is influencing product development. Increasing consumer interest in health and wellness, supported by the popularity of whole grains, is further propelling market growth.
Multigrain Premixes Competitive Landscape
The market report analyses the leading companies in the industry including AB Mauri, Associated British Foods Plc, KOMPLET International, Koninklijke DSM N.V., Lesaffre Group, Midas Foods Pvt. Ltd, Millers Foods, Pfahnl Backmittel GmbH, Puratos Group, Sonnenveld, Suntrails Foods, Swiss Bake Ingredients Private Ltd, and Others.
Multigrain Premixes Market Dynamics
Multigrain Premixes Market Trend: Increasing Demand for Healthy and Convenient Baking Solutions
The most prominent trend in the Multigrain Premixes Market is the increasing demand for healthy and convenient baking solutions. Multigrain premixes, which combine various grains and seeds, are becoming popular among consumers seeking nutritious and easy-to-use ingredients for homemade breads, muffins, and other baked goods.
Multigrain Premixes Market Driver: Health Consciousness and Dietary Preferences
A key driver in the Multigrain Premixes Market is health consciousness and changing dietary preferences. As more individuals adopt healthier eating habits and seek to incorporate more whole grains into their diet, there is a rising demand for multigrain premixes that provide enhanced nutritional benefits and cater to gluten-free, low-carb, and high-fiber diets.
Multigrain Premixes Market Opportunity: Innovation in Product Varieties and Nutritional Enhancements
One significant opportunity in the Multigrain Premixes Market lies in innovation in product varieties and nutritional enhancements. Companies can develop new multigrain premix products that offer unique grain combinations and added nutrients, such as protein, fiber, and vitamins, catering to diverse dietary needs and preferences. By offering diverse and health-focused options, manufacturers can attract a broader consumer base and drive market growth.
Multigrain Premixes Market Share Analysis- Largest Segment by Nature
The Conventional Multigrain Premixes segment is the largest in the market. This is due to the broader availability and cost-effectiveness of conventional premixes compared to organic alternatives. Conventional multigrain premixes benefit from established supply chains and lower production costs, making them more accessible to a wider range of consumers and businesses. The large-scale production and distribution of conventional premixes support its dominance in the market. Despite the growing interest in organic products, the affordability and widespread availability of conventional premixes continue to drive their leading position in the market.
Multigrain Premixes Market Share Analysis- Fastest Growing Segment by Source
The Quinoa source is poised to grow the fastest in the Multigrain Premixes Market over the next five years. This projected growth is driven by the rising health consciousness among consumers, who are increasingly seeking nutrient-dense, gluten-free options. Quinoa's high protein content, essential amino acids, and its status as a complete protein make it an attractive ingredient for health-focused multigrain premixes. Furthermore, the growing trend towards plant-based and gluten-free diets has amplified quinoa's appeal, leading to increased demand in both the health food sector and mainstream consumer products. As a result, quinoa is expected to drive the fastest growth in this market segment, supported by its versatility and nutritional benefits.
Multigrain Premixes Market Share Analysis- Largest Segment by Distribution Channel
The Indirect Sales channel is the largest segment in the Multigrain Premixes Market. This dominance is due to the extensive network of retail and distribution outlets, including supermarkets, convenience stores, and specialty shops, which facilitate widespread consumer access to multigrain premixes. Indirect sales encompass a range of intermediaries such as distributors and wholesalers that effectively broaden market reach and enhance product availability. Additionally, established relationships between manufacturers and retailers in the indirect sales channel contribute to a more efficient distribution process, supporting the segment’s size and market penetration.
Multigrain Premixes Market Share Analysis- Fastest Growing Segment by End-User
The Bars and Crackers segment is poised to grow the fastest in the Multigrain Premixes Market over the next five years. This growth is driven by the increasing consumer preference for convenient, on-the-go snacks that offer health benefits. Bars and crackers often serve as quick, nutritious snacks, and incorporating multigrain premixes into these products meets the demand for healthier options that provide sustained energy. The rising trend of health and wellness among consumers, along with the growing popularity of functional snacks, supports this segment's rapid expansion.
Multigrain Premixes Market Segmentation
By Nature
Organic
Conventional
By Source
Wheat
Sorghum
Oats
Quinoa
Rye
Barley
Maize/Corn
Pulses
By Distribution Channel
Direct Sales
Indirect Sales
By End-User
Bars and Crackers
Bread
Biscuits and Cookies
Brownies and Cakes
Sweet goods
Countries Analyzed
North America (US, Canada, Mexico)
Europe (Germany, UK, France, Spain, Italy, Russia, Rest of Europe)
Asia Pacific (China, India, Japan, South Korea, Australia, South East Asia, Rest of Asia)
South America (Brazil, Argentina, Rest of South America)
Middle East and Africa (Saudi Arabia, UAE, Rest of Middle East, South Africa, Egypt, Rest of Africa)
Multigrain Premixes Companies Profiled in the Study
AB Mauri
Associated British Foods Plc
KOMPLET International
Koninklijke DSM N.V.
Lesaffre Group
Midas Foods Pvt. Ltd
Millers Foods
Pfahnl Backmittel GmbH
Puratos Group
Sonnenveld
Suntrails Foods
Swiss Bake Ingredients Private Ltd
*- List Not Exhaustive
Chapter 1. TABLE OF CONTENTS
Chapter 2. Introduction to Multigrain Premixes Market
2.1. Market Overview
2.2. Key Statistics and Report Highlights
2.3. Scope of the Comprehensive Study
2.3.1. Market Definition
2.3.2 Countries and Regions Covered
2.3.3 Research Objective
2.3.4 Units, Currency, and Conversions
2.3.5 Industry Value Chain
2.4. Key Market Segments
2.5. Key Companies
2.6. Study Period
Chapter 3. Strategic Analysis Review
3.1. Multigrain Premixes Pricing Analysis and Forecast
3.2. Porter’s Five Forces
3.3. Market Ecosystem
3.4. SWOT Analysis
3.5. Regulatory Scenario
3.3. Effects of Inflation, Russia-Ukraine War, moderating economic growth, and other macroeconomic factors
Chapter 4. Competitive Landscape
4.1. Market Share Analysis
4.1.1. Global Multigrain Premixes Market Share by Company, 2023
4.1.2. Product Offerings of Leading Multigrain Premixes Companies
4.2. Market Entropy
4.2.1. New Product Launches in the Industry
4.2.2. Mergers, Acquisitions, Joint ventures, and Partnerships
4.3. Key Strategies and Best Practices
Chapter 5. Global Market Projections: Best, Reference, and Low Case Scenarios
5.1. Growth Analysis- Case Scenario Definitions
5.2. Low Growth Case Scenario Forecasts
5.3. Reference Growth Case Scenario Forecasts
5.4. High Growth Case Scenario Forecasts
Chapter 6. Market Dynamics
6.1. Multigrain Premixes Market Drivers
6.2. Multigrain Premixes Market Challenges
6.6. Multigrain Premixes Market Opportunities
6.4. Multigrain Premixes Market Trends
Chapter 7. Global Multigrain Premixes Market Outlook Trends
7.1. Global Multigrain Premixes Revenue (USD Million) and CAGR (%) by Type (2021-2032)
7.2. Global Multigrain Premixes Revenue (USD Million) and CAGR (%) by Application (2021-2032)
7.3. Global Multigrain Premixes Revenue (USD Million) and CAGR (%) by Product (2021-2032)
By Nature
Organic
Conventional
By Source
Wheat
Sorghum
Oats
Quinoa
Rye
Barley
Maize/Corn
Pulses
By Distribution Channel
Direct Sales
Indirect Sales
By End-User
Bars and Crackers
Bread
Biscuits and Cookies
Brownies and Cakes
Sweet goods
Chapter 8. Global Multigrain Premixes Regional Analysis and Outlook
8.1. Global Multigrain Premixes Revenue (USD Million) By Regions (2021- 2032)
8.2. North America Multigrain Premixes Revenue (USD Million) by Country (2021-2032)
8.2.1. United States Multigrain Premixes Regional Analysis and Outlook
8.2.2. Canada Multigrain Premixes Regional Analysis and Outlook
8.2.3. Mexico Multigrain Premixes Regional Analysis and Outlook
8.3. Europe Multigrain Premixes Revenue (USD Million), by Country (2021-2032)
8.3.1. Germany Multigrain Premixes Regional Analysis and Outlook
8.3.2. France Multigrain Premixes Regional Analysis and Outlook
8.3.3. United Kingdom Multigrain Premixes Regional Analysis and Outlook
8.3.4. Spain Multigrain Premixes Regional Analysis and Outlook
8.3.5. Italy Multigrain Premixes Regional Analysis and Outlook
8.3.6. Russia Multigrain Premixes Regional Analysis and Outlook
8.3.7. Rest of Europe Multigrain Premixes Regional Analysis and Outlook
8.4. Asia Pacific Multigrain Premixes Revenue (USD Million) by Country (2021-2032)
8.4.1. China Multigrain Premixes Regional Analysis and Outlook
8.4.2. Japan Multigrain Premixes Regional Analysis and Outlook
8.4.3. India Multigrain Premixes Regional Analysis and Outlook
8.4.4. South Korea Multigrain Premixes Regional Analysis and Outlook
8.4.5. Australia Multigrain Premixes Regional Analysis and Outlook
8.4.6. South East Asia Multigrain Premixes Regional Analysis and Outlook
8.4.7. Rest of Asia Pacific Multigrain Premixes Regional Analysis and Outlook
8.5. South America Multigrain Premixes Revenue (USD Million), by Country (2021-2032)
8.5.1. Brazil Multigrain Premixes Regional Analysis and Outlook
8.5.2. Argentina Multigrain Premixes Regional Analysis and Outlook
8.5.3. Rest of South America Multigrain Premixes Regional Analysis and Outlook
8.6. Middle East and Africa Multigrain Premixes Revenue (USD Million) by Country (2021-2032)
8.6.1. Middle East Multigrain Premixes Regional Analysis and Outlook
8.6.2. Africa Multigrain Premixes Regional Analysis and Outlook
Chapter 9. North America Multigrain Premixes Analysis and Outlook
9.1. North America Multigrain Premixes Revenue (USD Million) by Segments (2021-2032)
9.1.1. North America Multigrain Premixes Revenue (USD Million) by Type (2021-2032)
9.1.2. North America Multigrain Premixes Revenue (USD Million) by Application (2021-2032)
9.1.3. North America Multigrain Premixes Revenue (USD Million) by Product (2021-2032)
By Nature
Organic
Conventional
By Source
Wheat
Sorghum
Oats
Quinoa
Rye
Barley
Maize/Corn
Pulses
By Distribution Channel
Direct Sales
Indirect Sales
By End-User
Bars and Crackers
Bread
Biscuits and Cookies
Brownies and Cakes
Sweet goods
Chapter 10. Europe Multigrain Premixes Analysis and Outlook
10.1. Europe Multigrain Premixes Revenue (USD Million), by Segments (USD Million) (2021-2032)
10.1.1. Europe Multigrain Premixes Revenue (USD Million) by Type (2021-2032)
10.1.2. Europe Multigrain Premixes Revenue (USD Million) by Application (2021-2032)
10.1.3. Europe Multigrain Premixes Revenue (USD Million) by Product (2021-2032)
By Nature
Organic
Conventional
By Source
Wheat
Sorghum
Oats
Quinoa
Rye
Barley
Maize/Corn
Pulses
By Distribution Channel
Direct Sales
Indirect Sales
By End-User
Bars and Crackers
Bread
Biscuits and Cookies
Brownies and Cakes
Sweet goods
Chapter 11. Asia Pacific Multigrain Premixes Analysis and Outlook
11.1. Asia Pacific Multigrain Premixes Revenue (USD Million), and Revenue (USD Million) by Segments (2021-2032)
11.1.1. Asia Pacific Multigrain Premixes Revenue (USD Million) by Type (2021-2032)
11.1.2. Asia Pacific Multigrain Premixes Revenue (USD Million) by Application (2021-2032)
11.1.3. Asia Pacific Multigrain Premixes Revenue (USD Million) by Product (2021-2032)
By Nature
Organic
Conventional
By Source
Wheat
Sorghum
Oats
Quinoa
Rye
Barley
Maize/Corn
Pulses
By Distribution Channel
Direct Sales
Indirect Sales
By End-User
Bars and Crackers
Bread
Biscuits and Cookies
Brownies and Cakes
Sweet goods
Chapter 12. South America Multigrain Premixes Analysis and Outlook
12.1. South America Multigrain Premixes Revenue (USD Million), by Segments (2021-2032)
12.1.1. South America Multigrain Premixes Revenue (USD Million) by Type (2021-2032)
12.1.2. South America Multigrain Premixes Revenue (USD Million) by Application (2021-2032)
12.1.3. South America Multigrain Premixes Revenue (USD Million) by Product (2021-2032)
By Nature
Organic
Conventional
By Source
Wheat
Sorghum
Oats
Quinoa
Rye
Barley
Maize/Corn
Pulses
By Distribution Channel
Direct Sales
Indirect Sales
By End-User
Bars and Crackers
Bread
Biscuits and Cookies
Brownies and Cakes
Sweet goods
Chapter 13. Middle East and Africa Multigrain Premixes Analysis and Outlook
13.1. Middle East and Africa Multigrain Premixes Revenue (USD Million), by Segments (2021-2032)
13.1.1. Middle East and Africa Multigrain Premixes Revenue (USD Million) by Type (2021-2032)
13.1.2. Middle East and Africa Multigrain Premixes Revenue (USD Million) by Application (2021-2032)
13.1.3. Middle East and Africa Multigrain Premixes Revenue (USD Million) by Product (2021-2032)
By Nature
Organic
Conventional
By Source
Wheat
Sorghum
Oats
Quinoa
Rye
Barley
Maize/Corn
Pulses
By Distribution Channel
Direct Sales
Indirect Sales
By End-User
Bars and Crackers
Bread
Biscuits and Cookies
Brownies and Cakes
Sweet goods
Chapter 14. Multigrain Premixes Company Profiles
14.1 Business Overview
14.2 Product Profiles
14.3 SWOT Profiles
14.5 Recent Developments
14.6 Financial Profile
List of Companies
AB Mauri
Associated British Foods Plc
KOMPLET International
Koninklijke DSM N.V.
Lesaffre Group
Midas Foods Pvt. Ltd
Millers Foods
Pfahnl Backmittel GmbH
Puratos Group
Sonnenveld
Suntrails Foods
Swiss Bake Ingredients Private Ltd
15. Methodology and Data Sources
15.1 Customization Offerings
15.2 Subscription Services
15.3 Related Reports
15.4 Publisher Expertise
LIST OF TABLES
Table 1 Market Segmentation Analysis
Table 2 Global Multigrain Premixes Market Share of Leading Companies, 2023
Table 3 Product Offerings of Leading Companies
Table 4 Low Growth Scenario Forecasts
Table 5 Reference Case Growth Scenario
Table 6 High Growth Case Scenario
Table 7 Global Multigrain Premixes Revenue (USD Million) And CAGR (%) By Type (2021-2032)
Table 8 Global Multigrain Premixes Revenue (USD Million) And CAGR (%) By Application (2021-2032)
Table 9 Global Multigrain Premixes Revenue (USD Million) And CAGR (%) By Product (2021-2032)
Table 10 Global Multigrain Premixes Market Revenue (USD Million) By Regions (2021-2032)
Table 11 Global Multigrain Premixes Market Share (%) By Regions (2021-2032)
Table 12 North America Multigrain Premixes Revenue (USD Million) By Country (2021-2032)
Table 13 Europe Multigrain Premixes Revenue (USD Million) By Country (2021-2032)
Table 14 Asia Pacific Multigrain Premixes Revenue (USD Million) By Country (2021-2032)
Table 15 South America Multigrain Premixes Revenue (USD Million) By Country (2021-2032)
Table 16 Middle East and Africa Multigrain Premixes Revenue (USD Million) By Region (2021-2032)
Table 17 North America Multigrain Premixes Revenue (USD Million) By Type (2021-2032)
Table 18 North America Multigrain Premixes Revenue (USD Million) By Application (2021-2032)
Table 19 North America Multigrain Premixes Revenue (USD Million) By Product (2021-2032)
Table 20 Europe Multigrain Premixes Revenue (USD Million) By Type (2021-2032)
Table 21 Europe Multigrain Premixes Revenue (USD Million) By Application (2021-2032)
Table 22 Europe Multigrain Premixes Revenue (USD Million) By Product (2021-2032)
Table 23 Asia Pacific Multigrain Premixes Revenue (USD Million) By Type (2021-2032)
Table 24 Asia Pacific Multigrain Premixes Revenue (USD Million) By Application (2021-2032)
Table 25 Asia Pacific Multigrain Premixes Revenue (USD Million) By Product (2021-2032)
Table 26 South America Multigrain Premixes Revenue (USD Million) By Type (2021-2032)
Table 27 South America Multigrain Premixes Revenue (USD Million) By Application (2021-2032)
Table 28 South America Multigrain Premixes Revenue (USD Million) By Product (2021-2032)
Table 29 Middle East and Africa Multigrain Premixes Revenue (USD Million) By Type (2021-2032)
Table 30 Middle East and Africa Multigrain Premixes Revenue (USD Million) By Application (2021-2032)
Table 31 Middle East and Africa Multigrain Premixes Revenue (USD Million) By Product (2021-2032)
LIST OF FIGURES
Figure 1. Market Scope
Figure 2. Pricing Forecasts Per Unit, 2023- 2032
Figure 3. Porter’s Five Forces
Figure 4. Global Multigrain Premixes Market Revenue (USD Million) By Regions (2021-2032)
Figure 5. Global Multigrain Premixes Market Share (%) By Regions (2023)
Figure 6. North America Multigrain Premixes Revenue (USD Million) By Country (2021-2032)
Figure 7. United States Multigrain Premixes Revenue (USD Million) By Country (2021-2032)
Figure 8. Canada Multigrain Premixes Revenue (USD Million) By Country (2021-2032)
Figure 9. Mexico Multigrain Premixes Revenue (USD Million) By Country (2021-2032)
Figure 10. Europe Multigrain Premixes Revenue (USD Million) By Country (2021-2032)
Figure 11. Germany Multigrain Premixes Revenue (USD Million) By Country (2021-2032)
Figure 12. France Multigrain Premixes Revenue (USD Million) By Country (2021-2032)
Figure 13. United Kingdom Multigrain Premixes Revenue (USD Million) By Country (2021-2032)
Figure 14. Spain Multigrain Premixes Revenue (USD Million) By Country (2021-2032)
Figure 15. Italy Multigrain Premixes Revenue (USD Million) By Country (2021-2032)
Figure 16. Russia Multigrain Premixes Revenue (USD Million) By Country (2021-2032)
Figure 17. Rest of Europe Multigrain Premixes Revenue (USD Million) By Country (2021-2032)
Figure 11. Asia Pacific Multigrain Premixes Revenue (USD Million) By Country (2021-2032)
Figure 12. China Multigrain Premixes Revenue (USD Million) By Country (2021-2032)
Figure 13. Japan Multigrain Premixes Revenue (USD Million) By Country (2021-2032)
Figure 14. India Multigrain Premixes Revenue (USD Million) By Country (2021-2032)
Figure 15. South Korea Multigrain Premixes Revenue (USD Million) By Country (2021-2032)
Figure 16. Australia Multigrain Premixes Revenue (USD Million) By Country (2021-2032)
Figure 17. South East Asia Multigrain Premixes Revenue (USD Million) By Country (2021-2032)
Figure 18. South America Multigrain Premixes Revenue (USD Million) By Country (2021-2032)
Figure 19. Brazil Multigrain Premixes Revenue (USD Million) By Country (2021-2032)
Figure 20. Argentina Multigrain Premixes Revenue (USD Million) By Country (2021-2032)
Figure 21. Rest of Asia Pacific Multigrain Premixes Revenue (USD Million) By Country (2021-2032)
Figure 22. Middle East and Africa Multigrain Premixes Revenue (USD Million) By Region (2021-2032)
Figure 23. Saudi Arabia Multigrain Premixes Revenue (USD Million) By Region (2021-2032)
Figure 24. The UAE Multigrain Premixes Revenue (USD Million) By Region (2021-2032)
Figure 25. Rest of Middle East Multigrain Premixes Revenue (USD Million) By Region (2021-2032)
Figure 26. South Africa Multigrain Premixes Revenue (USD Million) By Region (2021-2032)
Figure 27. Africa Multigrain Premixes Revenue (USD Million) By Region (2021-2032)
Figure 28. North America Multigrain Premixes Revenue (USD Million) By Type (2021-2032)
Figure 29. North America Multigrain Premixes Revenue (USD Million) By Application (2021-2032)
Figure 30. North America Multigrain Premixes Revenue (USD Million) By Product (2021-2032)
Figure 31. Europe Multigrain Premixes Revenue (USD Million) By Type (2021-2032)
Figure 32. Europe Multigrain Premixes Revenue (USD Million) By Application (2021-2032)
Figure 33. Europe Multigrain Premixes Revenue (USD Million) By Product (2021-2032)
Figure 34. Asia Pacific Multigrain Premixes Revenue (USD Million) By Type (2021-2032)
Figure 35. Asia Pacific Multigrain Premixes Revenue (USD Million) By Application (2021-2032)
Figure 36. Asia Pacific Multigrain Premixes Revenue (USD Million) By Product (2021-2032)
Figure 37. South America Multigrain Premixes Revenue (USD Million) By Type (2021-2032)
Figure 38. South America Multigrain Premixes Revenue (USD Million) By Application (2021-2032)
Figure 39. South America Multigrain Premixes Revenue (USD Million) By Product (2021-2032)
Figure 40. Middle East and Africa Multigrain Premixes Revenue (USD Million) By Type (2021-2032)
Figure 41. Middle East and Africa Multigrain Premixes Revenue (USD Million) By Application (2021-2032)
Figure 42. Middle East and Africa Multigrain Premixes Revenue (USD Million) By Product (2021-2032)
By Nature
Organic
Conventional
By Source
Wheat
Sorghum
Oats
Quinoa
Rye
Barley
Maize/Corn
Pulses
By Distribution Channel
Direct Sales
Indirect Sales
By End-User
Bars and Crackers
Bread
Biscuits and Cookies
Brownies and Cakes
Sweet goods
Countries Analyzed
North America (US, Canada, Mexico)
Europe (Germany, UK, France, Spain, Italy, Russia, Rest of Europe)
Asia Pacific (China, India, Japan, South Korea, Australia, South East Asia, Rest of Asia)
South America (Brazil, Argentina, Rest of South America)
Middle East and Africa (Saudi Arabia, UAE, Rest of Middle East, South Africa, Egypt, Rest of Africa)
