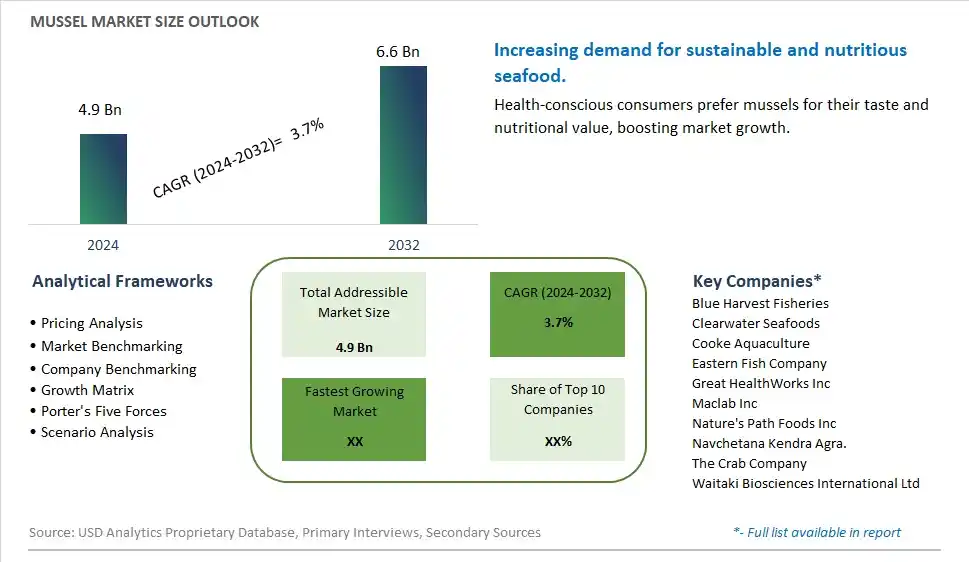
Global Mussel Market Size is valued at $4.9 Billion in 2024 and is forecast to register a growth rate (CAGR) of 3.7% to reach $6.6 Billion by 2032.
The global Mussel Market Comprehensive Study analyzes and forecasts the market size across 6 regions and 24 countries for diverse segments -By Type (Organic, Conventional), By Species (Blue Mussels, Rabbits foot Mussels, Snuffbox Mussels, Horse Mussel, Others), By Product (Shelled, Half Shelled, Cooked), By Format (Fresh, Frozen, Canned), By End-User (HoReCa, Retail, Hypermarkets/Supermarkets, Online Retail, Others)
An Introduction to Mussel Market
In 2024, the mussel market is thriving, fueled by the demand for sustainable and nutritious seafood options. Mussels, known for their high protein content and environmental benefits, are popular in a variety of culinary applications. The market benefits from innovations in aquaculture and processing techniques that enhance product quality and sustainability. The trend towards clean label and natural ingredients is influencing product development. Increasing consumer interest in healthy and sustainable seafood, supported by the popularity of Mediterranean and Asian cuisines, is further supporting market growth.
Mussel Competitive Landscape
The market report analyses the leading companies in the industry including Blue Harvest Fisheries, Clearwater Seafoods, Cooke Aquaculture, Eastern Fish Company, Great HealthWorks Inc, Maclab Inc, Nature's Path Foods Inc, Navchetana Kendra Agra., The Crab Company, Waitaki Biosciences International Ltd, and Others.
Mussel Market Dynamics
Mussel Market Trend: Increasing Demand for Sustainable and Nutritious Seafood
The most prominent trend in the Mussel Market is the increasing demand for sustainable and nutritious seafood. Mussels, known for their high protein content and environmental benefits, are becoming popular among consumers seeking eco-friendly and healthy seafood options, driven by the desire for sustainable food choices.
Mussel Market Driver: Health Benefits and Nutritional Value
A key driver in the Mussel Market is the health benefits and nutritional value of mussels. Rich in omega-3 fatty acids, vitamins, and minerals, mussels are valued for their potential to support heart health, improve brain function, and provide essential nutrients, boosting their demand among health-conscious consumers.
Mussel Market Opportunity: Innovation in Ready-to-Eat and Convenience Products
One significant opportunity in the Mussel Market lies in innovation in ready-to-eat and convenience products. Companies can develop new mussel products that offer easy preparation and diverse flavors, such as marinated, smoked, or pre-cooked mussels, catering to busy consumers seeking nutritious and convenient meal options, driving market growth.
Mussel Market Share Analysis- Largest Segment by Type
The Conventional mussel segment is the largest in the Mussel Market. This is primarily due to the established infrastructure and supply chains associated with conventional mussel farming, which has been the dominant method for many years. Conventional mussels are more widely available and tend to be less expensive compared to organic mussels, which still represent a niche market. Additionally, the volume of conventional mussels produced and consumed is significantly higher, making it the largest segment in terms of market share.
Mussel Market Share Analysis- Fastest Growing Segment by Species
The Blue Mussels species is poised to grow the fastest in the Mussel Market over the next five years. Blue mussels are favored for their adaptability to various environmental conditions and their well-established farming practices. They are also known for their high nutritional value and taste, which appeal to a broad consumer base. The increasing popularity of blue mussels in both culinary and nutritional applications drives their growth, supported by expanding market preferences and advancements in aquaculture techniques.
Mussel Market Share Analysis- Largest Segment by Product
The Shelled mussel product is the largest segment in the Mussel Market. Shelled mussels offer significant convenience and versatility, which drives their preference among consumers and food service providers. The ease of preparation and the reduced labor involved in cooking with shelled mussels contribute to their dominant market position. Additionally, their widespread use in various dishes and cuisines, from seafood recipes to ready-to-eat products, reinforces their status as the largest product segment.
Mussel Market Share Analysis- Fastest Growing Segment by Format
The Frozen mussel format is set to grow the fastest in the Mussel Market over the next five years. This growth is driven by the increasing demand for convenient, long-lasting seafood options. Frozen mussels offer extended shelf life and ease of storage, making them an attractive option for both retailers and consumers. The expansion of frozen seafood products in supermarkets and the rising popularity of home cooking contribute to the rapid growth of the frozen mussel segment.
Mussel Market Segmentation
By Type
Organic
Conventional
By Species
Blue Mussels
Rabbits foot Mussels
Snuffbox Mussels
Horse Mussel
Others
By Product
Shelled
Half Shelled
Cooked
By Format
Fresh
Frozen
Canned
By End-User
HoReCa
Retail
Hypermarkets/Supermarkets
Online Retail
Others
Countries Analyzed
North America (US, Canada, Mexico)
Europe (Germany, UK, France, Spain, Italy, Russia, Rest of Europe)
Asia Pacific (China, India, Japan, South Korea, Australia, South East Asia, Rest of Asia)
South America (Brazil, Argentina, Rest of South America)
Middle East and Africa (Saudi Arabia, UAE, Rest of Middle East, South Africa, Egypt, Rest of Africa)
Mussel Companies Profiled in the Study
Blue Harvest Fisheries
Clearwater Seafoods
Cooke Aquaculture
Eastern Fish Company
Great HealthWorks Inc
Maclab Inc
Nature's Path Foods Inc
Navchetana Kendra Agra.
The Crab Company
Waitaki Biosciences International Ltd
*- List Not Exhaustive
Chapter 1. TABLE OF CONTENTS
Chapter 2. Introduction to Mussel Market
2.1. Market Overview
2.2. Key Statistics and Report Highlights
2.3. Scope of the Comprehensive Study
2.3.1. Market Definition
2.3.2 Countries and Regions Covered
2.3.3 Research Objective
2.3.4 Units, Currency, and Conversions
2.3.5 Industry Value Chain
2.4. Key Market Segments
2.5. Key Companies
2.6. Study Period
Chapter 3. Strategic Analysis Review
3.1. Mussel Pricing Analysis and Forecast
3.2. Porter’s Five Forces
3.3. Market Ecosystem
3.4. SWOT Analysis
3.5. Regulatory Scenario
3.3. Effects of Inflation, Russia-Ukraine War, moderating economic growth, and other macroeconomic factors
Chapter 4. Competitive Landscape
4.1. Market Share Analysis
4.1.1. Global Mussel Market Share by Company, 2023
4.1.2. Product Offerings of Leading Mussel Companies
4.2. Market Entropy
4.2.1. New Product Launches in the Industry
4.2.2. Mergers, Acquisitions, Joint ventures, and Partnerships
4.3. Key Strategies and Best Practices
Chapter 5. Global Market Projections: Best, Reference, and Low Case Scenarios
5.1. Growth Analysis- Case Scenario Definitions
5.2. Low Growth Case Scenario Forecasts
5.3. Reference Growth Case Scenario Forecasts
5.4. High Growth Case Scenario Forecasts
Chapter 6. Market Dynamics
6.1. Mussel Market Drivers
6.2. Mussel Market Challenges
6.6. Mussel Market Opportunities
6.4. Mussel Market Trends
Chapter 7. Global Mussel Market Outlook Trends
7.1. Global Mussel Revenue (USD Million) and CAGR (%) by Type (2021-2032)
7.2. Global Mussel Revenue (USD Million) and CAGR (%) by Application (2021-2032)
7.3. Global Mussel Revenue (USD Million) and CAGR (%) by Product (2021-2032)
By Type
Organic
Conventional
By Species
Blue Mussels
Rabbits foot Mussels
Snuffbox Mussels
Horse Mussel
Others
By Product
Shelled
Half Shelled
Cooked
By Format
Fresh
Frozen
Canned
By End-User
HoReCa
Retail
Hypermarkets/Supermarkets
Online Retail
Others
Chapter 8. Global Mussel Regional Analysis and Outlook
8.1. Global Mussel Revenue (USD Million) By Regions (2021- 2032)
8.2. North America Mussel Revenue (USD Million) by Country (2021-2032)
8.2.1. United States Mussel Regional Analysis and Outlook
8.2.2. Canada Mussel Regional Analysis and Outlook
8.2.3. Mexico Mussel Regional Analysis and Outlook
8.3. Europe Mussel Revenue (USD Million), by Country (2021-2032)
8.3.1. Germany Mussel Regional Analysis and Outlook
8.3.2. France Mussel Regional Analysis and Outlook
8.3.3. United Kingdom Mussel Regional Analysis and Outlook
8.3.4. Spain Mussel Regional Analysis and Outlook
8.3.5. Italy Mussel Regional Analysis and Outlook
8.3.6. Russia Mussel Regional Analysis and Outlook
8.3.7. Rest of Europe Mussel Regional Analysis and Outlook
8.4. Asia Pacific Mussel Revenue (USD Million) by Country (2021-2032)
8.4.1. China Mussel Regional Analysis and Outlook
8.4.2. Japan Mussel Regional Analysis and Outlook
8.4.3. India Mussel Regional Analysis and Outlook
8.4.4. South Korea Mussel Regional Analysis and Outlook
8.4.5. Australia Mussel Regional Analysis and Outlook
8.4.6. South East Asia Mussel Regional Analysis and Outlook
8.4.7. Rest of Asia Pacific Mussel Regional Analysis and Outlook
8.5. South America Mussel Revenue (USD Million), by Country (2021-2032)
8.5.1. Brazil Mussel Regional Analysis and Outlook
8.5.2. Argentina Mussel Regional Analysis and Outlook
8.5.3. Rest of South America Mussel Regional Analysis and Outlook
8.6. Middle East and Africa Mussel Revenue (USD Million) by Country (2021-2032)
8.6.1. Middle East Mussel Regional Analysis and Outlook
8.6.2. Africa Mussel Regional Analysis and Outlook
Chapter 9. North America Mussel Analysis and Outlook
9.1. North America Mussel Revenue (USD Million) by Segments (2021-2032)
9.1.1. North America Mussel Revenue (USD Million) by Type (2021-2032)
9.1.2. North America Mussel Revenue (USD Million) by Application (2021-2032)
9.1.3. North America Mussel Revenue (USD Million) by Product (2021-2032)
By Type
Organic
Conventional
By Species
Blue Mussels
Rabbits foot Mussels
Snuffbox Mussels
Horse Mussel
Others
By Product
Shelled
Half Shelled
Cooked
By Format
Fresh
Frozen
Canned
By End-User
HoReCa
Retail
Hypermarkets/Supermarkets
Online Retail
Others
Chapter 10. Europe Mussel Analysis and Outlook
10.1. Europe Mussel Revenue (USD Million), by Segments (USD Million) (2021-2032)
10.1.1. Europe Mussel Revenue (USD Million) by Type (2021-2032)
10.1.2. Europe Mussel Revenue (USD Million) by Application (2021-2032)
10.1.3. Europe Mussel Revenue (USD Million) by Product (2021-2032)
By Type
Organic
Conventional
By Species
Blue Mussels
Rabbits foot Mussels
Snuffbox Mussels
Horse Mussel
Others
By Product
Shelled
Half Shelled
Cooked
By Format
Fresh
Frozen
Canned
By End-User
HoReCa
Retail
Hypermarkets/Supermarkets
Online Retail
Others
Chapter 11. Asia Pacific Mussel Analysis and Outlook
11.1. Asia Pacific Mussel Revenue (USD Million), and Revenue (USD Million) by Segments (2021-2032)
11.1.1. Asia Pacific Mussel Revenue (USD Million) by Type (2021-2032)
11.1.2. Asia Pacific Mussel Revenue (USD Million) by Application (2021-2032)
11.1.3. Asia Pacific Mussel Revenue (USD Million) by Product (2021-2032)
By Type
Organic
Conventional
By Species
Blue Mussels
Rabbits foot Mussels
Snuffbox Mussels
Horse Mussel
Others
By Product
Shelled
Half Shelled
Cooked
By Format
Fresh
Frozen
Canned
By End-User
HoReCa
Retail
Hypermarkets/Supermarkets
Online Retail
Others
Chapter 12. South America Mussel Analysis and Outlook
12.1. South America Mussel Revenue (USD Million), by Segments (2021-2032)
12.1.1. South America Mussel Revenue (USD Million) by Type (2021-2032)
12.1.2. South America Mussel Revenue (USD Million) by Application (2021-2032)
12.1.3. South America Mussel Revenue (USD Million) by Product (2021-2032)
By Type
Organic
Conventional
By Species
Blue Mussels
Rabbits foot Mussels
Snuffbox Mussels
Horse Mussel
Others
By Product
Shelled
Half Shelled
Cooked
By Format
Fresh
Frozen
Canned
By End-User
HoReCa
Retail
Hypermarkets/Supermarkets
Online Retail
Others
Chapter 13. Middle East and Africa Mussel Analysis and Outlook
13.1. Middle East and Africa Mussel Revenue (USD Million), by Segments (2021-2032)
13.1.1. Middle East and Africa Mussel Revenue (USD Million) by Type (2021-2032)
13.1.2. Middle East and Africa Mussel Revenue (USD Million) by Application (2021-2032)
13.1.3. Middle East and Africa Mussel Revenue (USD Million) by Product (2021-2032)
By Type
Organic
Conventional
By Species
Blue Mussels
Rabbits foot Mussels
Snuffbox Mussels
Horse Mussel
Others
By Product
Shelled
Half Shelled
Cooked
By Format
Fresh
Frozen
Canned
By End-User
HoReCa
Retail
Hypermarkets/Supermarkets
Online Retail
Others
Chapter 14. Mussel Company Profiles
14.1 Business Overview
14.2 Product Profiles
14.3 SWOT Profiles
14.5 Recent Developments
14.6 Financial Profile
List of Companies
Blue Harvest Fisheries
Clearwater Seafoods
Cooke Aquaculture
Eastern Fish Company
Great HealthWorks Inc
Maclab Inc
Nature's Path Foods Inc
Navchetana Kendra Agra.
The Crab Company
Waitaki Biosciences International Ltd
15. Methodology and Data Sources
15.1 Customization Offerings
15.2 Subscription Services
15.3 Related Reports
15.4 Publisher Expertise
LIST OF TABLES
Table 1 Market Segmentation Analysis
Table 2 Global Mussel Market Share of Leading Companies, 2023
Table 3 Product Offerings of Leading Companies
Table 4 Low Growth Scenario Forecasts
Table 5 Reference Case Growth Scenario
Table 6 High Growth Case Scenario
Table 7 Global Mussel Revenue (USD Million) And CAGR (%) By Type (2021-2032)
Table 8 Global Mussel Revenue (USD Million) And CAGR (%) By Application (2021-2032)
Table 9 Global Mussel Revenue (USD Million) And CAGR (%) By Product (2021-2032)
Table 10 Global Mussel Market Revenue (USD Million) By Regions (2021-2032)
Table 11 Global Mussel Market Share (%) By Regions (2021-2032)
Table 12 North America Mussel Revenue (USD Million) By Country (2021-2032)
Table 13 Europe Mussel Revenue (USD Million) By Country (2021-2032)
Table 14 Asia Pacific Mussel Revenue (USD Million) By Country (2021-2032)
Table 15 South America Mussel Revenue (USD Million) By Country (2021-2032)
Table 16 Middle East and Africa Mussel Revenue (USD Million) By Region (2021-2032)
Table 17 North America Mussel Revenue (USD Million) By Type (2021-2032)
Table 18 North America Mussel Revenue (USD Million) By Application (2021-2032)
Table 19 North America Mussel Revenue (USD Million) By Product (2021-2032)
Table 20 Europe Mussel Revenue (USD Million) By Type (2021-2032)
Table 21 Europe Mussel Revenue (USD Million) By Application (2021-2032)
Table 22 Europe Mussel Revenue (USD Million) By Product (2021-2032)
Table 23 Asia Pacific Mussel Revenue (USD Million) By Type (2021-2032)
Table 24 Asia Pacific Mussel Revenue (USD Million) By Application (2021-2032)
Table 25 Asia Pacific Mussel Revenue (USD Million) By Product (2021-2032)
Table 26 South America Mussel Revenue (USD Million) By Type (2021-2032)
Table 27 South America Mussel Revenue (USD Million) By Application (2021-2032)
Table 28 South America Mussel Revenue (USD Million) By Product (2021-2032)
Table 29 Middle East and Africa Mussel Revenue (USD Million) By Type (2021-2032)
Table 30 Middle East and Africa Mussel Revenue (USD Million) By Application (2021-2032)
Table 31 Middle East and Africa Mussel Revenue (USD Million) By Product (2021-2032)
LIST OF FIGURES
Figure 1. Market Scope
Figure 2. Pricing Forecasts Per Unit, 2023- 2032
Figure 3. Porter’s Five Forces
Figure 4. Global Mussel Market Revenue (USD Million) By Regions (2021-2032)
Figure 5. Global Mussel Market Share (%) By Regions (2023)
Figure 6. North America Mussel Revenue (USD Million) By Country (2021-2032)
Figure 7. United States Mussel Revenue (USD Million) By Country (2021-2032)
Figure 8. Canada Mussel Revenue (USD Million) By Country (2021-2032)
Figure 9. Mexico Mussel Revenue (USD Million) By Country (2021-2032)
Figure 10. Europe Mussel Revenue (USD Million) By Country (2021-2032)
Figure 11. Germany Mussel Revenue (USD Million) By Country (2021-2032)
Figure 12. France Mussel Revenue (USD Million) By Country (2021-2032)
Figure 13. United Kingdom Mussel Revenue (USD Million) By Country (2021-2032)
Figure 14. Spain Mussel Revenue (USD Million) By Country (2021-2032)
Figure 15. Italy Mussel Revenue (USD Million) By Country (2021-2032)
Figure 16. Russia Mussel Revenue (USD Million) By Country (2021-2032)
Figure 17. Rest of Europe Mussel Revenue (USD Million) By Country (2021-2032)
Figure 11. Asia Pacific Mussel Revenue (USD Million) By Country (2021-2032)
Figure 12. China Mussel Revenue (USD Million) By Country (2021-2032)
Figure 13. Japan Mussel Revenue (USD Million) By Country (2021-2032)
Figure 14. India Mussel Revenue (USD Million) By Country (2021-2032)
Figure 15. South Korea Mussel Revenue (USD Million) By Country (2021-2032)
Figure 16. Australia Mussel Revenue (USD Million) By Country (2021-2032)
Figure 17. South East Asia Mussel Revenue (USD Million) By Country (2021-2032)
Figure 18. South America Mussel Revenue (USD Million) By Country (2021-2032)
Figure 19. Brazil Mussel Revenue (USD Million) By Country (2021-2032)
Figure 20. Argentina Mussel Revenue (USD Million) By Country (2021-2032)
Figure 21. Rest of Asia Pacific Mussel Revenue (USD Million) By Country (2021-2032)
Figure 22. Middle East and Africa Mussel Revenue (USD Million) By Region (2021-2032)
Figure 23. Saudi Arabia Mussel Revenue (USD Million) By Region (2021-2032)
Figure 24. The UAE Mussel Revenue (USD Million) By Region (2021-2032)
Figure 25. Rest of Middle East Mussel Revenue (USD Million) By Region (2021-2032)
Figure 26. South Africa Mussel Revenue (USD Million) By Region (2021-2032)
Figure 27. Africa Mussel Revenue (USD Million) By Region (2021-2032)
Figure 28. North America Mussel Revenue (USD Million) By Type (2021-2032)
Figure 29. North America Mussel Revenue (USD Million) By Application (2021-2032)
Figure 30. North America Mussel Revenue (USD Million) By Product (2021-2032)
Figure 31. Europe Mussel Revenue (USD Million) By Type (2021-2032)
Figure 32. Europe Mussel Revenue (USD Million) By Application (2021-2032)
Figure 33. Europe Mussel Revenue (USD Million) By Product (2021-2032)
Figure 34. Asia Pacific Mussel Revenue (USD Million) By Type (2021-2032)
Figure 35. Asia Pacific Mussel Revenue (USD Million) By Application (2021-2032)
Figure 36. Asia Pacific Mussel Revenue (USD Million) By Product (2021-2032)
Figure 37. South America Mussel Revenue (USD Million) By Type (2021-2032)
Figure 38. South America Mussel Revenue (USD Million) By Application (2021-2032)
Figure 39. South America Mussel Revenue (USD Million) By Product (2021-2032)
Figure 40. Middle East and Africa Mussel Revenue (USD Million) By Type (2021-2032)
Figure 41. Middle East and Africa Mussel Revenue (USD Million) By Application (2021-2032)
Figure 42. Middle East and Africa Mussel Revenue (USD Million) By Product (2021-2032)
By Type
Organic
Conventional
By Species
Blue Mussels
Rabbits foot Mussels
Snuffbox Mussels
Horse Mussel
Others
By Product
Shelled
Half Shelled
Cooked
By Format
Fresh
Frozen
Canned
By End-User
HoReCa
Retail
Hypermarkets/Supermarkets
Online Retail
Others
Countries Analyzed
North America (US, Canada, Mexico)
Europe (Germany, UK, France, Spain, Italy, Russia, Rest of Europe)
Asia Pacific (China, India, Japan, South Korea, Australia, South East Asia, Rest of Asia)
South America (Brazil, Argentina, Rest of South America)
Middle East and Africa (Saudi Arabia, UAE, Rest of Middle East, South Africa, Egypt, Rest of Africa)
