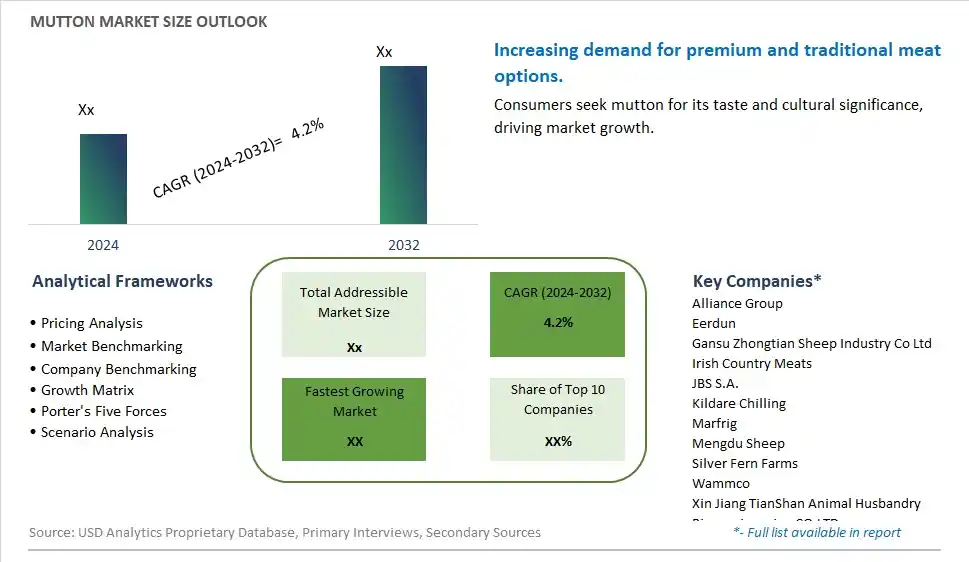
Global Mutton Market Size is valued at $XX Million in 2024 and is forecast to register a growth rate (CAGR) of 4.2% to reach $XX Million by 2032.
The global Mutton Market Comprehensive Study analyzes and forecasts the market size across 6 regions and 24 countries for diverse segments -By Type (Goat Meat, Sheep Meat), By Application (HoReCa, Home Use, Others)
An Introduction to Mutton Market
In 2024, the mutton market is thriving, fueled by the demand for flavorful and nutritious meat in various culinary traditions. Mutton, derived from mature sheep, is valued for its rich taste and versatility in cooking. The market benefits from innovations in farming and processing techniques that enhance meat quality and safety. The trend towards clean label and natural ingredients is influencing product development. Increasing consumer interest in traditional and ethnic cuisines, supported by the popularity of sustainable and locally sourced meats, is further supporting market growth.
Mutton Competitive Landscape
The market report analyses the leading companies in the industry including Alliance Group, Eerdun, Gansu Zhongtian Sheep Industry Co Ltd, Irish Country Meats, JBS S.A., Kildare Chilling, Marfrig, Mengdu Sheep, Silver Fern Farms, Wammco, Xin Jiang TianShan Animal Husbandry Bio-engineering CO.LTD, and Others.
Mutton Market Dynamics
Mutton Market Trend: Increasing Demand for Ethnic and Gourmet Meats
The most prominent trend in the Mutton Market is the increasing demand for ethnic and gourmet meats. Mutton, known for its rich flavor and culinary versatility, is gaining popularity among consumers seeking unique and traditional meat products, driven by the desire for authentic and gourmet food experiences.
Mutton Market Driver: Growth of the Global Meat Market
Mutton Market Share Analysis- Largest Segment by Type
The Sheep Meat segment is the largest in the Mutton Market. This predominance is due to sheep meat's extensive use in traditional cuisines across various regions, including the Middle East, Asia, and parts of Europe. Sheep meat, particularly lamb and mutton, is a staple in numerous cultural dishes, driving its higher demand compared to goat meat. Its well-established market presence, consumer preference, and broader application in various culinary traditions contribute to its position as the largest segment in the mutton market.
Mutton Market Share Analysis- Fastest Growing Segment by Application
The HoReCa (Hotel, Restaurant, and Catering) segment is poised to grow the fastest in the Mutton Market over the next five years. This growth is driven by the increasing popularity of exotic and gourmet dishes in the foodservice industry, where mutton is a key ingredient. The rise in dining out, the expansion of high-end restaurants, and the growing trend of offering diverse and premium menu options contribute to the accelerated demand in the HoReCa segment. This sector's dynamic nature and its role in driving culinary innovation make it the fastest-growing application segment in the mutton market.
Mutton Market Segmentation
By Type
Goat Meat
Sheep Meat
By Application
HoReCa
Home Use
Others
Countries Analyzed
North America (US, Canada, Mexico)
Europe (Germany, UK, France, Spain, Italy, Russia, Rest of Europe)
Asia Pacific (China, India, Japan, South Korea, Australia, South East Asia, Rest of Asia)
South America (Brazil, Argentina, Rest of South America)
Middle East and Africa (Saudi Arabia, UAE, Rest of Middle East, South Africa, Egypt, Rest of Africa)
Mutton Companies Profiled in the Study
Alliance Group
Eerdun
Gansu Zhongtian Sheep Industry Co Ltd
Irish Country Meats
JBS S.A.
Kildare Chilling
Marfrig
Mengdu Sheep
Silver Fern Farms
Wammco
Xin Jiang TianShan Animal Husbandry Bio-engineering CO.LTD
*- List Not Exhaustive
Chapter 1. TABLE OF CONTENTS
Chapter 2. Introduction to Mutton Market
2.1. Market Overview
2.2. Key Statistics and Report Highlights
2.3. Scope of the Comprehensive Study
2.3.1. Market Definition
2.3.2 Countries and Regions Covered
2.3.3 Research Objective
2.3.4 Units, Currency, and Conversions
2.3.5 Industry Value Chain
2.4. Key Market Segments
2.5. Key Companies
2.6. Study Period
Chapter 3. Strategic Analysis Review
3.1. Mutton Pricing Analysis and Forecast
3.2. Porter’s Five Forces
3.3. Market Ecosystem
3.4. SWOT Analysis
3.5. Regulatory Scenario
3.3. Effects of Inflation, Russia-Ukraine War, moderating economic growth, and other macroeconomic factors
Chapter 4. Competitive Landscape
4.1. Market Share Analysis
4.1.1. Global Mutton Market Share by Company, 2023
4.1.2. Product Offerings of Leading Mutton Companies
4.2. Market Entropy
4.2.1. New Product Launches in the Industry
4.2.2. Mergers, Acquisitions, Joint ventures, and Partnerships
4.3. Key Strategies and Best Practices
Chapter 5. Global Market Projections: Best, Reference, and Low Case Scenarios
5.1. Growth Analysis- Case Scenario Definitions
5.2. Low Growth Case Scenario Forecasts
5.3. Reference Growth Case Scenario Forecasts
5.4. High Growth Case Scenario Forecasts
Chapter 6. Market Dynamics
6.1. Mutton Market Drivers
6.2. Mutton Market Challenges
6.6. Mutton Market Opportunities
6.4. Mutton Market Trends
Chapter 7. Global Mutton Market Outlook Trends
7.1. Global Mutton Revenue (USD Million) and CAGR (%) by Type (2021-2032)
7.2. Global Mutton Revenue (USD Million) and CAGR (%) by Application (2021-2032)
7.3. Global Mutton Revenue (USD Million) and CAGR (%) by Product (2021-2032)
By Type
Goat Meat
Sheep Meat
By Application
HoReCa
Home Use
Others
Chapter 8. Global Mutton Regional Analysis and Outlook
8.1. Global Mutton Revenue (USD Million) By Regions (2021- 2032)
8.2. North America Mutton Revenue (USD Million) by Country (2021-2032)
8.2.1. United States Mutton Regional Analysis and Outlook
8.2.2. Canada Mutton Regional Analysis and Outlook
8.2.3. Mexico Mutton Regional Analysis and Outlook
8.3. Europe Mutton Revenue (USD Million), by Country (2021-2032)
8.3.1. Germany Mutton Regional Analysis and Outlook
8.3.2. France Mutton Regional Analysis and Outlook
8.3.3. United Kingdom Mutton Regional Analysis and Outlook
8.3.4. Spain Mutton Regional Analysis and Outlook
8.3.5. Italy Mutton Regional Analysis and Outlook
8.3.6. Russia Mutton Regional Analysis and Outlook
8.3.7. Rest of Europe Mutton Regional Analysis and Outlook
8.4. Asia Pacific Mutton Revenue (USD Million) by Country (2021-2032)
8.4.1. China Mutton Regional Analysis and Outlook
8.4.2. Japan Mutton Regional Analysis and Outlook
8.4.3. India Mutton Regional Analysis and Outlook
8.4.4. South Korea Mutton Regional Analysis and Outlook
8.4.5. Australia Mutton Regional Analysis and Outlook
8.4.6. South East Asia Mutton Regional Analysis and Outlook
8.4.7. Rest of Asia Pacific Mutton Regional Analysis and Outlook
8.5. South America Mutton Revenue (USD Million), by Country (2021-2032)
8.5.1. Brazil Mutton Regional Analysis and Outlook
8.5.2. Argentina Mutton Regional Analysis and Outlook
8.5.3. Rest of South America Mutton Regional Analysis and Outlook
8.6. Middle East and Africa Mutton Revenue (USD Million) by Country (2021-2032)
8.6.1. Middle East Mutton Regional Analysis and Outlook
8.6.2. Africa Mutton Regional Analysis and Outlook
Chapter 9. North America Mutton Analysis and Outlook
9.1. North America Mutton Revenue (USD Million) by Segments (2021-2032)
9.1.1. North America Mutton Revenue (USD Million) by Type (2021-2032)
9.1.2. North America Mutton Revenue (USD Million) by Application (2021-2032)
9.1.3. North America Mutton Revenue (USD Million) by Product (2021-2032)
By Type
Goat Meat
Sheep Meat
By Application
HoReCa
Home Use
Others
Chapter 10. Europe Mutton Analysis and Outlook
10.1. Europe Mutton Revenue (USD Million), by Segments (USD Million) (2021-2032)
10.1.1. Europe Mutton Revenue (USD Million) by Type (2021-2032)
10.1.2. Europe Mutton Revenue (USD Million) by Application (2021-2032)
10.1.3. Europe Mutton Revenue (USD Million) by Product (2021-2032)
By Type
Goat Meat
Sheep Meat
By Application
HoReCa
Home Use
Others
Chapter 11. Asia Pacific Mutton Analysis and Outlook
11.1. Asia Pacific Mutton Revenue (USD Million), and Revenue (USD Million) by Segments (2021-2032)
11.1.1. Asia Pacific Mutton Revenue (USD Million) by Type (2021-2032)
11.1.2. Asia Pacific Mutton Revenue (USD Million) by Application (2021-2032)
11.1.3. Asia Pacific Mutton Revenue (USD Million) by Product (2021-2032)
By Type
Goat Meat
Sheep Meat
By Application
HoReCa
Home Use
Others
Chapter 12. South America Mutton Analysis and Outlook
12.1. South America Mutton Revenue (USD Million), by Segments (2021-2032)
12.1.1. South America Mutton Revenue (USD Million) by Type (2021-2032)
12.1.2. South America Mutton Revenue (USD Million) by Application (2021-2032)
12.1.3. South America Mutton Revenue (USD Million) by Product (2021-2032)
By Type
Goat Meat
Sheep Meat
By Application
HoReCa
Home Use
Others
Chapter 13. Middle East and Africa Mutton Analysis and Outlook
13.1. Middle East and Africa Mutton Revenue (USD Million), by Segments (2021-2032)
13.1.1. Middle East and Africa Mutton Revenue (USD Million) by Type (2021-2032)
13.1.2. Middle East and Africa Mutton Revenue (USD Million) by Application (2021-2032)
13.1.3. Middle East and Africa Mutton Revenue (USD Million) by Product (2021-2032)
By Type
Goat Meat
Sheep Meat
By Application
HoReCa
Home Use
Others
Chapter 14. Mutton Company Profiles
14.1 Business Overview
14.2 Product Profiles
14.3 SWOT Profiles
14.5 Recent Developments
14.6 Financial Profile
List of Companies
Alliance Group
Eerdun
Gansu Zhongtian Sheep Industry Co Ltd
Irish Country Meats
JBS S.A.
Kildare Chilling
Marfrig
Mengdu Sheep
Silver Fern Farms
Wammco
Xin Jiang TianShan Animal Husbandry Bio-engineering CO.LTD
15. Methodology and Data Sources
15.1 Customization Offerings
15.2 Subscription Services
15.3 Related Reports
15.4 Publisher Expertise
LIST OF TABLES
Table 1 Market Segmentation Analysis
Table 2 Global Mutton Market Share of Leading Companies, 2023
Table 3 Product Offerings of Leading Companies
Table 4 Low Growth Scenario Forecasts
Table 5 Reference Case Growth Scenario
Table 6 High Growth Case Scenario
Table 7 Global Mutton Revenue (USD Million) And CAGR (%) By Type (2021-2032)
Table 8 Global Mutton Revenue (USD Million) And CAGR (%) By Application (2021-2032)
Table 9 Global Mutton Revenue (USD Million) And CAGR (%) By Product (2021-2032)
Table 10 Global Mutton Market Revenue (USD Million) By Regions (2021-2032)
Table 11 Global Mutton Market Share (%) By Regions (2021-2032)
Table 12 North America Mutton Revenue (USD Million) By Country (2021-2032)
Table 13 Europe Mutton Revenue (USD Million) By Country (2021-2032)
Table 14 Asia Pacific Mutton Revenue (USD Million) By Country (2021-2032)
Table 15 South America Mutton Revenue (USD Million) By Country (2021-2032)
Table 16 Middle East and Africa Mutton Revenue (USD Million) By Region (2021-2032)
Table 17 North America Mutton Revenue (USD Million) By Type (2021-2032)
Table 18 North America Mutton Revenue (USD Million) By Application (2021-2032)
Table 19 North America Mutton Revenue (USD Million) By Product (2021-2032)
Table 20 Europe Mutton Revenue (USD Million) By Type (2021-2032)
Table 21 Europe Mutton Revenue (USD Million) By Application (2021-2032)
Table 22 Europe Mutton Revenue (USD Million) By Product (2021-2032)
Table 23 Asia Pacific Mutton Revenue (USD Million) By Type (2021-2032)
Table 24 Asia Pacific Mutton Revenue (USD Million) By Application (2021-2032)
Table 25 Asia Pacific Mutton Revenue (USD Million) By Product (2021-2032)
Table 26 South America Mutton Revenue (USD Million) By Type (2021-2032)
Table 27 South America Mutton Revenue (USD Million) By Application (2021-2032)
Table 28 South America Mutton Revenue (USD Million) By Product (2021-2032)
Table 29 Middle East and Africa Mutton Revenue (USD Million) By Type (2021-2032)
Table 30 Middle East and Africa Mutton Revenue (USD Million) By Application (2021-2032)
Table 31 Middle East and Africa Mutton Revenue (USD Million) By Product (2021-2032)
LIST OF FIGURES
Figure 1. Market Scope
Figure 2. Pricing Forecasts Per Unit, 2023- 2032
Figure 3. Porter’s Five Forces
Figure 4. Global Mutton Market Revenue (USD Million) By Regions (2021-2032)
Figure 5. Global Mutton Market Share (%) By Regions (2023)
Figure 6. North America Mutton Revenue (USD Million) By Country (2021-2032)
Figure 7. United States Mutton Revenue (USD Million) By Country (2021-2032)
Figure 8. Canada Mutton Revenue (USD Million) By Country (2021-2032)
Figure 9. Mexico Mutton Revenue (USD Million) By Country (2021-2032)
Figure 10. Europe Mutton Revenue (USD Million) By Country (2021-2032)
Figure 11. Germany Mutton Revenue (USD Million) By Country (2021-2032)
Figure 12. France Mutton Revenue (USD Million) By Country (2021-2032)
Figure 13. United Kingdom Mutton Revenue (USD Million) By Country (2021-2032)
Figure 14. Spain Mutton Revenue (USD Million) By Country (2021-2032)
Figure 15. Italy Mutton Revenue (USD Million) By Country (2021-2032)
Figure 16. Russia Mutton Revenue (USD Million) By Country (2021-2032)
Figure 17. Rest of Europe Mutton Revenue (USD Million) By Country (2021-2032)
Figure 11. Asia Pacific Mutton Revenue (USD Million) By Country (2021-2032)
Figure 12. China Mutton Revenue (USD Million) By Country (2021-2032)
Figure 13. Japan Mutton Revenue (USD Million) By Country (2021-2032)
Figure 14. India Mutton Revenue (USD Million) By Country (2021-2032)
Figure 15. South Korea Mutton Revenue (USD Million) By Country (2021-2032)
Figure 16. Australia Mutton Revenue (USD Million) By Country (2021-2032)
Figure 17. South East Asia Mutton Revenue (USD Million) By Country (2021-2032)
Figure 18. South America Mutton Revenue (USD Million) By Country (2021-2032)
Figure 19. Brazil Mutton Revenue (USD Million) By Country (2021-2032)
Figure 20. Argentina Mutton Revenue (USD Million) By Country (2021-2032)
Figure 21. Rest of Asia Pacific Mutton Revenue (USD Million) By Country (2021-2032)
Figure 22. Middle East and Africa Mutton Revenue (USD Million) By Region (2021-2032)
Figure 23. Saudi Arabia Mutton Revenue (USD Million) By Region (2021-2032)
Figure 24. The UAE Mutton Revenue (USD Million) By Region (2021-2032)
Figure 25. Rest of Middle East Mutton Revenue (USD Million) By Region (2021-2032)
Figure 26. South Africa Mutton Revenue (USD Million) By Region (2021-2032)
Figure 27. Africa Mutton Revenue (USD Million) By Region (2021-2032)
Figure 28. North America Mutton Revenue (USD Million) By Type (2021-2032)
Figure 29. North America Mutton Revenue (USD Million) By Application (2021-2032)
Figure 30. North America Mutton Revenue (USD Million) By Product (2021-2032)
Figure 31. Europe Mutton Revenue (USD Million) By Type (2021-2032)
Figure 32. Europe Mutton Revenue (USD Million) By Application (2021-2032)
Figure 33. Europe Mutton Revenue (USD Million) By Product (2021-2032)
Figure 34. Asia Pacific Mutton Revenue (USD Million) By Type (2021-2032)
Figure 35. Asia Pacific Mutton Revenue (USD Million) By Application (2021-2032)
Figure 36. Asia Pacific Mutton Revenue (USD Million) By Product (2021-2032)
Figure 37. South America Mutton Revenue (USD Million) By Type (2021-2032)
Figure 38. South America Mutton Revenue (USD Million) By Application (2021-2032)
Figure 39. South America Mutton Revenue (USD Million) By Product (2021-2032)
Figure 40. Middle East and Africa Mutton Revenue (USD Million) By Type (2021-2032)
Figure 41. Middle East and Africa Mutton Revenue (USD Million) By Application (2021-2032)
Figure 42. Middle East and Africa Mutton Revenue (USD Million) By Product (2021-2032)
By Type
Goat Meat
Sheep Meat
By Application
HoReCa
Home Use
Others
Countries Analyzed
North America (US, Canada, Mexico)
Europe (Germany, UK, France, Spain, Italy, Russia, Rest of Europe)
Asia Pacific (China, India, Japan, South Korea, Australia, South East Asia, Rest of Asia)
South America (Brazil, Argentina, Rest of South America)
Middle East and Africa (Saudi Arabia, UAE, Rest of Middle East, South Africa, Egypt, Rest of Africa)
