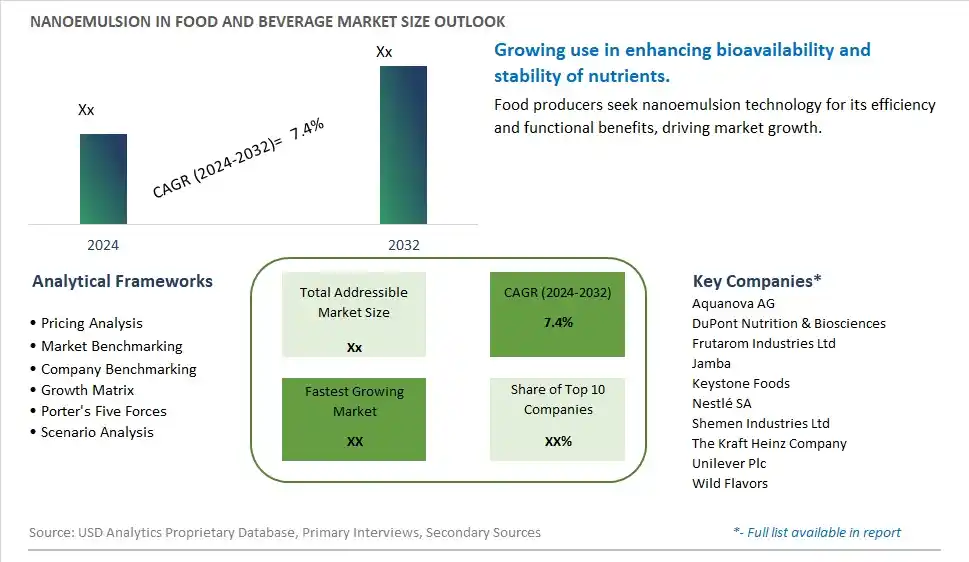
Global Nanoemulsion in Food and Beverage Market Size is valued at $XX Million in 2024 and is forecast to register a growth rate (CAGR) of 7.4% to reach $XX Million by 2032.
The global Nanoemulsion in Food and Beverage Market Comprehensive Study analyzes and forecasts the market size across 6 regions and 24 countries for diverse segments -By Type (Small Molecule Surfactant, Protein-stabilized Emulsions, Others), By Application (Beverages, Dairy, Others)
An Introduction to Nanoemulsion in Food and Beverage Market
In 2024, the nanoemulsion in food and beverage market is thriving, fueled by the demand for advanced delivery systems that enhance the bioavailability and stability of active ingredients. Nanoemulsions, which use nanotechnology to create fine oil-in-water emulsions, are used to deliver flavors, colors, and nutrients in various food and beverage applications. The market benefits from innovations in nanotechnology and formulation techniques that improve efficacy and safety. The trend towards clean label and functional ingredients is influencing product development. Increasing consumer interest in health and wellness, supported by the popularity of fortified and functional foods, is further supporting market growth.
Nanoemulsion in Food and Beverage Competitive Landscape
The market report analyses the leading companies in the industry including Aquanova AG, DuPont Nutrition & Biosciences, Frutarom Industries Ltd, Jamba, Keystone Foods, Nestlé SA, Shemen Industries Ltd, The Kraft Heinz Company, Unilever Plc, Wild Flavors, and Others.
Nanoemulsion in Food and Beverage Market Dynamics
Nanoemulsion in Food and Beverage Market Trend: Increasing Use of Nanoemulsions for Enhanced Bioavailability
The most prominent trend in the Nanoemulsion in Food and Beverage Market is the increasing use of nanoemulsions for enhanced bioavailability. Nanoemulsions, which improve the solubility and absorption of active ingredients, are being incorporated into various food and beverage products, driven by the demand for functional foods with superior efficacy.
Nanoemulsion in Food and Beverage Market Driver: Growth of the Health and Wellness Industry
A key driver in the Nanoemulsion in Food and Beverage Market is the growth of the health and wellness industry. As consumers become more focused on improving their health, there is a rising demand for products that offer enhanced nutrient delivery and bioavailability, supporting the use of nanoemulsions in food and beverages.
Nanoemulsion in Food and Beverage Market Opportunity: Expansion into Diverse Food and Beverage Applications
One significant opportunity in the Nanoemulsion in Food and Beverage Market lies in the expansion into diverse food and beverage applications. Companies can innovate by incorporating nanoemulsions into a variety of products, such as functional drinks, dietary supplements, and fortified foods, offering enhanced health benefits and attracting health-conscious consumers.
Nanoemulsion in Food and Beverage Market Share Analysis- Largest Segment by Type
The Small Molecule Surfactant segment is the largest in the Nanoemulsion in Food and Beverage Market. This dominance is due to the effectiveness of small molecule surfactants in stabilizing nanoemulsions, which enhances the texture, taste, and shelf life of food and beverage products. Small molecule surfactants offer superior performance in forming and maintaining stable nanoemulsions, which is crucial for applications in functional beverages, flavor delivery, and improved ingredient solubility. Their widespread use and proven benefits contribute to their leading position in the market for nanoemulsions.
Nanoemulsion in Food and Beverage Market Share Analysis- Fastest Growing Segment by Application
The Beverages application segment is poised to grow the fastest in the Nanoemulsion in Food and Beverage Market over the next five years. This growth is driven by the increasing demand for innovative beverage products that enhance flavor stability, texture, and nutrient delivery. Nanoemulsions are particularly valuable in beverages for improving solubility and bioavailability of active ingredients, such as vitamins and functional additives. The rise of health-conscious consumers and the expansion of functional and fortified beverages are accelerating the adoption of nanoemulsions in this sector. Additionally, advancements in nanoemulsion technology are enabling more effective integration into various beverage formulations, further propelling this segment's growth.
Nanoemulsion in Food and Beverage Market Segmentation
By Type
Small Molecule Surfactant
Protein-stabilized Emulsions
Others
By Application
Beverages
Dairy
Others
Countries Analyzed
North America (US, Canada, Mexico)
Europe (Germany, UK, France, Spain, Italy, Russia, Rest of Europe)
Asia Pacific (China, India, Japan, South Korea, Australia, South East Asia, Rest of Asia)
South America (Brazil, Argentina, Rest of South America)
Middle East and Africa (Saudi Arabia, UAE, Rest of Middle East, South Africa, Egypt, Rest of Africa)
Nanoemulsion in Food and Beverage Companies Profiled in the Study
Aquanova AG
DuPont Nutrition & Biosciences
Frutarom Industries Ltd
Jamba
Keystone Foods
Nestlé SA
Shemen Industries Ltd
The Kraft Heinz Company
Unilever Plc
Wild Flavors
*- List Not Exhaustive
Chapter 1. TABLE OF CONTENTS
Chapter 2. Introduction to Nanoemulsion in Food and Beverage Market
2.1. Market Overview
2.2. Key Statistics and Report Highlights
2.3. Scope of the Comprehensive Study
2.3.1. Market Definition
2.3.2 Countries and Regions Covered
2.3.3 Research Objective
2.3.4 Units, Currency, and Conversions
2.3.5 Industry Value Chain
2.4. Key Market Segments
2.5. Key Companies
2.6. Study Period
Chapter 3. Strategic Analysis Review
3.1. Nanoemulsion in Food and Beverage Pricing Analysis and Forecast
3.2. Porter’s Five Forces
3.3. Market Ecosystem
3.4. SWOT Analysis
3.5. Regulatory Scenario
3.3. Effects of Inflation, Russia-Ukraine War, moderating economic growth, and other macroeconomic factors
Chapter 4. Competitive Landscape
4.1. Market Share Analysis
4.1.1. Global Nanoemulsion in Food and Beverage Market Share by Company, 2023
4.1.2. Product Offerings of Leading Nanoemulsion in Food and Beverage Companies
4.2. Market Entropy
4.2.1. New Product Launches in the Industry
4.2.2. Mergers, Acquisitions, Joint ventures, and Partnerships
4.3. Key Strategies and Best Practices
Chapter 5. Global Market Projections: Best, Reference, and Low Case Scenarios
5.1. Growth Analysis- Case Scenario Definitions
5.2. Low Growth Case Scenario Forecasts
5.3. Reference Growth Case Scenario Forecasts
5.4. High Growth Case Scenario Forecasts
Chapter 6. Market Dynamics
6.1. Nanoemulsion in Food and Beverage Market Drivers
6.2. Nanoemulsion in Food and Beverage Market Challenges
6.6. Nanoemulsion in Food and Beverage Market Opportunities
6.4. Nanoemulsion in Food and Beverage Market Trends
Chapter 7. Global Nanoemulsion in Food and Beverage Market Outlook Trends
7.1. Global Nanoemulsion in Food and Beverage Revenue (USD Million) and CAGR (%) by Type (2021-2032)
7.2. Global Nanoemulsion in Food and Beverage Revenue (USD Million) and CAGR (%) by Application (2021-2032)
7.3. Global Nanoemulsion in Food and Beverage Revenue (USD Million) and CAGR (%) by Product (2021-2032)
By Type
Small Molecule Surfactant
Protein-stabilized Emulsions
Others
By Application
Beverages
Dairy
Others
Chapter 8. Global Nanoemulsion in Food and Beverage Regional Analysis and Outlook
8.1. Global Nanoemulsion in Food and Beverage Revenue (USD Million) By Regions (2021- 2032)
8.2. North America Nanoemulsion in Food and Beverage Revenue (USD Million) by Country (2021-2032)
8.2.1. United States Nanoemulsion in Food and Beverage Regional Analysis and Outlook
8.2.2. Canada Nanoemulsion in Food and Beverage Regional Analysis and Outlook
8.2.3. Mexico Nanoemulsion in Food and Beverage Regional Analysis and Outlook
8.3. Europe Nanoemulsion in Food and Beverage Revenue (USD Million), by Country (2021-2032)
8.3.1. Germany Nanoemulsion in Food and Beverage Regional Analysis and Outlook
8.3.2. France Nanoemulsion in Food and Beverage Regional Analysis and Outlook
8.3.3. United Kingdom Nanoemulsion in Food and Beverage Regional Analysis and Outlook
8.3.4. Spain Nanoemulsion in Food and Beverage Regional Analysis and Outlook
8.3.5. Italy Nanoemulsion in Food and Beverage Regional Analysis and Outlook
8.3.6. Russia Nanoemulsion in Food and Beverage Regional Analysis and Outlook
8.3.7. Rest of Europe Nanoemulsion in Food and Beverage Regional Analysis and Outlook
8.4. Asia Pacific Nanoemulsion in Food and Beverage Revenue (USD Million) by Country (2021-2032)
8.4.1. China Nanoemulsion in Food and Beverage Regional Analysis and Outlook
8.4.2. Japan Nanoemulsion in Food and Beverage Regional Analysis and Outlook
8.4.3. India Nanoemulsion in Food and Beverage Regional Analysis and Outlook
8.4.4. South Korea Nanoemulsion in Food and Beverage Regional Analysis and Outlook
8.4.5. Australia Nanoemulsion in Food and Beverage Regional Analysis and Outlook
8.4.6. South East Asia Nanoemulsion in Food and Beverage Regional Analysis and Outlook
8.4.7. Rest of Asia Pacific Nanoemulsion in Food and Beverage Regional Analysis and Outlook
8.5. South America Nanoemulsion in Food and Beverage Revenue (USD Million), by Country (2021-2032)
8.5.1. Brazil Nanoemulsion in Food and Beverage Regional Analysis and Outlook
8.5.2. Argentina Nanoemulsion in Food and Beverage Regional Analysis and Outlook
8.5.3. Rest of South America Nanoemulsion in Food and Beverage Regional Analysis and Outlook
8.6. Middle East and Africa Nanoemulsion in Food and Beverage Revenue (USD Million) by Country (2021-2032)
8.6.1. Middle East Nanoemulsion in Food and Beverage Regional Analysis and Outlook
8.6.2. Africa Nanoemulsion in Food and Beverage Regional Analysis and Outlook
Chapter 9. North America Nanoemulsion in Food and Beverage Analysis and Outlook
9.1. North America Nanoemulsion in Food and Beverage Revenue (USD Million) by Segments (2021-2032)
9.1.1. North America Nanoemulsion in Food and Beverage Revenue (USD Million) by Type (2021-2032)
9.1.2. North America Nanoemulsion in Food and Beverage Revenue (USD Million) by Application (2021-2032)
9.1.3. North America Nanoemulsion in Food and Beverage Revenue (USD Million) by Product (2021-2032)
By Type
Small Molecule Surfactant
Protein-stabilized Emulsions
Others
By Application
Beverages
Dairy
Others
Chapter 10. Europe Nanoemulsion in Food and Beverage Analysis and Outlook
10.1. Europe Nanoemulsion in Food and Beverage Revenue (USD Million), by Segments (USD Million) (2021-2032)
10.1.1. Europe Nanoemulsion in Food and Beverage Revenue (USD Million) by Type (2021-2032)
10.1.2. Europe Nanoemulsion in Food and Beverage Revenue (USD Million) by Application (2021-2032)
10.1.3. Europe Nanoemulsion in Food and Beverage Revenue (USD Million) by Product (2021-2032)
By Type
Small Molecule Surfactant
Protein-stabilized Emulsions
Others
By Application
Beverages
Dairy
Others
Chapter 11. Asia Pacific Nanoemulsion in Food and Beverage Analysis and Outlook
11.1. Asia Pacific Nanoemulsion in Food and Beverage Revenue (USD Million), and Revenue (USD Million) by Segments (2021-2032)
11.1.1. Asia Pacific Nanoemulsion in Food and Beverage Revenue (USD Million) by Type (2021-2032)
11.1.2. Asia Pacific Nanoemulsion in Food and Beverage Revenue (USD Million) by Application (2021-2032)
11.1.3. Asia Pacific Nanoemulsion in Food and Beverage Revenue (USD Million) by Product (2021-2032)
By Type
Small Molecule Surfactant
Protein-stabilized Emulsions
Others
By Application
Beverages
Dairy
Others
Chapter 12. South America Nanoemulsion in Food and Beverage Analysis and Outlook
12.1. South America Nanoemulsion in Food and Beverage Revenue (USD Million), by Segments (2021-2032)
12.1.1. South America Nanoemulsion in Food and Beverage Revenue (USD Million) by Type (2021-2032)
12.1.2. South America Nanoemulsion in Food and Beverage Revenue (USD Million) by Application (2021-2032)
12.1.3. South America Nanoemulsion in Food and Beverage Revenue (USD Million) by Product (2021-2032)
By Type
Small Molecule Surfactant
Protein-stabilized Emulsions
Others
By Application
Beverages
Dairy
Others
Chapter 13. Middle East and Africa Nanoemulsion in Food and Beverage Analysis and Outlook
13.1. Middle East and Africa Nanoemulsion in Food and Beverage Revenue (USD Million), by Segments (2021-2032)
13.1.1. Middle East and Africa Nanoemulsion in Food and Beverage Revenue (USD Million) by Type (2021-2032)
13.1.2. Middle East and Africa Nanoemulsion in Food and Beverage Revenue (USD Million) by Application (2021-2032)
13.1.3. Middle East and Africa Nanoemulsion in Food and Beverage Revenue (USD Million) by Product (2021-2032)
By Type
Small Molecule Surfactant
Protein-stabilized Emulsions
Others
By Application
Beverages
Dairy
Others
Chapter 14. Nanoemulsion in Food and Beverage Company Profiles
14.1 Business Overview
14.2 Product Profiles
14.3 SWOT Profiles
14.5 Recent Developments
14.6 Financial Profile
List of Companies
Aquanova AG
DuPont Nutrition & Biosciences
Frutarom Industries Ltd
Jamba
Keystone Foods
Nestlé SA
Shemen Industries Ltd
The Kraft Heinz Company
Unilever Plc
Wild Flavors
15. Methodology and Data Sources
15.1 Customization Offerings
15.2 Subscription Services
15.3 Related Reports
15.4 Publisher Expertise
LIST OF TABLES
Table 1 Market Segmentation Analysis
Table 2 Global Nanoemulsion in Food and Beverage Market Share of Leading Companies, 2023
Table 3 Product Offerings of Leading Companies
Table 4 Low Growth Scenario Forecasts
Table 5 Reference Case Growth Scenario
Table 6 High Growth Case Scenario
Table 7 Global Nanoemulsion in Food and Beverage Revenue (USD Million) And CAGR (%) By Type (2021-2032)
Table 8 Global Nanoemulsion in Food and Beverage Revenue (USD Million) And CAGR (%) By Application (2021-2032)
Table 9 Global Nanoemulsion in Food and Beverage Revenue (USD Million) And CAGR (%) By Product (2021-2032)
Table 10 Global Nanoemulsion in Food and Beverage Market Revenue (USD Million) By Regions (2021-2032)
Table 11 Global Nanoemulsion in Food and Beverage Market Share (%) By Regions (2021-2032)
Table 12 North America Nanoemulsion in Food and Beverage Revenue (USD Million) By Country (2021-2032)
Table 13 Europe Nanoemulsion in Food and Beverage Revenue (USD Million) By Country (2021-2032)
Table 14 Asia Pacific Nanoemulsion in Food and Beverage Revenue (USD Million) By Country (2021-2032)
Table 15 South America Nanoemulsion in Food and Beverage Revenue (USD Million) By Country (2021-2032)
Table 16 Middle East and Africa Nanoemulsion in Food and Beverage Revenue (USD Million) By Region (2021-2032)
Table 17 North America Nanoemulsion in Food and Beverage Revenue (USD Million) By Type (2021-2032)
Table 18 North America Nanoemulsion in Food and Beverage Revenue (USD Million) By Application (2021-2032)
Table 19 North America Nanoemulsion in Food and Beverage Revenue (USD Million) By Product (2021-2032)
Table 20 Europe Nanoemulsion in Food and Beverage Revenue (USD Million) By Type (2021-2032)
Table 21 Europe Nanoemulsion in Food and Beverage Revenue (USD Million) By Application (2021-2032)
Table 22 Europe Nanoemulsion in Food and Beverage Revenue (USD Million) By Product (2021-2032)
Table 23 Asia Pacific Nanoemulsion in Food and Beverage Revenue (USD Million) By Type (2021-2032)
Table 24 Asia Pacific Nanoemulsion in Food and Beverage Revenue (USD Million) By Application (2021-2032)
Table 25 Asia Pacific Nanoemulsion in Food and Beverage Revenue (USD Million) By Product (2021-2032)
Table 26 South America Nanoemulsion in Food and Beverage Revenue (USD Million) By Type (2021-2032)
Table 27 South America Nanoemulsion in Food and Beverage Revenue (USD Million) By Application (2021-2032)
Table 28 South America Nanoemulsion in Food and Beverage Revenue (USD Million) By Product (2021-2032)
Table 29 Middle East and Africa Nanoemulsion in Food and Beverage Revenue (USD Million) By Type (2021-2032)
Table 30 Middle East and Africa Nanoemulsion in Food and Beverage Revenue (USD Million) By Application (2021-2032)
Table 31 Middle East and Africa Nanoemulsion in Food and Beverage Revenue (USD Million) By Product (2021-2032)
LIST OF FIGURES
Figure 1. Market Scope
Figure 2. Pricing Forecasts Per Unit, 2023- 2032
Figure 3. Porter’s Five Forces
Figure 4. Global Nanoemulsion in Food and Beverage Market Revenue (USD Million) By Regions (2021-2032)
Figure 5. Global Nanoemulsion in Food and Beverage Market Share (%) By Regions (2023)
Figure 6. North America Nanoemulsion in Food and Beverage Revenue (USD Million) By Country (2021-2032)
Figure 7. United States Nanoemulsion in Food and Beverage Revenue (USD Million) By Country (2021-2032)
Figure 8. Canada Nanoemulsion in Food and Beverage Revenue (USD Million) By Country (2021-2032)
Figure 9. Mexico Nanoemulsion in Food and Beverage Revenue (USD Million) By Country (2021-2032)
Figure 10. Europe Nanoemulsion in Food and Beverage Revenue (USD Million) By Country (2021-2032)
Figure 11. Germany Nanoemulsion in Food and Beverage Revenue (USD Million) By Country (2021-2032)
Figure 12. France Nanoemulsion in Food and Beverage Revenue (USD Million) By Country (2021-2032)
Figure 13. United Kingdom Nanoemulsion in Food and Beverage Revenue (USD Million) By Country (2021-2032)
Figure 14. Spain Nanoemulsion in Food and Beverage Revenue (USD Million) By Country (2021-2032)
Figure 15. Italy Nanoemulsion in Food and Beverage Revenue (USD Million) By Country (2021-2032)
Figure 16. Russia Nanoemulsion in Food and Beverage Revenue (USD Million) By Country (2021-2032)
Figure 17. Rest of Europe Nanoemulsion in Food and Beverage Revenue (USD Million) By Country (2021-2032)
Figure 11. Asia Pacific Nanoemulsion in Food and Beverage Revenue (USD Million) By Country (2021-2032)
Figure 12. China Nanoemulsion in Food and Beverage Revenue (USD Million) By Country (2021-2032)
Figure 13. Japan Nanoemulsion in Food and Beverage Revenue (USD Million) By Country (2021-2032)
Figure 14. India Nanoemulsion in Food and Beverage Revenue (USD Million) By Country (2021-2032)
Figure 15. South Korea Nanoemulsion in Food and Beverage Revenue (USD Million) By Country (2021-2032)
Figure 16. Australia Nanoemulsion in Food and Beverage Revenue (USD Million) By Country (2021-2032)
Figure 17. South East Asia Nanoemulsion in Food and Beverage Revenue (USD Million) By Country (2021-2032)
Figure 18. South America Nanoemulsion in Food and Beverage Revenue (USD Million) By Country (2021-2032)
Figure 19. Brazil Nanoemulsion in Food and Beverage Revenue (USD Million) By Country (2021-2032)
Figure 20. Argentina Nanoemulsion in Food and Beverage Revenue (USD Million) By Country (2021-2032)
Figure 21. Rest of Asia Pacific Nanoemulsion in Food and Beverage Revenue (USD Million) By Country (2021-2032)
Figure 22. Middle East and Africa Nanoemulsion in Food and Beverage Revenue (USD Million) By Region (2021-2032)
Figure 23. Saudi Arabia Nanoemulsion in Food and Beverage Revenue (USD Million) By Region (2021-2032)
Figure 24. The UAE Nanoemulsion in Food and Beverage Revenue (USD Million) By Region (2021-2032)
Figure 25. Rest of Middle East Nanoemulsion in Food and Beverage Revenue (USD Million) By Region (2021-2032)
Figure 26. South Africa Nanoemulsion in Food and Beverage Revenue (USD Million) By Region (2021-2032)
Figure 27. Africa Nanoemulsion in Food and Beverage Revenue (USD Million) By Region (2021-2032)
Figure 28. North America Nanoemulsion in Food and Beverage Revenue (USD Million) By Type (2021-2032)
Figure 29. North America Nanoemulsion in Food and Beverage Revenue (USD Million) By Application (2021-2032)
Figure 30. North America Nanoemulsion in Food and Beverage Revenue (USD Million) By Product (2021-2032)
Figure 31. Europe Nanoemulsion in Food and Beverage Revenue (USD Million) By Type (2021-2032)
Figure 32. Europe Nanoemulsion in Food and Beverage Revenue (USD Million) By Application (2021-2032)
Figure 33. Europe Nanoemulsion in Food and Beverage Revenue (USD Million) By Product (2021-2032)
Figure 34. Asia Pacific Nanoemulsion in Food and Beverage Revenue (USD Million) By Type (2021-2032)
Figure 35. Asia Pacific Nanoemulsion in Food and Beverage Revenue (USD Million) By Application (2021-2032)
Figure 36. Asia Pacific Nanoemulsion in Food and Beverage Revenue (USD Million) By Product (2021-2032)
Figure 37. South America Nanoemulsion in Food and Beverage Revenue (USD Million) By Type (2021-2032)
Figure 38. South America Nanoemulsion in Food and Beverage Revenue (USD Million) By Application (2021-2032)
Figure 39. South America Nanoemulsion in Food and Beverage Revenue (USD Million) By Product (2021-2032)
Figure 40. Middle East and Africa Nanoemulsion in Food and Beverage Revenue (USD Million) By Type (2021-2032)
Figure 41. Middle East and Africa Nanoemulsion in Food and Beverage Revenue (USD Million) By Application (2021-2032)
Figure 42. Middle East and Africa Nanoemulsion in Food and Beverage Revenue (USD Million) By Product (2021-2032)
By Type
Small Molecule Surfactant
Protein-stabilized Emulsions
Others
By Application
Beverages
Dairy
Others
Countries Analyzed
North America (US, Canada, Mexico)
Europe (Germany, UK, France, Spain, Italy, Russia, Rest of Europe)
Asia Pacific (China, India, Japan, South Korea, Australia, South East Asia, Rest of Asia)
South America (Brazil, Argentina, Rest of South America)
Middle East and Africa (Saudi Arabia, UAE, Rest of Middle East, South Africa, Egypt, Rest of Africa)
