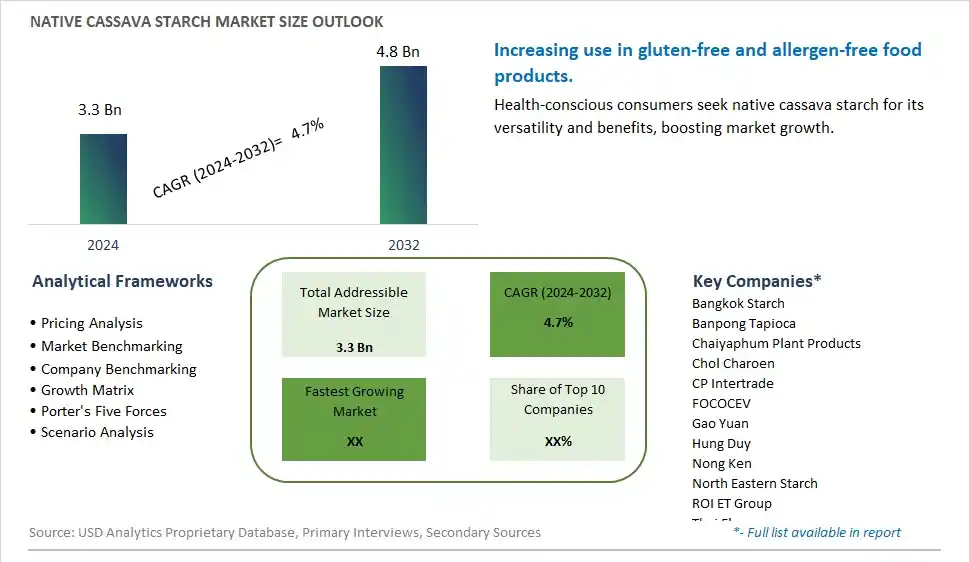
Global Native Cassava Starch Market Size is valued at $3.3 Billion in 2024 and is forecast to register a growth rate (CAGR) of 4.7% to reach $4.8 Billion by 2032.
The global Native Cassava Starch Market Comprehensive Study analyzes and forecasts the market size across 6 regions and 24 countries for diverse segments -By Type (Amylose, Pullulan), By Application (Industry, Food and Beverage, Others)
An Introduction to Native Cassava Starch Market
The native cassava starch market in 2024 is expanding rapidly, driven by the demand for natural and versatile starch ingredients in the food industry. Native cassava starch, derived from cassava roots, offers excellent thickening, gelling, and binding properties. The market benefits from innovations in cassava cultivation and starch extraction technologies that enhance product quality and sustainability. The trend towards clean label and natural ingredients is influencing product development. Increasing consumer interest in gluten-free and plant-based foods, supported by the popularity of traditional and ethnic cuisines, is further propelling market growth.
Native Cassava Starch Competitive Landscape
The market report analyses the leading companies in the industry including Bangkok Starch, Banpong Tapioca, Chaiyaphum Plant Products, Chol Charoen, CP Intertrade, FOCOCEV, Gao Yuan, Hung Duy, Nong Ken, North Eastern Starch, ROI ET Group, Thai Flour, Thai Wah, Thanawat Group, and Others.
Native Cassava Starch Market Dynamics
Native Cassava Starch Market Trend: Increasing Use in Gluten-Free Products
The most prominent trend in the Native Cassava Starch Market is the increasing use in gluten-free products. As consumers seek alternatives to traditional wheat flour, native cassava starch is gaining popularity in gluten-free baking and cooking applications due to its unique properties and versatility.
Native Cassava Starch Market Driver: Growth of the Gluten-Free Food Industry
A key driver in the Native Cassava Starch Market is the growth of the gluten-free food industry. As more individuals are diagnosed with celiac disease or choose to follow a gluten-free diet for health reasons, there is a rising demand for gluten-free ingredients like native cassava starch, supporting market expansion.
Native Cassava Starch Market Opportunity: Innovation in Food Applications
One significant opportunity in the Native Cassava Starch Market lies in innovation in food applications. Companies can develop new products that incorporate native cassava starch, such as gluten-free snacks, bread, and pasta, offering consumers diverse and high-quality options that cater to their dietary needs and preferences, driving market growth.
Native Cassava Starch Market Share Analysis- Largest Segment by Type
The Amylose type is the largest segment in the Native Cassava Starch Market. Amylose, known for its higher gel strength and thickening properties, is widely used across various industries, including food, pharmaceuticals, and textiles. Its versatility and effectiveness as a thickening agent and stabilizer make it a preferred choice in many applications. The substantial demand for amylose in processed foods and its functional benefits in product formulation contribute to its leading market position. Additionally, amylose's role in enhancing the texture and consistency of food products reinforces its dominance in the native cassava starch market.
Native Cassava Starch Market Share Analysis- Fastest Growing Segment by Application
The Food and Beverage application segment is projected to grow the fastest in the Native Cassava Starch Market. This growth is fueled by the increasing use of cassava starch as a natural and functional ingredient in various food and beverage products. The demand for clean-label and gluten-free ingredients is driving the adoption of native cassava starch in this sector. Its applications range from thickening agents and stabilizers to texturizers and moisture retainers in a wide array of food and beverage formulations. The rising trend towards healthier and more sustainable food options is expected to further accelerate the growth of native cassava starch in the food and beverage sector.
Native Cassava Starch Market Segmentation
By Type
Amylose
Pullulan
By Application
Industry
Food and Beverage
Others
Countries Analyzed
North America (US, Canada, Mexico)
Europe (Germany, UK, France, Spain, Italy, Russia, Rest of Europe)
Asia Pacific (China, India, Japan, South Korea, Australia, South East Asia, Rest of Asia)
South America (Brazil, Argentina, Rest of South America)
Middle East and Africa (Saudi Arabia, UAE, Rest of Middle East, South Africa, Egypt, Rest of Africa)
Native Cassava Starch Companies Profiled in the Study
Bangkok Starch
Banpong Tapioca
Chaiyaphum Plant Products
Chol Charoen
CP Intertrade
FOCOCEV
Gao Yuan
Hung Duy
Nong Ken
North Eastern Starch
ROI ET Group
Thai Flour
Thai Wah
Thanawat Group
*- List Not Exhaustive
Chapter 1. TABLE OF CONTENTS
Chapter 2. Introduction to Native Cassava Starch Market
2.1. Market Overview
2.2. Key Statistics and Report Highlights
2.3. Scope of the Comprehensive Study
2.3.1. Market Definition
2.3.2 Countries and Regions Covered
2.3.3 Research Objective
2.3.4 Units, Currency, and Conversions
2.3.5 Industry Value Chain
2.4. Key Market Segments
2.5. Key Companies
2.6. Study Period
Chapter 3. Strategic Analysis Review
3.1. Native Cassava Starch Pricing Analysis and Forecast
3.2. Porter’s Five Forces
3.3. Market Ecosystem
3.4. SWOT Analysis
3.5. Regulatory Scenario
3.3. Effects of Inflation, Russia-Ukraine War, moderating economic growth, and other macroeconomic factors
Chapter 4. Competitive Landscape
4.1. Market Share Analysis
4.1.1. Global Native Cassava Starch Market Share by Company, 2023
4.1.2. Product Offerings of Leading Native Cassava Starch Companies
4.2. Market Entropy
4.2.1. New Product Launches in the Industry
4.2.2. Mergers, Acquisitions, Joint ventures, and Partnerships
4.3. Key Strategies and Best Practices
Chapter 5. Global Market Projections: Best, Reference, and Low Case Scenarios
5.1. Growth Analysis- Case Scenario Definitions
5.2. Low Growth Case Scenario Forecasts
5.3. Reference Growth Case Scenario Forecasts
5.4. High Growth Case Scenario Forecasts
Chapter 6. Market Dynamics
6.1. Native Cassava Starch Market Drivers
6.2. Native Cassava Starch Market Challenges
6.6. Native Cassava Starch Market Opportunities
6.4. Native Cassava Starch Market Trends
Chapter 7. Global Native Cassava Starch Market Outlook Trends
7.1. Global Native Cassava Starch Revenue (USD Million) and CAGR (%) by Type (2021-2032)
7.2. Global Native Cassava Starch Revenue (USD Million) and CAGR (%) by Application (2021-2032)
7.3. Global Native Cassava Starch Revenue (USD Million) and CAGR (%) by Product (2021-2032)
By Type
Amylose
Pullulan
By Application
Industry
Food and Beverage
Others
Chapter 8. Global Native Cassava Starch Regional Analysis and Outlook
8.1. Global Native Cassava Starch Revenue (USD Million) By Regions (2021- 2032)
8.2. North America Native Cassava Starch Revenue (USD Million) by Country (2021-2032)
8.2.1. United States Native Cassava Starch Regional Analysis and Outlook
8.2.2. Canada Native Cassava Starch Regional Analysis and Outlook
8.2.3. Mexico Native Cassava Starch Regional Analysis and Outlook
8.3. Europe Native Cassava Starch Revenue (USD Million), by Country (2021-2032)
8.3.1. Germany Native Cassava Starch Regional Analysis and Outlook
8.3.2. France Native Cassava Starch Regional Analysis and Outlook
8.3.3. United Kingdom Native Cassava Starch Regional Analysis and Outlook
8.3.4. Spain Native Cassava Starch Regional Analysis and Outlook
8.3.5. Italy Native Cassava Starch Regional Analysis and Outlook
8.3.6. Russia Native Cassava Starch Regional Analysis and Outlook
8.3.7. Rest of Europe Native Cassava Starch Regional Analysis and Outlook
8.4. Asia Pacific Native Cassava Starch Revenue (USD Million) by Country (2021-2032)
8.4.1. China Native Cassava Starch Regional Analysis and Outlook
8.4.2. Japan Native Cassava Starch Regional Analysis and Outlook
8.4.3. India Native Cassava Starch Regional Analysis and Outlook
8.4.4. South Korea Native Cassava Starch Regional Analysis and Outlook
8.4.5. Australia Native Cassava Starch Regional Analysis and Outlook
8.4.6. South East Asia Native Cassava Starch Regional Analysis and Outlook
8.4.7. Rest of Asia Pacific Native Cassava Starch Regional Analysis and Outlook
8.5. South America Native Cassava Starch Revenue (USD Million), by Country (2021-2032)
8.5.1. Brazil Native Cassava Starch Regional Analysis and Outlook
8.5.2. Argentina Native Cassava Starch Regional Analysis and Outlook
8.5.3. Rest of South America Native Cassava Starch Regional Analysis and Outlook
8.6. Middle East and Africa Native Cassava Starch Revenue (USD Million) by Country (2021-2032)
8.6.1. Middle East Native Cassava Starch Regional Analysis and Outlook
8.6.2. Africa Native Cassava Starch Regional Analysis and Outlook
Chapter 9. North America Native Cassava Starch Analysis and Outlook
9.1. North America Native Cassava Starch Revenue (USD Million) by Segments (2021-2032)
9.1.1. North America Native Cassava Starch Revenue (USD Million) by Type (2021-2032)
9.1.2. North America Native Cassava Starch Revenue (USD Million) by Application (2021-2032)
9.1.3. North America Native Cassava Starch Revenue (USD Million) by Product (2021-2032)
By Type
Amylose
Pullulan
By Application
Industry
Food and Beverage
Others
Chapter 10. Europe Native Cassava Starch Analysis and Outlook
10.1. Europe Native Cassava Starch Revenue (USD Million), by Segments (USD Million) (2021-2032)
10.1.1. Europe Native Cassava Starch Revenue (USD Million) by Type (2021-2032)
10.1.2. Europe Native Cassava Starch Revenue (USD Million) by Application (2021-2032)
10.1.3. Europe Native Cassava Starch Revenue (USD Million) by Product (2021-2032)
By Type
Amylose
Pullulan
By Application
Industry
Food and Beverage
Others
Chapter 11. Asia Pacific Native Cassava Starch Analysis and Outlook
11.1. Asia Pacific Native Cassava Starch Revenue (USD Million), and Revenue (USD Million) by Segments (2021-2032)
11.1.1. Asia Pacific Native Cassava Starch Revenue (USD Million) by Type (2021-2032)
11.1.2. Asia Pacific Native Cassava Starch Revenue (USD Million) by Application (2021-2032)
11.1.3. Asia Pacific Native Cassava Starch Revenue (USD Million) by Product (2021-2032)
By Type
Amylose
Pullulan
By Application
Industry
Food and Beverage
Others
Chapter 12. South America Native Cassava Starch Analysis and Outlook
12.1. South America Native Cassava Starch Revenue (USD Million), by Segments (2021-2032)
12.1.1. South America Native Cassava Starch Revenue (USD Million) by Type (2021-2032)
12.1.2. South America Native Cassava Starch Revenue (USD Million) by Application (2021-2032)
12.1.3. South America Native Cassava Starch Revenue (USD Million) by Product (2021-2032)
By Type
Amylose
Pullulan
By Application
Industry
Food and Beverage
Others
Chapter 13. Middle East and Africa Native Cassava Starch Analysis and Outlook
13.1. Middle East and Africa Native Cassava Starch Revenue (USD Million), by Segments (2021-2032)
13.1.1. Middle East and Africa Native Cassava Starch Revenue (USD Million) by Type (2021-2032)
13.1.2. Middle East and Africa Native Cassava Starch Revenue (USD Million) by Application (2021-2032)
13.1.3. Middle East and Africa Native Cassava Starch Revenue (USD Million) by Product (2021-2032)
By Type
Amylose
Pullulan
By Application
Industry
Food and Beverage
Others
Chapter 14. Native Cassava Starch Company Profiles
14.1 Business Overview
14.2 Product Profiles
14.3 SWOT Profiles
14.5 Recent Developments
14.6 Financial Profile
List of Companies
Bangkok Starch
Banpong Tapioca
Chaiyaphum Plant Products
Chol Charoen
CP Intertrade
FOCOCEV
Gao Yuan
Hung Duy
Nong Ken
North Eastern Starch
ROI ET Group
Thai Flour
Thai Wah
Thanawat Group
15. Methodology and Data Sources
15.1 Customization Offerings
15.2 Subscription Services
15.3 Related Reports
15.4 Publisher Expertise
LIST OF TABLES
Table 1 Market Segmentation Analysis
Table 2 Global Native Cassava Starch Market Share of Leading Companies, 2023
Table 3 Product Offerings of Leading Companies
Table 4 Low Growth Scenario Forecasts
Table 5 Reference Case Growth Scenario
Table 6 High Growth Case Scenario
Table 7 Global Native Cassava Starch Revenue (USD Million) And CAGR (%) By Type (2021-2032)
Table 8 Global Native Cassava Starch Revenue (USD Million) And CAGR (%) By Application (2021-2032)
Table 9 Global Native Cassava Starch Revenue (USD Million) And CAGR (%) By Product (2021-2032)
Table 10 Global Native Cassava Starch Market Revenue (USD Million) By Regions (2021-2032)
Table 11 Global Native Cassava Starch Market Share (%) By Regions (2021-2032)
Table 12 North America Native Cassava Starch Revenue (USD Million) By Country (2021-2032)
Table 13 Europe Native Cassava Starch Revenue (USD Million) By Country (2021-2032)
Table 14 Asia Pacific Native Cassava Starch Revenue (USD Million) By Country (2021-2032)
Table 15 South America Native Cassava Starch Revenue (USD Million) By Country (2021-2032)
Table 16 Middle East and Africa Native Cassava Starch Revenue (USD Million) By Region (2021-2032)
Table 17 North America Native Cassava Starch Revenue (USD Million) By Type (2021-2032)
Table 18 North America Native Cassava Starch Revenue (USD Million) By Application (2021-2032)
Table 19 North America Native Cassava Starch Revenue (USD Million) By Product (2021-2032)
Table 20 Europe Native Cassava Starch Revenue (USD Million) By Type (2021-2032)
Table 21 Europe Native Cassava Starch Revenue (USD Million) By Application (2021-2032)
Table 22 Europe Native Cassava Starch Revenue (USD Million) By Product (2021-2032)
Table 23 Asia Pacific Native Cassava Starch Revenue (USD Million) By Type (2021-2032)
Table 24 Asia Pacific Native Cassava Starch Revenue (USD Million) By Application (2021-2032)
Table 25 Asia Pacific Native Cassava Starch Revenue (USD Million) By Product (2021-2032)
Table 26 South America Native Cassava Starch Revenue (USD Million) By Type (2021-2032)
Table 27 South America Native Cassava Starch Revenue (USD Million) By Application (2021-2032)
Table 28 South America Native Cassava Starch Revenue (USD Million) By Product (2021-2032)
Table 29 Middle East and Africa Native Cassava Starch Revenue (USD Million) By Type (2021-2032)
Table 30 Middle East and Africa Native Cassava Starch Revenue (USD Million) By Application (2021-2032)
Table 31 Middle East and Africa Native Cassava Starch Revenue (USD Million) By Product (2021-2032)
LIST OF FIGURES
Figure 1. Market Scope
Figure 2. Pricing Forecasts Per Unit, 2023- 2032
Figure 3. Porter’s Five Forces
Figure 4. Global Native Cassava Starch Market Revenue (USD Million) By Regions (2021-2032)
Figure 5. Global Native Cassava Starch Market Share (%) By Regions (2023)
Figure 6. North America Native Cassava Starch Revenue (USD Million) By Country (2021-2032)
Figure 7. United States Native Cassava Starch Revenue (USD Million) By Country (2021-2032)
Figure 8. Canada Native Cassava Starch Revenue (USD Million) By Country (2021-2032)
Figure 9. Mexico Native Cassava Starch Revenue (USD Million) By Country (2021-2032)
Figure 10. Europe Native Cassava Starch Revenue (USD Million) By Country (2021-2032)
Figure 11. Germany Native Cassava Starch Revenue (USD Million) By Country (2021-2032)
Figure 12. France Native Cassava Starch Revenue (USD Million) By Country (2021-2032)
Figure 13. United Kingdom Native Cassava Starch Revenue (USD Million) By Country (2021-2032)
Figure 14. Spain Native Cassava Starch Revenue (USD Million) By Country (2021-2032)
Figure 15. Italy Native Cassava Starch Revenue (USD Million) By Country (2021-2032)
Figure 16. Russia Native Cassava Starch Revenue (USD Million) By Country (2021-2032)
Figure 17. Rest of Europe Native Cassava Starch Revenue (USD Million) By Country (2021-2032)
Figure 11. Asia Pacific Native Cassava Starch Revenue (USD Million) By Country (2021-2032)
Figure 12. China Native Cassava Starch Revenue (USD Million) By Country (2021-2032)
Figure 13. Japan Native Cassava Starch Revenue (USD Million) By Country (2021-2032)
Figure 14. India Native Cassava Starch Revenue (USD Million) By Country (2021-2032)
Figure 15. South Korea Native Cassava Starch Revenue (USD Million) By Country (2021-2032)
Figure 16. Australia Native Cassava Starch Revenue (USD Million) By Country (2021-2032)
Figure 17. South East Asia Native Cassava Starch Revenue (USD Million) By Country (2021-2032)
Figure 18. South America Native Cassava Starch Revenue (USD Million) By Country (2021-2032)
Figure 19. Brazil Native Cassava Starch Revenue (USD Million) By Country (2021-2032)
Figure 20. Argentina Native Cassava Starch Revenue (USD Million) By Country (2021-2032)
Figure 21. Rest of Asia Pacific Native Cassava Starch Revenue (USD Million) By Country (2021-2032)
Figure 22. Middle East and Africa Native Cassava Starch Revenue (USD Million) By Region (2021-2032)
Figure 23. Saudi Arabia Native Cassava Starch Revenue (USD Million) By Region (2021-2032)
Figure 24. The UAE Native Cassava Starch Revenue (USD Million) By Region (2021-2032)
Figure 25. Rest of Middle East Native Cassava Starch Revenue (USD Million) By Region (2021-2032)
Figure 26. South Africa Native Cassava Starch Revenue (USD Million) By Region (2021-2032)
Figure 27. Africa Native Cassava Starch Revenue (USD Million) By Region (2021-2032)
Figure 28. North America Native Cassava Starch Revenue (USD Million) By Type (2021-2032)
Figure 29. North America Native Cassava Starch Revenue (USD Million) By Application (2021-2032)
Figure 30. North America Native Cassava Starch Revenue (USD Million) By Product (2021-2032)
Figure 31. Europe Native Cassava Starch Revenue (USD Million) By Type (2021-2032)
Figure 32. Europe Native Cassava Starch Revenue (USD Million) By Application (2021-2032)
Figure 33. Europe Native Cassava Starch Revenue (USD Million) By Product (2021-2032)
Figure 34. Asia Pacific Native Cassava Starch Revenue (USD Million) By Type (2021-2032)
Figure 35. Asia Pacific Native Cassava Starch Revenue (USD Million) By Application (2021-2032)
Figure 36. Asia Pacific Native Cassava Starch Revenue (USD Million) By Product (2021-2032)
Figure 37. South America Native Cassava Starch Revenue (USD Million) By Type (2021-2032)
Figure 38. South America Native Cassava Starch Revenue (USD Million) By Application (2021-2032)
Figure 39. South America Native Cassava Starch Revenue (USD Million) By Product (2021-2032)
Figure 40. Middle East and Africa Native Cassava Starch Revenue (USD Million) By Type (2021-2032)
Figure 41. Middle East and Africa Native Cassava Starch Revenue (USD Million) By Application (2021-2032)
Figure 42. Middle East and Africa Native Cassava Starch Revenue (USD Million) By Product (2021-2032)
By Type
Amylose
Pullulan
By Application
Industry
Food and Beverage
Others
Countries Analyzed
North America (US, Canada, Mexico)
Europe (Germany, UK, France, Spain, Italy, Russia, Rest of Europe)
Asia Pacific (China, India, Japan, South Korea, Australia, South East Asia, Rest of Asia)
South America (Brazil, Argentina, Rest of South America)
Middle East and Africa (Saudi Arabia, UAE, Rest of Middle East, South Africa, Egypt, Rest of Africa)
