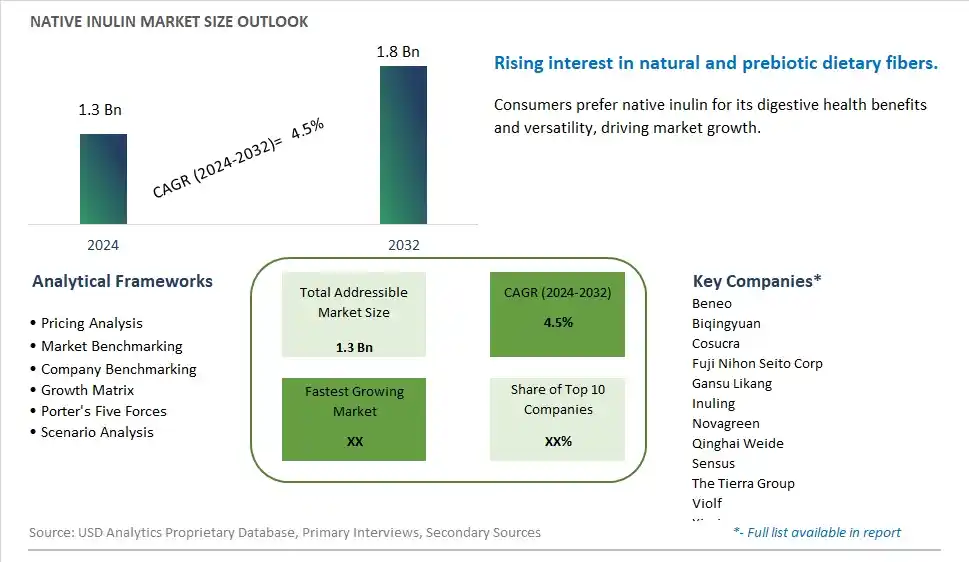
Global Native Inulin Market Size is valued at $1.3 Billion in 2024 and is forecast to register a growth rate (CAGR) of 4.5% to reach $1.8 Billion by 2032.
The global Native Inulin Market Comprehensive Study analyzes and forecasts the market size across 6 regions and 24 countries for diverse segments -By Type (Chicory Roots Inulin, Artichoke Inulin, Others), By Application (Bakery and Confectionary, Food and Beverages, Nutrition Supplements, Others)
An Introduction to Native Inulin Market
In 2024, the native inulin market is thriving, fueled by the demand for natural prebiotic fibers that support digestive health. Native inulin, derived from chicory roots and other plants, is used in various food and beverage applications for its health benefits and functional properties. The market benefits from advancements in extraction and processing technologies that enhance product purity and efficacy. The trend towards clean label and natural ingredients is influencing product development. Increasing consumer interest in gut health and the popularity of functional foods are further supporting market growth.
Native Inulin Competitive Landscape
The market report analyses the leading companies in the industry including Beneo, Biqingyuan, Cosucra, Fuji Nihon Seito Corp, Gansu Likang, Inuling, Novagreen, Qinghai Weide, Sensus, The Tierra Group, Violf, Xirui, and Others.
Native Inulin Market Dynamics
Native Inulin Market Trend: Increasing Use as a Prebiotic Fiber
The most prominent trend in the Native Inulin Market is the increasing use as a prebiotic fiber. Native inulin, known for its ability to promote gut health, is being incorporated into a variety of food and beverage products, driven by consumer demand for functional ingredients that support digestive wellness.
Native Inulin Market Driver: Health Consciousness and Demand for Functional Foods
A key driver in the Native Inulin Market is health consciousness and the demand for functional foods. As more individuals focus on improving their digestive health and overall well-being, there is a growing demand for prebiotic fibers like native inulin that offer multiple health benefits, supporting market growth.
Native Inulin Market Opportunity: Expansion into Dietary Supplements
One significant opportunity in the Native Inulin Market lies in the expansion into dietary supplements. Companies can innovate by creating inulin-based supplements that cater to specific health needs, such as gut health, weight management, and blood sugar control, offering convenient and effective solutions that attract health-conscious consumers and drive market growth.
Native Inulin Market Share Analysis- Largest Segment by Type
The Chicory Roots Inulin segment is the largest in the Native Inulin Market. Chicory root is the primary source of inulin due to its high concentration of this soluble fiber, which offers numerous health benefits, such as improving digestive health and supporting weight management. The widespread cultivation of chicory roots and the established extraction processes contribute to its dominance in the market. Chicory roots inulin's extensive use in dietary supplements, functional foods, and prebiotic applications reinforces its leading position. Its market leadership is supported by its cost-effectiveness and well-documented health benefits compared to other sources of inulin.
Native Inulin Market Share Analysis- Fastest Growing Segment by Application
The Nutrition Supplements application segment is poised to grow the fastest in the Native Inulin Market. The rising consumer awareness of digestive health and overall wellness is driving the demand for inulin as a prebiotic fiber in dietary supplements. Inulin's ability to promote gut health, support immune function, and contribute to weight management makes it a sought-after ingredient in nutritional products. The increasing popularity of functional and health-focused supplements, combined with growing consumer preference for natural and plant-based ingredients, is accelerating the growth of native inulin in the nutrition supplements sector.
Native Inulin Market Segmentation
By Type
Chicory Roots Inulin
Artichoke Inulin
Others
By Application
Bakery and Confectionary
Food and Beverages
Nutrition Supplements
Others
Countries Analyzed
North America (US, Canada, Mexico)
Europe (Germany, UK, France, Spain, Italy, Russia, Rest of Europe)
Asia Pacific (China, India, Japan, South Korea, Australia, South East Asia, Rest of Asia)
South America (Brazil, Argentina, Rest of South America)
Middle East and Africa (Saudi Arabia, UAE, Rest of Middle East, South Africa, Egypt, Rest of Africa)
Native Inulin Companies Profiled in the Study
Beneo
Biqingyuan
Cosucra
Fuji Nihon Seito Corp
Gansu Likang
Inuling
Novagreen
Qinghai Weide
Sensus
The Tierra Group
Violf
Xirui
*- List Not Exhaustive
Chapter 1. TABLE OF CONTENTS
Chapter 2. Introduction to Native Inulin Market
2.1. Market Overview
2.2. Key Statistics and Report Highlights
2.3. Scope of the Comprehensive Study
2.3.1. Market Definition
2.3.2 Countries and Regions Covered
2.3.3 Research Objective
2.3.4 Units, Currency, and Conversions
2.3.5 Industry Value Chain
2.4. Key Market Segments
2.5. Key Companies
2.6. Study Period
Chapter 3. Strategic Analysis Review
3.1. Native Inulin Pricing Analysis and Forecast
3.2. Porter’s Five Forces
3.3. Market Ecosystem
3.4. SWOT Analysis
3.5. Regulatory Scenario
3.3. Effects of Inflation, Russia-Ukraine War, moderating economic growth, and other macroeconomic factors
Chapter 4. Competitive Landscape
4.1. Market Share Analysis
4.1.1. Global Native Inulin Market Share by Company, 2023
4.1.2. Product Offerings of Leading Native Inulin Companies
4.2. Market Entropy
4.2.1. New Product Launches in the Industry
4.2.2. Mergers, Acquisitions, Joint ventures, and Partnerships
4.3. Key Strategies and Best Practices
Chapter 5. Global Market Projections: Best, Reference, and Low Case Scenarios
5.1. Growth Analysis- Case Scenario Definitions
5.2. Low Growth Case Scenario Forecasts
5.3. Reference Growth Case Scenario Forecasts
5.4. High Growth Case Scenario Forecasts
Chapter 6. Market Dynamics
6.1. Native Inulin Market Drivers
6.2. Native Inulin Market Challenges
6.6. Native Inulin Market Opportunities
6.4. Native Inulin Market Trends
Chapter 7. Global Native Inulin Market Outlook Trends
7.1. Global Native Inulin Revenue (USD Million) and CAGR (%) by Type (2021-2032)
7.2. Global Native Inulin Revenue (USD Million) and CAGR (%) by Application (2021-2032)
7.3. Global Native Inulin Revenue (USD Million) and CAGR (%) by Product (2021-2032)
By Type
Chicory Roots Inulin
Artichoke Inulin
Others
By Application
Bakery and Confectionary
Food and Beverages
Nutrition Supplements
Others
Chapter 8. Global Native Inulin Regional Analysis and Outlook
8.1. Global Native Inulin Revenue (USD Million) By Regions (2021- 2032)
8.2. North America Native Inulin Revenue (USD Million) by Country (2021-2032)
8.2.1. United States Native Inulin Regional Analysis and Outlook
8.2.2. Canada Native Inulin Regional Analysis and Outlook
8.2.3. Mexico Native Inulin Regional Analysis and Outlook
8.3. Europe Native Inulin Revenue (USD Million), by Country (2021-2032)
8.3.1. Germany Native Inulin Regional Analysis and Outlook
8.3.2. France Native Inulin Regional Analysis and Outlook
8.3.3. United Kingdom Native Inulin Regional Analysis and Outlook
8.3.4. Spain Native Inulin Regional Analysis and Outlook
8.3.5. Italy Native Inulin Regional Analysis and Outlook
8.3.6. Russia Native Inulin Regional Analysis and Outlook
8.3.7. Rest of Europe Native Inulin Regional Analysis and Outlook
8.4. Asia Pacific Native Inulin Revenue (USD Million) by Country (2021-2032)
8.4.1. China Native Inulin Regional Analysis and Outlook
8.4.2. Japan Native Inulin Regional Analysis and Outlook
8.4.3. India Native Inulin Regional Analysis and Outlook
8.4.4. South Korea Native Inulin Regional Analysis and Outlook
8.4.5. Australia Native Inulin Regional Analysis and Outlook
8.4.6. South East Asia Native Inulin Regional Analysis and Outlook
8.4.7. Rest of Asia Pacific Native Inulin Regional Analysis and Outlook
8.5. South America Native Inulin Revenue (USD Million), by Country (2021-2032)
8.5.1. Brazil Native Inulin Regional Analysis and Outlook
8.5.2. Argentina Native Inulin Regional Analysis and Outlook
8.5.3. Rest of South America Native Inulin Regional Analysis and Outlook
8.6. Middle East and Africa Native Inulin Revenue (USD Million) by Country (2021-2032)
8.6.1. Middle East Native Inulin Regional Analysis and Outlook
8.6.2. Africa Native Inulin Regional Analysis and Outlook
Chapter 9. North America Native Inulin Analysis and Outlook
9.1. North America Native Inulin Revenue (USD Million) by Segments (2021-2032)
9.1.1. North America Native Inulin Revenue (USD Million) by Type (2021-2032)
9.1.2. North America Native Inulin Revenue (USD Million) by Application (2021-2032)
9.1.3. North America Native Inulin Revenue (USD Million) by Product (2021-2032)
By Type
Chicory Roots Inulin
Artichoke Inulin
Others
By Application
Bakery and Confectionary
Food and Beverages
Nutrition Supplements
Others
Chapter 10. Europe Native Inulin Analysis and Outlook
10.1. Europe Native Inulin Revenue (USD Million), by Segments (USD Million) (2021-2032)
10.1.1. Europe Native Inulin Revenue (USD Million) by Type (2021-2032)
10.1.2. Europe Native Inulin Revenue (USD Million) by Application (2021-2032)
10.1.3. Europe Native Inulin Revenue (USD Million) by Product (2021-2032)
By Type
Chicory Roots Inulin
Artichoke Inulin
Others
By Application
Bakery and Confectionary
Food and Beverages
Nutrition Supplements
Others
Chapter 11. Asia Pacific Native Inulin Analysis and Outlook
11.1. Asia Pacific Native Inulin Revenue (USD Million), and Revenue (USD Million) by Segments (2021-2032)
11.1.1. Asia Pacific Native Inulin Revenue (USD Million) by Type (2021-2032)
11.1.2. Asia Pacific Native Inulin Revenue (USD Million) by Application (2021-2032)
11.1.3. Asia Pacific Native Inulin Revenue (USD Million) by Product (2021-2032)
By Type
Chicory Roots Inulin
Artichoke Inulin
Others
By Application
Bakery and Confectionary
Food and Beverages
Nutrition Supplements
Others
Chapter 12. South America Native Inulin Analysis and Outlook
12.1. South America Native Inulin Revenue (USD Million), by Segments (2021-2032)
12.1.1. South America Native Inulin Revenue (USD Million) by Type (2021-2032)
12.1.2. South America Native Inulin Revenue (USD Million) by Application (2021-2032)
12.1.3. South America Native Inulin Revenue (USD Million) by Product (2021-2032)
By Type
Chicory Roots Inulin
Artichoke Inulin
Others
By Application
Bakery and Confectionary
Food and Beverages
Nutrition Supplements
Others
Chapter 13. Middle East and Africa Native Inulin Analysis and Outlook
13.1. Middle East and Africa Native Inulin Revenue (USD Million), by Segments (2021-2032)
13.1.1. Middle East and Africa Native Inulin Revenue (USD Million) by Type (2021-2032)
13.1.2. Middle East and Africa Native Inulin Revenue (USD Million) by Application (2021-2032)
13.1.3. Middle East and Africa Native Inulin Revenue (USD Million) by Product (2021-2032)
By Type
Chicory Roots Inulin
Artichoke Inulin
Others
By Application
Bakery and Confectionary
Food and Beverages
Nutrition Supplements
Others
Chapter 14. Native Inulin Company Profiles
14.1 Business Overview
14.2 Product Profiles
14.3 SWOT Profiles
14.5 Recent Developments
14.6 Financial Profile
List of Companies
Beneo
Biqingyuan
Cosucra
Fuji Nihon Seito Corp
Gansu Likang
Inuling
Novagreen
Qinghai Weide
Sensus
The Tierra Group
Violf
Xirui
15. Methodology and Data Sources
15.1 Customization Offerings
15.2 Subscription Services
15.3 Related Reports
15.4 Publisher Expertise
LIST OF TABLES
Table 1 Market Segmentation Analysis
Table 2 Global Native Inulin Market Share of Leading Companies, 2023
Table 3 Product Offerings of Leading Companies
Table 4 Low Growth Scenario Forecasts
Table 5 Reference Case Growth Scenario
Table 6 High Growth Case Scenario
Table 7 Global Native Inulin Revenue (USD Million) And CAGR (%) By Type (2021-2032)
Table 8 Global Native Inulin Revenue (USD Million) And CAGR (%) By Application (2021-2032)
Table 9 Global Native Inulin Revenue (USD Million) And CAGR (%) By Product (2021-2032)
Table 10 Global Native Inulin Market Revenue (USD Million) By Regions (2021-2032)
Table 11 Global Native Inulin Market Share (%) By Regions (2021-2032)
Table 12 North America Native Inulin Revenue (USD Million) By Country (2021-2032)
Table 13 Europe Native Inulin Revenue (USD Million) By Country (2021-2032)
Table 14 Asia Pacific Native Inulin Revenue (USD Million) By Country (2021-2032)
Table 15 South America Native Inulin Revenue (USD Million) By Country (2021-2032)
Table 16 Middle East and Africa Native Inulin Revenue (USD Million) By Region (2021-2032)
Table 17 North America Native Inulin Revenue (USD Million) By Type (2021-2032)
Table 18 North America Native Inulin Revenue (USD Million) By Application (2021-2032)
Table 19 North America Native Inulin Revenue (USD Million) By Product (2021-2032)
Table 20 Europe Native Inulin Revenue (USD Million) By Type (2021-2032)
Table 21 Europe Native Inulin Revenue (USD Million) By Application (2021-2032)
Table 22 Europe Native Inulin Revenue (USD Million) By Product (2021-2032)
Table 23 Asia Pacific Native Inulin Revenue (USD Million) By Type (2021-2032)
Table 24 Asia Pacific Native Inulin Revenue (USD Million) By Application (2021-2032)
Table 25 Asia Pacific Native Inulin Revenue (USD Million) By Product (2021-2032)
Table 26 South America Native Inulin Revenue (USD Million) By Type (2021-2032)
Table 27 South America Native Inulin Revenue (USD Million) By Application (2021-2032)
Table 28 South America Native Inulin Revenue (USD Million) By Product (2021-2032)
Table 29 Middle East and Africa Native Inulin Revenue (USD Million) By Type (2021-2032)
Table 30 Middle East and Africa Native Inulin Revenue (USD Million) By Application (2021-2032)
Table 31 Middle East and Africa Native Inulin Revenue (USD Million) By Product (2021-2032)
LIST OF FIGURES
Figure 1. Market Scope
Figure 2. Pricing Forecasts Per Unit, 2023- 2032
Figure 3. Porter’s Five Forces
Figure 4. Global Native Inulin Market Revenue (USD Million) By Regions (2021-2032)
Figure 5. Global Native Inulin Market Share (%) By Regions (2023)
Figure 6. North America Native Inulin Revenue (USD Million) By Country (2021-2032)
Figure 7. United States Native Inulin Revenue (USD Million) By Country (2021-2032)
Figure 8. Canada Native Inulin Revenue (USD Million) By Country (2021-2032)
Figure 9. Mexico Native Inulin Revenue (USD Million) By Country (2021-2032)
Figure 10. Europe Native Inulin Revenue (USD Million) By Country (2021-2032)
Figure 11. Germany Native Inulin Revenue (USD Million) By Country (2021-2032)
Figure 12. France Native Inulin Revenue (USD Million) By Country (2021-2032)
Figure 13. United Kingdom Native Inulin Revenue (USD Million) By Country (2021-2032)
Figure 14. Spain Native Inulin Revenue (USD Million) By Country (2021-2032)
Figure 15. Italy Native Inulin Revenue (USD Million) By Country (2021-2032)
Figure 16. Russia Native Inulin Revenue (USD Million) By Country (2021-2032)
Figure 17. Rest of Europe Native Inulin Revenue (USD Million) By Country (2021-2032)
Figure 11. Asia Pacific Native Inulin Revenue (USD Million) By Country (2021-2032)
Figure 12. China Native Inulin Revenue (USD Million) By Country (2021-2032)
Figure 13. Japan Native Inulin Revenue (USD Million) By Country (2021-2032)
Figure 14. India Native Inulin Revenue (USD Million) By Country (2021-2032)
Figure 15. South Korea Native Inulin Revenue (USD Million) By Country (2021-2032)
Figure 16. Australia Native Inulin Revenue (USD Million) By Country (2021-2032)
Figure 17. South East Asia Native Inulin Revenue (USD Million) By Country (2021-2032)
Figure 18. South America Native Inulin Revenue (USD Million) By Country (2021-2032)
Figure 19. Brazil Native Inulin Revenue (USD Million) By Country (2021-2032)
Figure 20. Argentina Native Inulin Revenue (USD Million) By Country (2021-2032)
Figure 21. Rest of Asia Pacific Native Inulin Revenue (USD Million) By Country (2021-2032)
Figure 22. Middle East and Africa Native Inulin Revenue (USD Million) By Region (2021-2032)
Figure 23. Saudi Arabia Native Inulin Revenue (USD Million) By Region (2021-2032)
Figure 24. The UAE Native Inulin Revenue (USD Million) By Region (2021-2032)
Figure 25. Rest of Middle East Native Inulin Revenue (USD Million) By Region (2021-2032)
Figure 26. South Africa Native Inulin Revenue (USD Million) By Region (2021-2032)
Figure 27. Africa Native Inulin Revenue (USD Million) By Region (2021-2032)
Figure 28. North America Native Inulin Revenue (USD Million) By Type (2021-2032)
Figure 29. North America Native Inulin Revenue (USD Million) By Application (2021-2032)
Figure 30. North America Native Inulin Revenue (USD Million) By Product (2021-2032)
Figure 31. Europe Native Inulin Revenue (USD Million) By Type (2021-2032)
Figure 32. Europe Native Inulin Revenue (USD Million) By Application (2021-2032)
Figure 33. Europe Native Inulin Revenue (USD Million) By Product (2021-2032)
Figure 34. Asia Pacific Native Inulin Revenue (USD Million) By Type (2021-2032)
Figure 35. Asia Pacific Native Inulin Revenue (USD Million) By Application (2021-2032)
Figure 36. Asia Pacific Native Inulin Revenue (USD Million) By Product (2021-2032)
Figure 37. South America Native Inulin Revenue (USD Million) By Type (2021-2032)
Figure 38. South America Native Inulin Revenue (USD Million) By Application (2021-2032)
Figure 39. South America Native Inulin Revenue (USD Million) By Product (2021-2032)
Figure 40. Middle East and Africa Native Inulin Revenue (USD Million) By Type (2021-2032)
Figure 41. Middle East and Africa Native Inulin Revenue (USD Million) By Application (2021-2032)
Figure 42. Middle East and Africa Native Inulin Revenue (USD Million) By Product (2021-2032)
By Type
Chicory Roots Inulin
Artichoke Inulin
Others
By Application
Bakery and Confectionary
Food and Beverages
Nutrition Supplements
Others
Countries Analyzed
North America (US, Canada, Mexico)
Europe (Germany, UK, France, Spain, Italy, Russia, Rest of Europe)
Asia Pacific (China, India, Japan, South Korea, Australia, South East Asia, Rest of Asia)
South America (Brazil, Argentina, Rest of South America)
Middle East and Africa (Saudi Arabia, UAE, Rest of Middle East, South Africa, Egypt, Rest of Africa)
