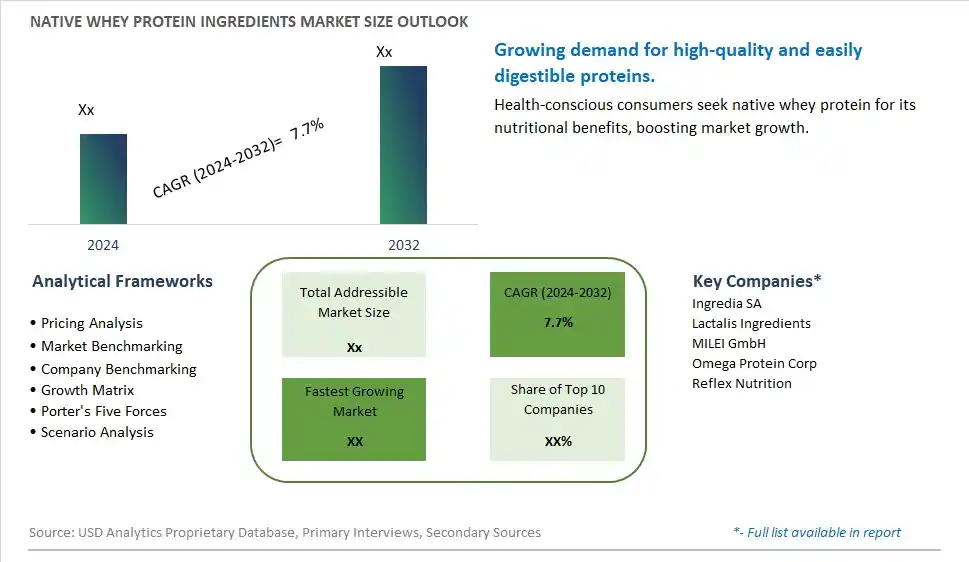
Global Native Whey Protein Ingredients Market Size is valued at $XX Million in 2024 and is forecast to register a growth rate (CAGR) of 7.7% to reach $XX Million by 2032.
The global Native Whey Protein Ingredients Market Comprehensive Study analyzes and forecasts the market size across 6 regions and 24 countries for diverse segments -By Type (Concentrate Form, Isolate Form), By Application (Protein-Enriched Beverages, Protein or Energy Bars, Infant Formulas, Clinical Nutrition, Dairy, Bakery, Supplements, Meat, Others)
An Introduction to Native Whey Protein Ingredients Market
The native whey protein ingredients market in 2024 is expanding rapidly, driven by the demand for high-quality, bioactive protein supplements. Native whey protein, sourced directly from milk and minimally processed, offers superior nutritional benefits and functional properties. The market benefits from innovations in whey protein extraction and processing technologies that enhance product purity and efficacy. The trend towards clean label and natural ingredients is influencing product development. Increasing consumer interest in sports nutrition, weight management, and functional foods is further propelling market growth for native whey protein ingredients.
Native Whey Protein Ingredients Competitive Landscape
The market report analyses the leading companies in the industry including Ingredia SA, Lactalis Ingredients, MILEI GmbH, Omega Protein Corp, Reflex Nutrition, and Others.
Native Whey Protein Ingredients Market Dynamics
Native Whey Protein Ingredients Market Trend: Rising Demand for Clean Label Ingredients
The most prominent trend in the Native Whey Protein Ingredients Market is the rising demand for clean label ingredients. Native whey protein, known for its minimal processing and natural sourcing, is increasingly used in health and fitness products, driven by consumer preference for clean and transparent labeling.
Native Whey Protein Ingredients Market Driver: Growth of the Sports Nutrition Industry
A key driver in the Native Whey Protein Ingredients Market is the growth of the sports nutrition industry. As more individuals engage in fitness and sports activities, there is a rising demand for high-quality protein supplements that support muscle growth and recovery, boosting the market for native whey protein ingredients.
Native Whey Protein Ingredients Market Opportunity: Innovation in Protein-Enhanced Foods
One significant opportunity in the Native Whey Protein Ingredients Market lies in innovation in protein-enhanced foods. Companies can develop new products that incorporate native whey protein, such as protein bars, shakes, and baked goods, offering consumers convenient and nutritious options that cater to their active lifestyles and dietary preferences, driving market growth.
Native Whey Protein Ingredients Market Share Analysis- Largest Segment by Type
The Concentrate Form of native whey protein ingredients is the largest segment in the Native Whey Protein Ingredients Market. Whey protein concentrate is favored for its cost-effectiveness and balanced protein content, making it a popular choice among manufacturers for a wide range of applications. Its versatility in formulating protein-enriched products and its role in enhancing flavor and texture contribute to its market dominance. Concentrates are widely used in sports nutrition, dietary supplements, and functional foods, reinforcing their leading position in the market compared to isolates, which are more expensive and used in more specialized applications.
Native Whey Protein Ingredients Market Share Analysis- Fastest Growing Segment by Application
The Protein-Enriched Beverages application segment is expected to grow the fastest in the Native Whey Protein Ingredients Market. The increasing demand for convenient, on-the-go nutritional options and the rising trend of functional beverages are driving this growth. Protein-enriched beverages cater to health-conscious consumers seeking to boost their protein intake for fitness, weight management, and overall wellness. The expansion of the beverage sector and innovations in protein formulations are fueling the rapid adoption of native whey protein in this category. Additionally, advancements in beverage technology that enhance protein stability and solubility further support this segment's growth.
Native Whey Protein Ingredients Market Segmentation
By Type
Concentrate Form
Isolate Form
By Application
Protein-Enriched Beverages
Protein or Energy Bars
Infant Formulas
Clinical Nutrition
Dairy
Bakery
Supplements
Meat
Others
Countries Analyzed
North America (US, Canada, Mexico)
Europe (Germany, UK, France, Spain, Italy, Russia, Rest of Europe)
Asia Pacific (China, India, Japan, South Korea, Australia, South East Asia, Rest of Asia)
South America (Brazil, Argentina, Rest of South America)
Middle East and Africa (Saudi Arabia, UAE, Rest of Middle East, South Africa, Egypt, Rest of Africa)
Native Whey Protein Ingredients Companies Profiled in the Study
Ingredia SA
Lactalis Ingredients
MILEI GmbH
Omega Protein Corp
Reflex Nutrition
*- List Not Exhaustive
Chapter 1. TABLE OF CONTENTS
Chapter 2. Introduction to Native Whey Protein Ingredients Market
2.1. Market Overview
2.2. Key Statistics and Report Highlights
2.3. Scope of the Comprehensive Study
2.3.1. Market Definition
2.3.2 Countries and Regions Covered
2.3.3 Research Objective
2.3.4 Units, Currency, and Conversions
2.3.5 Industry Value Chain
2.4. Key Market Segments
2.5. Key Companies
2.6. Study Period
Chapter 3. Strategic Analysis Review
3.1. Native Whey Protein Ingredients Pricing Analysis and Forecast
3.2. Porter’s Five Forces
3.3. Market Ecosystem
3.4. SWOT Analysis
3.5. Regulatory Scenario
3.3. Effects of Inflation, Russia-Ukraine War, moderating economic growth, and other macroeconomic factors
Chapter 4. Competitive Landscape
4.1. Market Share Analysis
4.1.1. Global Native Whey Protein Ingredients Market Share by Company, 2023
4.1.2. Product Offerings of Leading Native Whey Protein Ingredients Companies
4.2. Market Entropy
4.2.1. New Product Launches in the Industry
4.2.2. Mergers, Acquisitions, Joint ventures, and Partnerships
4.3. Key Strategies and Best Practices
Chapter 5. Global Market Projections: Best, Reference, and Low Case Scenarios
5.1. Growth Analysis- Case Scenario Definitions
5.2. Low Growth Case Scenario Forecasts
5.3. Reference Growth Case Scenario Forecasts
5.4. High Growth Case Scenario Forecasts
Chapter 6. Market Dynamics
6.1. Native Whey Protein Ingredients Market Drivers
6.2. Native Whey Protein Ingredients Market Challenges
6.6. Native Whey Protein Ingredients Market Opportunities
6.4. Native Whey Protein Ingredients Market Trends
Chapter 7. Global Native Whey Protein Ingredients Market Outlook Trends
7.1. Global Native Whey Protein Ingredients Revenue (USD Million) and CAGR (%) by Type (2021-2032)
7.2. Global Native Whey Protein Ingredients Revenue (USD Million) and CAGR (%) by Application (2021-2032)
7.3. Global Native Whey Protein Ingredients Revenue (USD Million) and CAGR (%) by Product (2021-2032)
By Type
Concentrate Form
Isolate Form
By Application
Protein-Enriched Beverages
Protein or Energy Bars
Infant Formulas
Clinical Nutrition
Dairy
Bakery
Supplements
Meat
Others
Chapter 8. Global Native Whey Protein Ingredients Regional Analysis and Outlook
8.1. Global Native Whey Protein Ingredients Revenue (USD Million) By Regions (2021- 2032)
8.2. North America Native Whey Protein Ingredients Revenue (USD Million) by Country (2021-2032)
8.2.1. United States Native Whey Protein Ingredients Regional Analysis and Outlook
8.2.2. Canada Native Whey Protein Ingredients Regional Analysis and Outlook
8.2.3. Mexico Native Whey Protein Ingredients Regional Analysis and Outlook
8.3. Europe Native Whey Protein Ingredients Revenue (USD Million), by Country (2021-2032)
8.3.1. Germany Native Whey Protein Ingredients Regional Analysis and Outlook
8.3.2. France Native Whey Protein Ingredients Regional Analysis and Outlook
8.3.3. United Kingdom Native Whey Protein Ingredients Regional Analysis and Outlook
8.3.4. Spain Native Whey Protein Ingredients Regional Analysis and Outlook
8.3.5. Italy Native Whey Protein Ingredients Regional Analysis and Outlook
8.3.6. Russia Native Whey Protein Ingredients Regional Analysis and Outlook
8.3.7. Rest of Europe Native Whey Protein Ingredients Regional Analysis and Outlook
8.4. Asia Pacific Native Whey Protein Ingredients Revenue (USD Million) by Country (2021-2032)
8.4.1. China Native Whey Protein Ingredients Regional Analysis and Outlook
8.4.2. Japan Native Whey Protein Ingredients Regional Analysis and Outlook
8.4.3. India Native Whey Protein Ingredients Regional Analysis and Outlook
8.4.4. South Korea Native Whey Protein Ingredients Regional Analysis and Outlook
8.4.5. Australia Native Whey Protein Ingredients Regional Analysis and Outlook
8.4.6. South East Asia Native Whey Protein Ingredients Regional Analysis and Outlook
8.4.7. Rest of Asia Pacific Native Whey Protein Ingredients Regional Analysis and Outlook
8.5. South America Native Whey Protein Ingredients Revenue (USD Million), by Country (2021-2032)
8.5.1. Brazil Native Whey Protein Ingredients Regional Analysis and Outlook
8.5.2. Argentina Native Whey Protein Ingredients Regional Analysis and Outlook
8.5.3. Rest of South America Native Whey Protein Ingredients Regional Analysis and Outlook
8.6. Middle East and Africa Native Whey Protein Ingredients Revenue (USD Million) by Country (2021-2032)
8.6.1. Middle East Native Whey Protein Ingredients Regional Analysis and Outlook
8.6.2. Africa Native Whey Protein Ingredients Regional Analysis and Outlook
Chapter 9. North America Native Whey Protein Ingredients Analysis and Outlook
9.1. North America Native Whey Protein Ingredients Revenue (USD Million) by Segments (2021-2032)
9.1.1. North America Native Whey Protein Ingredients Revenue (USD Million) by Type (2021-2032)
9.1.2. North America Native Whey Protein Ingredients Revenue (USD Million) by Application (2021-2032)
9.1.3. North America Native Whey Protein Ingredients Revenue (USD Million) by Product (2021-2032)
By Type
Concentrate Form
Isolate Form
By Application
Protein-Enriched Beverages
Protein or Energy Bars
Infant Formulas
Clinical Nutrition
Dairy
Bakery
Supplements
Meat
Others
Chapter 10. Europe Native Whey Protein Ingredients Analysis and Outlook
10.1. Europe Native Whey Protein Ingredients Revenue (USD Million), by Segments (USD Million) (2021-2032)
10.1.1. Europe Native Whey Protein Ingredients Revenue (USD Million) by Type (2021-2032)
10.1.2. Europe Native Whey Protein Ingredients Revenue (USD Million) by Application (2021-2032)
10.1.3. Europe Native Whey Protein Ingredients Revenue (USD Million) by Product (2021-2032)
By Type
Concentrate Form
Isolate Form
By Application
Protein-Enriched Beverages
Protein or Energy Bars
Infant Formulas
Clinical Nutrition
Dairy
Bakery
Supplements
Meat
Others
Chapter 11. Asia Pacific Native Whey Protein Ingredients Analysis and Outlook
11.1. Asia Pacific Native Whey Protein Ingredients Revenue (USD Million), and Revenue (USD Million) by Segments (2021-2032)
11.1.1. Asia Pacific Native Whey Protein Ingredients Revenue (USD Million) by Type (2021-2032)
11.1.2. Asia Pacific Native Whey Protein Ingredients Revenue (USD Million) by Application (2021-2032)
11.1.3. Asia Pacific Native Whey Protein Ingredients Revenue (USD Million) by Product (2021-2032)
By Type
Concentrate Form
Isolate Form
By Application
Protein-Enriched Beverages
Protein or Energy Bars
Infant Formulas
Clinical Nutrition
Dairy
Bakery
Supplements
Meat
Others
Chapter 12. South America Native Whey Protein Ingredients Analysis and Outlook
12.1. South America Native Whey Protein Ingredients Revenue (USD Million), by Segments (2021-2032)
12.1.1. South America Native Whey Protein Ingredients Revenue (USD Million) by Type (2021-2032)
12.1.2. South America Native Whey Protein Ingredients Revenue (USD Million) by Application (2021-2032)
12.1.3. South America Native Whey Protein Ingredients Revenue (USD Million) by Product (2021-2032)
By Type
Concentrate Form
Isolate Form
By Application
Protein-Enriched Beverages
Protein or Energy Bars
Infant Formulas
Clinical Nutrition
Dairy
Bakery
Supplements
Meat
Others
Chapter 13. Middle East and Africa Native Whey Protein Ingredients Analysis and Outlook
13.1. Middle East and Africa Native Whey Protein Ingredients Revenue (USD Million), by Segments (2021-2032)
13.1.1. Middle East and Africa Native Whey Protein Ingredients Revenue (USD Million) by Type (2021-2032)
13.1.2. Middle East and Africa Native Whey Protein Ingredients Revenue (USD Million) by Application (2021-2032)
13.1.3. Middle East and Africa Native Whey Protein Ingredients Revenue (USD Million) by Product (2021-2032)
By Type
Concentrate Form
Isolate Form
By Application
Protein-Enriched Beverages
Protein or Energy Bars
Infant Formulas
Clinical Nutrition
Dairy
Bakery
Supplements
Meat
Others
Chapter 14. Native Whey Protein Ingredients Company Profiles
14.1 Business Overview
14.2 Product Profiles
14.3 SWOT Profiles
14.5 Recent Developments
14.6 Financial Profile
List of Companies
Ingredia SA
Lactalis Ingredients
MILEI GmbH
Omega Protein Corp
Reflex Nutrition
15. Methodology and Data Sources
15.1 Customization Offerings
15.2 Subscription Services
15.3 Related Reports
15.4 Publisher Expertise
LIST OF TABLES
Table 1 Market Segmentation Analysis
Table 2 Global Native Whey Protein Ingredients Market Share of Leading Companies, 2023
Table 3 Product Offerings of Leading Companies
Table 4 Low Growth Scenario Forecasts
Table 5 Reference Case Growth Scenario
Table 6 High Growth Case Scenario
Table 7 Global Native Whey Protein Ingredients Revenue (USD Million) And CAGR (%) By Type (2021-2032)
Table 8 Global Native Whey Protein Ingredients Revenue (USD Million) And CAGR (%) By Application (2021-2032)
Table 9 Global Native Whey Protein Ingredients Revenue (USD Million) And CAGR (%) By Product (2021-2032)
Table 10 Global Native Whey Protein Ingredients Market Revenue (USD Million) By Regions (2021-2032)
Table 11 Global Native Whey Protein Ingredients Market Share (%) By Regions (2021-2032)
Table 12 North America Native Whey Protein Ingredients Revenue (USD Million) By Country (2021-2032)
Table 13 Europe Native Whey Protein Ingredients Revenue (USD Million) By Country (2021-2032)
Table 14 Asia Pacific Native Whey Protein Ingredients Revenue (USD Million) By Country (2021-2032)
Table 15 South America Native Whey Protein Ingredients Revenue (USD Million) By Country (2021-2032)
Table 16 Middle East and Africa Native Whey Protein Ingredients Revenue (USD Million) By Region (2021-2032)
Table 17 North America Native Whey Protein Ingredients Revenue (USD Million) By Type (2021-2032)
Table 18 North America Native Whey Protein Ingredients Revenue (USD Million) By Application (2021-2032)
Table 19 North America Native Whey Protein Ingredients Revenue (USD Million) By Product (2021-2032)
Table 20 Europe Native Whey Protein Ingredients Revenue (USD Million) By Type (2021-2032)
Table 21 Europe Native Whey Protein Ingredients Revenue (USD Million) By Application (2021-2032)
Table 22 Europe Native Whey Protein Ingredients Revenue (USD Million) By Product (2021-2032)
Table 23 Asia Pacific Native Whey Protein Ingredients Revenue (USD Million) By Type (2021-2032)
Table 24 Asia Pacific Native Whey Protein Ingredients Revenue (USD Million) By Application (2021-2032)
Table 25 Asia Pacific Native Whey Protein Ingredients Revenue (USD Million) By Product (2021-2032)
Table 26 South America Native Whey Protein Ingredients Revenue (USD Million) By Type (2021-2032)
Table 27 South America Native Whey Protein Ingredients Revenue (USD Million) By Application (2021-2032)
Table 28 South America Native Whey Protein Ingredients Revenue (USD Million) By Product (2021-2032)
Table 29 Middle East and Africa Native Whey Protein Ingredients Revenue (USD Million) By Type (2021-2032)
Table 30 Middle East and Africa Native Whey Protein Ingredients Revenue (USD Million) By Application (2021-2032)
Table 31 Middle East and Africa Native Whey Protein Ingredients Revenue (USD Million) By Product (2021-2032)
LIST OF FIGURES
Figure 1. Market Scope
Figure 2. Pricing Forecasts Per Unit, 2023- 2032
Figure 3. Porter’s Five Forces
Figure 4. Global Native Whey Protein Ingredients Market Revenue (USD Million) By Regions (2021-2032)
Figure 5. Global Native Whey Protein Ingredients Market Share (%) By Regions (2023)
Figure 6. North America Native Whey Protein Ingredients Revenue (USD Million) By Country (2021-2032)
Figure 7. United States Native Whey Protein Ingredients Revenue (USD Million) By Country (2021-2032)
Figure 8. Canada Native Whey Protein Ingredients Revenue (USD Million) By Country (2021-2032)
Figure 9. Mexico Native Whey Protein Ingredients Revenue (USD Million) By Country (2021-2032)
Figure 10. Europe Native Whey Protein Ingredients Revenue (USD Million) By Country (2021-2032)
Figure 11. Germany Native Whey Protein Ingredients Revenue (USD Million) By Country (2021-2032)
Figure 12. France Native Whey Protein Ingredients Revenue (USD Million) By Country (2021-2032)
Figure 13. United Kingdom Native Whey Protein Ingredients Revenue (USD Million) By Country (2021-2032)
Figure 14. Spain Native Whey Protein Ingredients Revenue (USD Million) By Country (2021-2032)
Figure 15. Italy Native Whey Protein Ingredients Revenue (USD Million) By Country (2021-2032)
Figure 16. Russia Native Whey Protein Ingredients Revenue (USD Million) By Country (2021-2032)
Figure 17. Rest of Europe Native Whey Protein Ingredients Revenue (USD Million) By Country (2021-2032)
Figure 11. Asia Pacific Native Whey Protein Ingredients Revenue (USD Million) By Country (2021-2032)
Figure 12. China Native Whey Protein Ingredients Revenue (USD Million) By Country (2021-2032)
Figure 13. Japan Native Whey Protein Ingredients Revenue (USD Million) By Country (2021-2032)
Figure 14. India Native Whey Protein Ingredients Revenue (USD Million) By Country (2021-2032)
Figure 15. South Korea Native Whey Protein Ingredients Revenue (USD Million) By Country (2021-2032)
Figure 16. Australia Native Whey Protein Ingredients Revenue (USD Million) By Country (2021-2032)
Figure 17. South East Asia Native Whey Protein Ingredients Revenue (USD Million) By Country (2021-2032)
Figure 18. South America Native Whey Protein Ingredients Revenue (USD Million) By Country (2021-2032)
Figure 19. Brazil Native Whey Protein Ingredients Revenue (USD Million) By Country (2021-2032)
Figure 20. Argentina Native Whey Protein Ingredients Revenue (USD Million) By Country (2021-2032)
Figure 21. Rest of Asia Pacific Native Whey Protein Ingredients Revenue (USD Million) By Country (2021-2032)
Figure 22. Middle East and Africa Native Whey Protein Ingredients Revenue (USD Million) By Region (2021-2032)
Figure 23. Saudi Arabia Native Whey Protein Ingredients Revenue (USD Million) By Region (2021-2032)
Figure 24. The UAE Native Whey Protein Ingredients Revenue (USD Million) By Region (2021-2032)
Figure 25. Rest of Middle East Native Whey Protein Ingredients Revenue (USD Million) By Region (2021-2032)
Figure 26. South Africa Native Whey Protein Ingredients Revenue (USD Million) By Region (2021-2032)
Figure 27. Africa Native Whey Protein Ingredients Revenue (USD Million) By Region (2021-2032)
Figure 28. North America Native Whey Protein Ingredients Revenue (USD Million) By Type (2021-2032)
Figure 29. North America Native Whey Protein Ingredients Revenue (USD Million) By Application (2021-2032)
Figure 30. North America Native Whey Protein Ingredients Revenue (USD Million) By Product (2021-2032)
Figure 31. Europe Native Whey Protein Ingredients Revenue (USD Million) By Type (2021-2032)
Figure 32. Europe Native Whey Protein Ingredients Revenue (USD Million) By Application (2021-2032)
Figure 33. Europe Native Whey Protein Ingredients Revenue (USD Million) By Product (2021-2032)
Figure 34. Asia Pacific Native Whey Protein Ingredients Revenue (USD Million) By Type (2021-2032)
Figure 35. Asia Pacific Native Whey Protein Ingredients Revenue (USD Million) By Application (2021-2032)
Figure 36. Asia Pacific Native Whey Protein Ingredients Revenue (USD Million) By Product (2021-2032)
Figure 37. South America Native Whey Protein Ingredients Revenue (USD Million) By Type (2021-2032)
Figure 38. South America Native Whey Protein Ingredients Revenue (USD Million) By Application (2021-2032)
Figure 39. South America Native Whey Protein Ingredients Revenue (USD Million) By Product (2021-2032)
Figure 40. Middle East and Africa Native Whey Protein Ingredients Revenue (USD Million) By Type (2021-2032)
Figure 41. Middle East and Africa Native Whey Protein Ingredients Revenue (USD Million) By Application (2021-2032)
Figure 42. Middle East and Africa Native Whey Protein Ingredients Revenue (USD Million) By Product (2021-2032)
By Type
Concentrate Form
Isolate Form
By Application
Protein-Enriched Beverages
Protein or Energy Bars
Infant Formulas
Clinical Nutrition
Dairy
Bakery
Supplements
Meat
Others
Countries Analyzed
North America (US, Canada, Mexico)
Europe (Germany, UK, France, Spain, Italy, Russia, Rest of Europe)
Asia Pacific (China, India, Japan, South Korea, Australia, South East Asia, Rest of Asia)
South America (Brazil, Argentina, Rest of South America)
Middle East and Africa (Saudi Arabia, UAE, Rest of Middle East, South Africa, Egypt, Rest of Africa)
