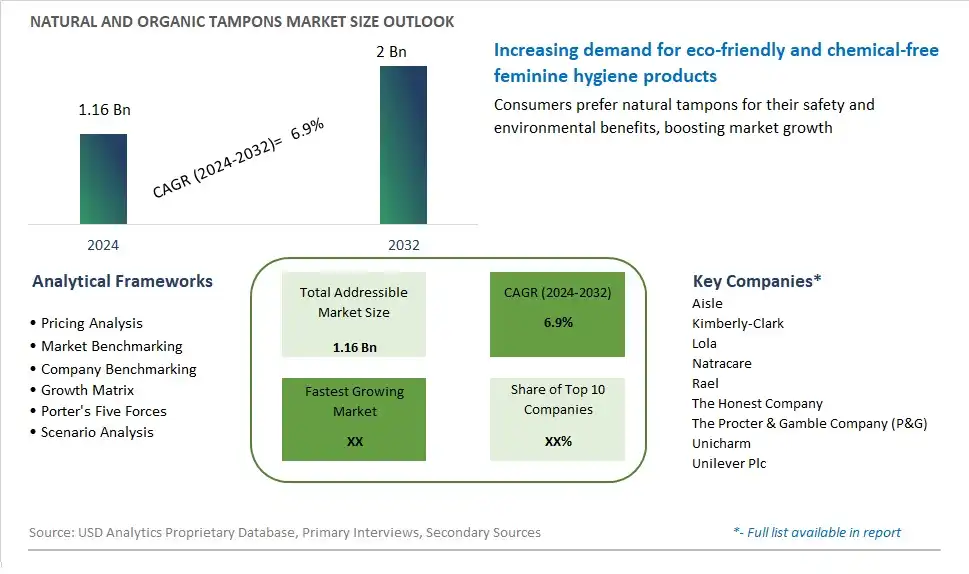
Global Natural and Organic Tampons Market Size is valued at $1.16 Billion in 2024 and is forecast to register a growth rate (CAGR) of 6.9% to reach $2 Billion by 2032.
The global Natural and Organic Tampons Market Comprehensive Study analyzes and forecasts the market size across 6 regions and 24 countries for diverse segments -By Product (Organic Tampons, Organic Pads, Organic Panty Liners, Organic Menstrual Cups), By Consumer Preferences (Products for Sensitive Skin, Fragrance-Free Products, Products with Biodegradable Materials), By Brand Positioning (Premium Organic Brands, Affordable Natural Brands, Luxury Organic Brands, Eco-Friendly Brands)
An Introduction to Natural and Organic Tampons Market
In 2024, the market for natural and organic tampons is witnessing significant growth as consumers become more mindful of the ingredients in feminine hygiene products and seek safer, eco-friendly alternatives. Natural and organic tampons are made from biodegradable materials such as organic cotton, bamboo fibers, and plant-based materials, free from chlorine, synthetic fragrances, and harmful chemicals often found in conventional tampons. With increasing concerns about menstrual health, allergies, and environmental pollution, consumers are opting for tampons that offer a healthier and more sustainable option for managing their menstrual cycles. Moreover, the rise of menstrual equity movements and period-positive initiatives is driving awareness and advocacy for safer, more accessible menstrual care products that prioritize women's health and well-being. As the market continues to expand, expect to see further innovation in natural and organic tampons, including compostable packaging, innovative applicator designs, and charitable partnerships that address menstrual stigma and support menstrual health education and access initiatives globally.
Natural and Organic Tampons Competitive Landscape
The market report analyses the leading companies in the industry including Aisle, Kimberly-Clark, Lola, Natracare, Rael, The Honest Company, The Procter & Gamble Company (P&G), Unicharm, Unilever Plc, and Others.
Natural and Organic Tampons Market Dynamics
Natural and Organic Tampons Market Trend: Increasing Awareness of Menstrual Health and Sustainability
A significant trend in the natural and organic tampons market is the increasing awareness of menstrual health and sustainability among consumers. With growing concerns about the environmental impact of conventional menstrual products and the potential health risks associated with synthetic ingredients and chemicals, there's a rising demand for natural and organic alternatives. Consumers are seeking tampons made from organic cotton, free from pesticides, chlorine, fragrances, and dyes, to minimize exposure to potentially harmful substances and reduce their environmental footprint. This trend is driven by a desire for safer, more sustainable menstrual care options that prioritize women's health and well-being while promoting environmental stewardship and eco-friendly practices.
Market Driver: Preference for Chemical-Free and Hypoallergenic Products
A key driver for the natural and organic tampons market is the preference for chemical-free and hypoallergenic products among women seeking safer and gentler menstrual care options. Conventional tampons often contain synthetic materials, bleaches, and fragrances that may cause irritation, allergic reactions, or disrupt the natural pH balance of the vagina. Natural and organic tampons, made from organic cotton and devoid of harsh chemicals and irritants, offer a safer and more comfortable alternative for women with sensitive skin or allergies. This driver is reinforced by factors such as the growing awareness of menstrual hygiene-related health issues, the influence of clean beauty and wellness trends, and the advocacy of women's health organizations and environmental activists for safer and more sustainable menstrual products.
Market Opportunity: Innovation in Design and Biodegradable Materials
An opportunity for the natural and organic tampons market lies in innovation in design and the use of biodegradable materials to address consumer concerns about sustainability and comfort. Companies can capitalize on this opportunity by developing tampons with innovative features such as ergonomic applicators, enhanced absorbency, and leak-proof designs to improve user experience and convenience. Moreover, there's potential to explore the use of biodegradable materials, such as organic cotton, plant-based fibers, or compostable packaging, to reduce environmental impact and promote circularity in the menstrual care industry. By investing in research and development and embracing eco-friendly practices, companies can differentiate their products, attract environmentally conscious consumers, and drive market growth in the natural and organic tampons segment.
Natural and Organic Tampons Market Share Analysis: Organic Tampons held the dominant market share in 2024
Within the expansive realm of natural and organic tampons, the organic tampons segment is the largest and most influential domain, driven by a growing consumer inclination towards eco-friendly, chemical-free feminine hygiene products. This dominance is rooted in several key factors. Firstly, organic tampons, crafted from natural and biodegradable materials such as organic cotton, bamboo fibers, and plant-based polymers, resonate deeply with environmentally conscious consumers seeking safer and more sustainable alternatives to conventional menstrual products. The absence of synthetic additives, fragrances, and pesticides in organic tampons aligns with consumers' concerns about potential health risks associated with prolonged exposure to harmful chemicals, garnering trust and loyalty in an increasingly discerning market. Further, the surge in awareness and advocacy surrounding menstrual health and sustainability issues has propelled the demand for organic tampons, driving market penetration and brand preference among diverse demographic segments. Additionally, the availability of a wide range of organic tampon options, including applicator and non-applicator variants, caters to the diverse needs and preferences of menstruators, further solidifying the segment's dominance in the natural and organic tampons market. As the movement towards menstrual equity, environmental stewardship, and holistic wellness gains momentum, the organic tampons segment continues to spearhead innovation and market growth, reshaping the landscape of feminine hygiene products with a blend of efficacy, ethics, and eco-consciousness.
Natural and Organic Tampons Market Share Analysis: Products for Sensitive Skin market is poised to register the fastest growth rae over the forecast period to 2032
Within the dynamic arena of consumer preferences in the natural and organic tampons market, the segment catering to products for sensitive skin is the fastest-growing frontier, driven by a convergence of heightened awareness, evolving lifestyles, and a growing demand for gentle yet effective feminine hygiene solutions. This accelerated growth is propelled by several key factors. Firstly, a rising prevalence of skin sensitivities and allergies among menstruators has underscored the need for tampon products formulated with hypoallergenic materials and devoid of harsh chemicals and irritants. As consumers increasingly prioritize skincare and wellness, the demand for tampons specifically designed to soothe and protect sensitive skin has surged, reflecting a broader shift towards holistic self-care practices. Further, the trend towards transparency and ingredient consciousness in personal care products has spurred interest in fragrance-free and dermatologist-tested tampon options, resonating with consumers seeking reassurance of product safety and efficacy. Additionally, the growing emphasis on sustainability and environmental responsibility has propelled the demand for tampons crafted from biodegradable materials, offering a planet-friendly alternative to conventional synthetic products. As awareness of skin health, ingredient transparency, and environmental impact continues to permeate consumer consciousness, the segment catering to products for sensitive skin is poised for sustained growth and innovation, driving positive change in the natural and organic tampons market while prioritizing both personal wellness and planetary well-being.
Natural and Organic Tampons Market Share Analysis: Affordable Natural Brands held the dominant market share in 2024
Within the diverse landscape of brand positioning in the natural and organic tampons market, the segment occupied by affordable natural brands is the largest and most pervasive, driven by accessibility, affordability, and a commitment to democratizing eco-friendly menstrual care. This dominance is underpinned by several key factors. Firstly, affordable natural brands prioritize affordability without compromising on the quality or integrity of their products, making eco-conscious menstrual care accessible to a wider demographic range of consumers. By offering competitively priced tampons crafted from organic and sustainable materials, these brands empower individuals to make environmentally responsible choices without financial barriers, fostering inclusivity and accessibility in the marketplace. Further, the rise of social and environmental activism has amplified demand for ethically sourced and transparently produced products, further bolstering the appeal of affordable natural brands among conscientious consumers seeking to align their purchasing decisions with their values. Additionally, the scalability and mass-market appeal of affordable natural brands enable them to capture a significant share of the market, leveraging economies of scale and efficient distribution channels to reach consumers across diverse geographic regions and demographic segments. As affordability, sustainability, and inclusivity emerge as defining pillars of brand identity and consumer preference, affordable natural brands continue to dominate the natural and organic tampons market, driving positive change while democratizing access to eco-friendly menstrual care solutions.
Natural and Organic Tampons Market Segmentation
By Product
Organic Tampons
Organic Pads
Organic Panty Liners
Organic Menstrual Cups
By Consumer Preferences
Products for Sensitive Skin
Fragrance-Free Products
Products with Biodegradable Materials
By Brand Positioning
Premium Organic Brands
Affordable Natural Brands
Luxury Organic Brands
Eco-Friendly Brands
Countries Analyzed
North America (US, Canada, Mexico)
Europe (Germany, UK, France, Spain, Italy, Russia, Rest of Europe)
Asia Pacific (China, India, Japan, South Korea, Australia, South East Asia, Rest of Asia)
South America (Brazil, Argentina, Rest of South America)
Middle East and Africa (Saudi Arabia, UAE, Rest of Middle East, South Africa, Egypt, Rest of Africa)
Natural and Organic Tampons Companies Profiled in the Study
Aisle
Kimberly-Clark
Lola
Natracare
Rael
The Honest Company
The Procter & Gamble Company (P&G)
Unicharm
Unilever Plc
*- List Not Exhaustive
Chapter 1. TABLE OF CONTENTS
Chapter 2. Introduction to Natural and Organic Tampons Market
2.1. Market Overview
2.2. Key Statistics and Report Highlights
2.3. Scope of the Comprehensive Study
2.3.1. Market Definition
2.3.2 Countries and Regions Covered
2.3.3 Research Objective
2.3.4 Units, Currency, and Conversions
2.3.5 Industry Value Chain
2.4. Key Market Segments
2.5. Key Companies
2.6. Study Period
Chapter 3. Strategic Analysis Review
3.1. Natural and Organic Tampons Pricing Analysis and Forecast
3.2. Porter’s Five Forces
3.3. Market Ecosystem
3.4. SWOT Analysis
3.5. Regulatory Scenario
3.3. Effects of Inflation, Russia-Ukraine War, moderating economic growth, and other macroeconomic factors
Chapter 4. Competitive Landscape
4.1. Market Share Analysis
4.1.1. Global Natural and Organic Tampons Market Share by Company, 2023
4.1.2. Product Offerings of Leading Natural and Organic Tampons Companies
4.2. Market Entropy
4.2.1. New Product Launches in the Industry
4.2.2. Mergers, Acquisitions, Joint ventures, and Partnerships
4.3. Key Strategies and Best Practices
Chapter 5. Global Market Projections: Best, Reference, and Low Case Scenarios
5.1. Growth Analysis- Case Scenario Definitions
5.2. Low Growth Case Scenario Forecasts
5.3. Reference Growth Case Scenario Forecasts
5.4. High Growth Case Scenario Forecasts
Chapter 6. Market Dynamics
6.1. Natural and Organic Tampons Market Drivers
6.2. Natural and Organic Tampons Market Challenges
6.6. Natural and Organic Tampons Market Opportunities
6.4. Natural and Organic Tampons Market Trends
Chapter 7. Global Natural and Organic Tampons Market Outlook Trends
7.1. Global Natural and Organic Tampons Revenue (USD Million) and CAGR (%) by Type (2021-2032)
7.2. Global Natural and Organic Tampons Revenue (USD Million) and CAGR (%) by Application (2021-2032)
7.3. Global Natural and Organic Tampons Revenue (USD Million) and CAGR (%) by Product (2021-2032)
By Product
Organic Tampons
Organic Pads
Organic Panty Liners
Organic Menstrual Cups
By Consumer Preferences
Products for Sensitive Skin
Fragrance-Free Products
Products with Biodegradable Materials
By Brand Positioning
Premium Organic Brands
Affordable Natural Brands
Luxury Organic Brands
Eco-Friendly Brands
Chapter 8. Global Natural and Organic Tampons Regional Analysis and Outlook
8.1. Global Natural and Organic Tampons Revenue (USD Million) By Regions (2021- 2032)
8.2. North America Natural and Organic Tampons Revenue (USD Million) by Country (2021-2032)
8.2.1. United States Natural and Organic Tampons Regional Analysis and Outlook
8.2.2. Canada Natural and Organic Tampons Regional Analysis and Outlook
8.2.3. Mexico Natural and Organic Tampons Regional Analysis and Outlook
8.3. Europe Natural and Organic Tampons Revenue (USD Million), by Country (2021-2032)
8.3.1. Germany Natural and Organic Tampons Regional Analysis and Outlook
8.3.2. France Natural and Organic Tampons Regional Analysis and Outlook
8.3.3. United Kingdom Natural and Organic Tampons Regional Analysis and Outlook
8.3.4. Spain Natural and Organic Tampons Regional Analysis and Outlook
8.3.5. Italy Natural and Organic Tampons Regional Analysis and Outlook
8.3.6. Russia Natural and Organic Tampons Regional Analysis and Outlook
8.3.7. Rest of Europe Natural and Organic Tampons Regional Analysis and Outlook
8.4. Asia Pacific Natural and Organic Tampons Revenue (USD Million) by Country (2021-2032)
8.4.1. China Natural and Organic Tampons Regional Analysis and Outlook
8.4.2. Japan Natural and Organic Tampons Regional Analysis and Outlook
8.4.3. India Natural and Organic Tampons Regional Analysis and Outlook
8.4.4. South Korea Natural and Organic Tampons Regional Analysis and Outlook
8.4.5. Australia Natural and Organic Tampons Regional Analysis and Outlook
8.4.6. South East Asia Natural and Organic Tampons Regional Analysis and Outlook
8.4.7. Rest of Asia Pacific Natural and Organic Tampons Regional Analysis and Outlook
8.5. South America Natural and Organic Tampons Revenue (USD Million), by Country (2021-2032)
8.5.1. Brazil Natural and Organic Tampons Regional Analysis and Outlook
8.5.2. Argentina Natural and Organic Tampons Regional Analysis and Outlook
8.5.3. Rest of South America Natural and Organic Tampons Regional Analysis and Outlook
8.6. Middle East and Africa Natural and Organic Tampons Revenue (USD Million) by Country (2021-2032)
8.6.1. Middle East Natural and Organic Tampons Regional Analysis and Outlook
8.6.2. Africa Natural and Organic Tampons Regional Analysis and Outlook
Chapter 9. North America Natural and Organic Tampons Analysis and Outlook
9.1. North America Natural and Organic Tampons Revenue (USD Million) by Segments (2021-2032)
9.1.1. North America Natural and Organic Tampons Revenue (USD Million) by Type (2021-2032)
9.1.2. North America Natural and Organic Tampons Revenue (USD Million) by Application (2021-2032)
9.1.3. North America Natural and Organic Tampons Revenue (USD Million) by Product (2021-2032)
By Product
Organic Tampons
Organic Pads
Organic Panty Liners
Organic Menstrual Cups
By Consumer Preferences
Products for Sensitive Skin
Fragrance-Free Products
Products with Biodegradable Materials
By Brand Positioning
Premium Organic Brands
Affordable Natural Brands
Luxury Organic Brands
Eco-Friendly Brands
Chapter 10. Europe Natural and Organic Tampons Analysis and Outlook
10.1. Europe Natural and Organic Tampons Revenue (USD Million), by Segments (USD Million) (2021-2032)
10.1.1. Europe Natural and Organic Tampons Revenue (USD Million) by Type (2021-2032)
10.1.2. Europe Natural and Organic Tampons Revenue (USD Million) by Application (2021-2032)
10.1.3. Europe Natural and Organic Tampons Revenue (USD Million) by Product (2021-2032)
By Product
Organic Tampons
Organic Pads
Organic Panty Liners
Organic Menstrual Cups
By Consumer Preferences
Products for Sensitive Skin
Fragrance-Free Products
Products with Biodegradable Materials
By Brand Positioning
Premium Organic Brands
Affordable Natural Brands
Luxury Organic Brands
Eco-Friendly Brands
Chapter 11. Asia Pacific Natural and Organic Tampons Analysis and Outlook
11.1. Asia Pacific Natural and Organic Tampons Revenue (USD Million), and Revenue (USD Million) by Segments (2021-2032)
11.1.1. Asia Pacific Natural and Organic Tampons Revenue (USD Million) by Type (2021-2032)
11.1.2. Asia Pacific Natural and Organic Tampons Revenue (USD Million) by Application (2021-2032)
11.1.3. Asia Pacific Natural and Organic Tampons Revenue (USD Million) by Product (2021-2032)
By Product
Organic Tampons
Organic Pads
Organic Panty Liners
Organic Menstrual Cups
By Consumer Preferences
Products for Sensitive Skin
Fragrance-Free Products
Products with Biodegradable Materials
By Brand Positioning
Premium Organic Brands
Affordable Natural Brands
Luxury Organic Brands
Eco-Friendly Brands
Chapter 12. South America Natural and Organic Tampons Analysis and Outlook
12.1. South America Natural and Organic Tampons Revenue (USD Million), by Segments (2021-2032)
12.1.1. South America Natural and Organic Tampons Revenue (USD Million) by Type (2021-2032)
12.1.2. South America Natural and Organic Tampons Revenue (USD Million) by Application (2021-2032)
12.1.3. South America Natural and Organic Tampons Revenue (USD Million) by Product (2021-2032)
By Product
Organic Tampons
Organic Pads
Organic Panty Liners
Organic Menstrual Cups
By Consumer Preferences
Products for Sensitive Skin
Fragrance-Free Products
Products with Biodegradable Materials
By Brand Positioning
Premium Organic Brands
Affordable Natural Brands
Luxury Organic Brands
Eco-Friendly Brands
Chapter 13. Middle East and Africa Natural and Organic Tampons Analysis and Outlook
13.1. Middle East and Africa Natural and Organic Tampons Revenue (USD Million), by Segments (2021-2032)
13.1.1. Middle East and Africa Natural and Organic Tampons Revenue (USD Million) by Type (2021-2032)
13.1.2. Middle East and Africa Natural and Organic Tampons Revenue (USD Million) by Application (2021-2032)
13.1.3. Middle East and Africa Natural and Organic Tampons Revenue (USD Million) by Product (2021-2032)
By Product
Organic Tampons
Organic Pads
Organic Panty Liners
Organic Menstrual Cups
By Consumer Preferences
Products for Sensitive Skin
Fragrance-Free Products
Products with Biodegradable Materials
By Brand Positioning
Premium Organic Brands
Affordable Natural Brands
Luxury Organic Brands
Eco-Friendly Brands
Chapter 14. Natural and Organic Tampons Company Profiles
14.1 Business Overview
14.2 Product Profiles
14.3 SWOT Profiles
14.5 Recent Developments
14.6 Financial Profile
List of Companies
Aisle
Kimberly-Clark
Lola
Natracare
Rael
The Honest Company
The Procter & Gamble Company (P&G)
Unicharm
Unilever Plc
15. Methodology and Data Sources
15.1 Customization Offerings
15.2 Subscription Services
15.3 Related Reports
15.4 Publisher Expertise
LIST OF TABLES
Table 1 Market Segmentation Analysis
Table 2 Global Natural and Organic Tampons Market Share of Leading Companies, 2023
Table 3 Product Offerings of Leading Companies
Table 4 Low Growth Scenario Forecasts
Table 5 Reference Case Growth Scenario
Table 6 High Growth Case Scenario
Table 7 Global Natural and Organic Tampons Revenue (USD Million) And CAGR (%) By Type (2021-2032)
Table 8 Global Natural and Organic Tampons Revenue (USD Million) And CAGR (%) By Application (2021-2032)
Table 9 Global Natural and Organic Tampons Revenue (USD Million) And CAGR (%) By Product (2021-2032)
Table 10 Global Natural and Organic Tampons Market Revenue (USD Million) By Regions (2021-2032)
Table 11 Global Natural and Organic Tampons Market Share (%) By Regions (2021-2032)
Table 12 North America Natural and Organic Tampons Revenue (USD Million) By Country (2021-2032)
Table 13 Europe Natural and Organic Tampons Revenue (USD Million) By Country (2021-2032)
Table 14 Asia Pacific Natural and Organic Tampons Revenue (USD Million) By Country (2021-2032)
Table 15 South America Natural and Organic Tampons Revenue (USD Million) By Country (2021-2032)
Table 16 Middle East and Africa Natural and Organic Tampons Revenue (USD Million) By Region (2021-2032)
Table 17 North America Natural and Organic Tampons Revenue (USD Million) By Type (2021-2032)
Table 18 North America Natural and Organic Tampons Revenue (USD Million) By Application (2021-2032)
Table 19 North America Natural and Organic Tampons Revenue (USD Million) By Product (2021-2032)
Table 20 Europe Natural and Organic Tampons Revenue (USD Million) By Type (2021-2032)
Table 21 Europe Natural and Organic Tampons Revenue (USD Million) By Application (2021-2032)
Table 22 Europe Natural and Organic Tampons Revenue (USD Million) By Product (2021-2032)
Table 23 Asia Pacific Natural and Organic Tampons Revenue (USD Million) By Type (2021-2032)
Table 24 Asia Pacific Natural and Organic Tampons Revenue (USD Million) By Application (2021-2032)
Table 25 Asia Pacific Natural and Organic Tampons Revenue (USD Million) By Product (2021-2032)
Table 26 South America Natural and Organic Tampons Revenue (USD Million) By Type (2021-2032)
Table 27 South America Natural and Organic Tampons Revenue (USD Million) By Application (2021-2032)
Table 28 South America Natural and Organic Tampons Revenue (USD Million) By Product (2021-2032)
Table 29 Middle East and Africa Natural and Organic Tampons Revenue (USD Million) By Type (2021-2032)
Table 30 Middle East and Africa Natural and Organic Tampons Revenue (USD Million) By Application (2021-2032)
Table 31 Middle East and Africa Natural and Organic Tampons Revenue (USD Million) By Product (2021-2032)
LIST OF FIGURES
Figure 1. Market Scope
Figure 2. Pricing Forecasts Per Unit, 2023- 2032
Figure 3. Porter’s Five Forces
Figure 4. Global Natural and Organic Tampons Market Revenue (USD Million) By Regions (2021-2032)
Figure 5. Global Natural and Organic Tampons Market Share (%) By Regions (2023)
Figure 6. North America Natural and Organic Tampons Revenue (USD Million) By Country (2021-2032)
Figure 7. United States Natural and Organic Tampons Revenue (USD Million) By Country (2021-2032)
Figure 8. Canada Natural and Organic Tampons Revenue (USD Million) By Country (2021-2032)
Figure 9. Mexico Natural and Organic Tampons Revenue (USD Million) By Country (2021-2032)
Figure 10. Europe Natural and Organic Tampons Revenue (USD Million) By Country (2021-2032)
Figure 11. Germany Natural and Organic Tampons Revenue (USD Million) By Country (2021-2032)
Figure 12. France Natural and Organic Tampons Revenue (USD Million) By Country (2021-2032)
Figure 13. United Kingdom Natural and Organic Tampons Revenue (USD Million) By Country (2021-2032)
Figure 14. Spain Natural and Organic Tampons Revenue (USD Million) By Country (2021-2032)
Figure 15. Italy Natural and Organic Tampons Revenue (USD Million) By Country (2021-2032)
Figure 16. Russia Natural and Organic Tampons Revenue (USD Million) By Country (2021-2032)
Figure 17. Rest of Europe Natural and Organic Tampons Revenue (USD Million) By Country (2021-2032)
Figure 11. Asia Pacific Natural and Organic Tampons Revenue (USD Million) By Country (2021-2032)
Figure 12. China Natural and Organic Tampons Revenue (USD Million) By Country (2021-2032)
Figure 13. Japan Natural and Organic Tampons Revenue (USD Million) By Country (2021-2032)
Figure 14. India Natural and Organic Tampons Revenue (USD Million) By Country (2021-2032)
Figure 15. South Korea Natural and Organic Tampons Revenue (USD Million) By Country (2021-2032)
Figure 16. Australia Natural and Organic Tampons Revenue (USD Million) By Country (2021-2032)
Figure 17. South East Asia Natural and Organic Tampons Revenue (USD Million) By Country (2021-2032)
Figure 18. South America Natural and Organic Tampons Revenue (USD Million) By Country (2021-2032)
Figure 19. Brazil Natural and Organic Tampons Revenue (USD Million) By Country (2021-2032)
Figure 20. Argentina Natural and Organic Tampons Revenue (USD Million) By Country (2021-2032)
Figure 21. Rest of Asia Pacific Natural and Organic Tampons Revenue (USD Million) By Country (2021-2032)
Figure 22. Middle East and Africa Natural and Organic Tampons Revenue (USD Million) By Region (2021-2032)
Figure 23. Saudi Arabia Natural and Organic Tampons Revenue (USD Million) By Region (2021-2032)
Figure 24. The UAE Natural and Organic Tampons Revenue (USD Million) By Region (2021-2032)
Figure 25. Rest of Middle East Natural and Organic Tampons Revenue (USD Million) By Region (2021-2032)
Figure 26. South Africa Natural and Organic Tampons Revenue (USD Million) By Region (2021-2032)
Figure 27. Africa Natural and Organic Tampons Revenue (USD Million) By Region (2021-2032)
Figure 28. North America Natural and Organic Tampons Revenue (USD Million) By Type (2021-2032)
Figure 29. North America Natural and Organic Tampons Revenue (USD Million) By Application (2021-2032)
Figure 30. North America Natural and Organic Tampons Revenue (USD Million) By Product (2021-2032)
Figure 31. Europe Natural and Organic Tampons Revenue (USD Million) By Type (2021-2032)
Figure 32. Europe Natural and Organic Tampons Revenue (USD Million) By Application (2021-2032)
Figure 33. Europe Natural and Organic Tampons Revenue (USD Million) By Product (2021-2032)
Figure 34. Asia Pacific Natural and Organic Tampons Revenue (USD Million) By Type (2021-2032)
Figure 35. Asia Pacific Natural and Organic Tampons Revenue (USD Million) By Application (2021-2032)
Figure 36. Asia Pacific Natural and Organic Tampons Revenue (USD Million) By Product (2021-2032)
Figure 37. South America Natural and Organic Tampons Revenue (USD Million) By Type (2021-2032)
Figure 38. South America Natural and Organic Tampons Revenue (USD Million) By Application (2021-2032)
Figure 39. South America Natural and Organic Tampons Revenue (USD Million) By Product (2021-2032)
Figure 40. Middle East and Africa Natural and Organic Tampons Revenue (USD Million) By Type (2021-2032)
Figure 41. Middle East and Africa Natural and Organic Tampons Revenue (USD Million) By Application (2021-2032)
Figure 42. Middle East and Africa Natural and Organic Tampons Revenue (USD Million) By Product (2021-2032)
By Product
Organic Tampons
Organic Pads
Organic Panty Liners
Organic Menstrual Cups
By Consumer Preferences
Products for Sensitive Skin
Fragrance-Free Products
Products with Biodegradable Materials
By Brand Positioning
Premium Organic Brands
Affordable Natural Brands
Luxury Organic Brands
Eco-Friendly Brands
Countries Analyzed
North America (US, Canada, Mexico)
Europe (Germany, UK, France, Spain, Italy, Russia, Rest of Europe)
Asia Pacific (China, India, Japan, South Korea, Australia, South East Asia, Rest of Asia)
South America (Brazil, Argentina, Rest of South America)
Middle East and Africa (Saudi Arabia, UAE, Rest of Middle East, South Africa, Egypt, Rest of Africa)
