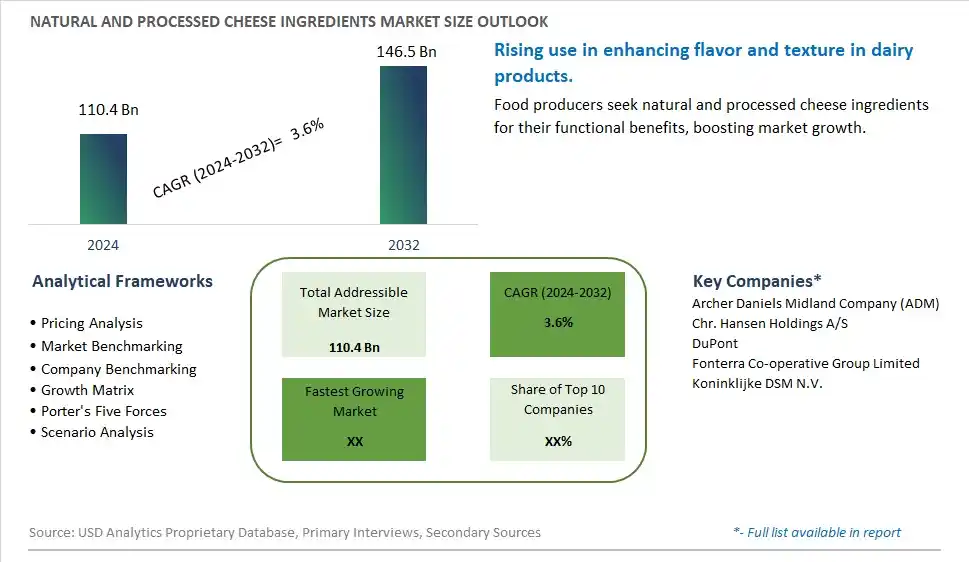
Global Natural and Processed Cheese Ingredients Market Size is valued at $110.4 Billion in 2024 and is forecast to register a growth rate (CAGR) of 3.6% to reach $146.5 Billion by 2032.
The global Natural and Processed Cheese Ingredients Market Comprehensive Study analyzes and forecasts the market size across 6 regions and 24 countries for diverse segments -By Type (Natural, Processed), By Application (Milk, Cultures, Enzymes, Additives)
An Introduction to Natural and Processed Cheese Ingredients Market
The natural and processed cheese ingredients market in 2024 is expanding rapidly, driven by the demand for high-quality ingredients that enhance the flavor, texture, and shelf life of cheese products. The market includes natural cheese ingredients such as cultures, enzymes, and rennet, as well as processed cheese ingredients like emulsifiers and stabilizers. The market benefits from advancements in ingredient formulation and processing technologies. The trend towards clean label and natural ingredients is influencing product development. Increasing consumer interest in premium, artisanal cheeses and the popularity of convenience foods are further supporting market growth.
Natural and Processed Cheese Ingredients Competitive Landscape
The market report analyses the leading companies in the industry including Archer Daniels Midland Company (ADM), Chr. Hansen Holdings A/S, DuPont, Fonterra Co-operative Group Limited, Koninklijke DSM N.V., and Others.
Natural and Processed Cheese Ingredients Market Dynamics
Natural and Processed Cheese Ingredients Market Trend: Increasing Use of Natural Ingredients in Cheese Production
The most prominent trend in the Natural and Processed Cheese Ingredients Market is the increasing use of natural ingredients in cheese production. Consumers are seeking cheeses made with clean label ingredients, free from artificial additives and preservatives, driving the demand for natural cheese ingredients.
Natural and Processed Cheese Ingredients Market Driver: Growth of the Specialty Cheese Market
Natural and Processed Cheese Ingredients Market Share Analysis- Largest Segment by Type
The Natural cheese ingredients segment is the largest in the Natural and Processed Cheese Ingredients Market. This dominance is due to the growing consumer preference for natural, minimally processed foods, driven by increasing health consciousness and the demand for clean-label products. Natural cheese ingredients, such as unprocessed cheese and natural cultures, are perceived as healthier and more authentic compared to their processed counterparts. They also command a premium in the market due to their superior taste and nutritional profile. Additionally, natural cheese ingredients are integral to artisanal and gourmet cheese products, which further fuels their market share.
Natural and Processed Cheese Ingredients Market Share Analysis- Fastest Growing Segment by Application
The Enzymes application segment is poised to grow the fastest in the Natural and Processed Cheese Ingredients Market over the next five years. Enzymes play a crucial role in cheese production, influencing flavor development, texture, and ripening processes. With advancements in enzyme technology and increasing demand for specialized cheese products, the need for innovative enzyme solutions is rising. Enzymes are becoming essential in creating diverse cheese varieties, including low-fat and lactose-free options, which are gaining popularity. This growing trend towards customization and quality enhancement in cheese production drives the rapid growth of the enzyme segment.
Natural and Processed Cheese Ingredients Market Segmentation
By Type
Natural
Processed
By Application
Milk
Cultures
Enzymes
Additives
Countries Analyzed
North America (US, Canada, Mexico)
Europe (Germany, UK, France, Spain, Italy, Russia, Rest of Europe)
Asia Pacific (China, India, Japan, South Korea, Australia, South East Asia, Rest of Asia)
South America (Brazil, Argentina, Rest of South America)
Middle East and Africa (Saudi Arabia, UAE, Rest of Middle East, South Africa, Egypt, Rest of Africa)
Natural and Processed Cheese Ingredients Companies Profiled in the Study
Archer Daniels Midland Company (ADM)
Chr. Hansen Holdings A/S
DuPont
Fonterra Co-operative Group Limited
Koninklijke DSM N.V.
*- List Not Exhaustive
Chapter 1. TABLE OF CONTENTS
Chapter 2. Introduction to Natural and Processed Cheese Ingredients Market
2.1. Market Overview
2.2. Key Statistics and Report Highlights
2.3. Scope of the Comprehensive Study
2.3.1. Market Definition
2.3.2 Countries and Regions Covered
2.3.3 Research Objective
2.3.4 Units, Currency, and Conversions
2.3.5 Industry Value Chain
2.4. Key Market Segments
2.5. Key Companies
2.6. Study Period
Chapter 3. Strategic Analysis Review
3.1. Natural and Processed Cheese Ingredients Pricing Analysis and Forecast
3.2. Porter’s Five Forces
3.3. Market Ecosystem
3.4. SWOT Analysis
3.5. Regulatory Scenario
3.3. Effects of Inflation, Russia-Ukraine War, moderating economic growth, and other macroeconomic factors
Chapter 4. Competitive Landscape
4.1. Market Share Analysis
4.1.1. Global Natural and Processed Cheese Ingredients Market Share by Company, 2023
4.1.2. Product Offerings of Leading Natural and Processed Cheese Ingredients Companies
4.2. Market Entropy
4.2.1. New Product Launches in the Industry
4.2.2. Mergers, Acquisitions, Joint ventures, and Partnerships
4.3. Key Strategies and Best Practices
Chapter 5. Global Market Projections: Best, Reference, and Low Case Scenarios
5.1. Growth Analysis- Case Scenario Definitions
5.2. Low Growth Case Scenario Forecasts
5.3. Reference Growth Case Scenario Forecasts
5.4. High Growth Case Scenario Forecasts
Chapter 6. Market Dynamics
6.1. Natural and Processed Cheese Ingredients Market Drivers
6.2. Natural and Processed Cheese Ingredients Market Challenges
6.6. Natural and Processed Cheese Ingredients Market Opportunities
6.4. Natural and Processed Cheese Ingredients Market Trends
Chapter 7. Global Natural and Processed Cheese Ingredients Market Outlook Trends
7.1. Global Natural and Processed Cheese Ingredients Revenue (USD Million) and CAGR (%) by Type (2021-2032)
7.2. Global Natural and Processed Cheese Ingredients Revenue (USD Million) and CAGR (%) by Application (2021-2032)
7.3. Global Natural and Processed Cheese Ingredients Revenue (USD Million) and CAGR (%) by Product (2021-2032)
By Type
Natural
Processed
By Application
Milk
Cultures
Enzymes
Additives
Chapter 8. Global Natural and Processed Cheese Ingredients Regional Analysis and Outlook
8.1. Global Natural and Processed Cheese Ingredients Revenue (USD Million) By Regions (2021- 2032)
8.2. North America Natural and Processed Cheese Ingredients Revenue (USD Million) by Country (2021-2032)
8.2.1. United States Natural and Processed Cheese Ingredients Regional Analysis and Outlook
8.2.2. Canada Natural and Processed Cheese Ingredients Regional Analysis and Outlook
8.2.3. Mexico Natural and Processed Cheese Ingredients Regional Analysis and Outlook
8.3. Europe Natural and Processed Cheese Ingredients Revenue (USD Million), by Country (2021-2032)
8.3.1. Germany Natural and Processed Cheese Ingredients Regional Analysis and Outlook
8.3.2. France Natural and Processed Cheese Ingredients Regional Analysis and Outlook
8.3.3. United Kingdom Natural and Processed Cheese Ingredients Regional Analysis and Outlook
8.3.4. Spain Natural and Processed Cheese Ingredients Regional Analysis and Outlook
8.3.5. Italy Natural and Processed Cheese Ingredients Regional Analysis and Outlook
8.3.6. Russia Natural and Processed Cheese Ingredients Regional Analysis and Outlook
8.3.7. Rest of Europe Natural and Processed Cheese Ingredients Regional Analysis and Outlook
8.4. Asia Pacific Natural and Processed Cheese Ingredients Revenue (USD Million) by Country (2021-2032)
8.4.1. China Natural and Processed Cheese Ingredients Regional Analysis and Outlook
8.4.2. Japan Natural and Processed Cheese Ingredients Regional Analysis and Outlook
8.4.3. India Natural and Processed Cheese Ingredients Regional Analysis and Outlook
8.4.4. South Korea Natural and Processed Cheese Ingredients Regional Analysis and Outlook
8.4.5. Australia Natural and Processed Cheese Ingredients Regional Analysis and Outlook
8.4.6. South East Asia Natural and Processed Cheese Ingredients Regional Analysis and Outlook
8.4.7. Rest of Asia Pacific Natural and Processed Cheese Ingredients Regional Analysis and Outlook
8.5. South America Natural and Processed Cheese Ingredients Revenue (USD Million), by Country (2021-2032)
8.5.1. Brazil Natural and Processed Cheese Ingredients Regional Analysis and Outlook
8.5.2. Argentina Natural and Processed Cheese Ingredients Regional Analysis and Outlook
8.5.3. Rest of South America Natural and Processed Cheese Ingredients Regional Analysis and Outlook
8.6. Middle East and Africa Natural and Processed Cheese Ingredients Revenue (USD Million) by Country (2021-2032)
8.6.1. Middle East Natural and Processed Cheese Ingredients Regional Analysis and Outlook
8.6.2. Africa Natural and Processed Cheese Ingredients Regional Analysis and Outlook
Chapter 9. North America Natural and Processed Cheese Ingredients Analysis and Outlook
9.1. North America Natural and Processed Cheese Ingredients Revenue (USD Million) by Segments (2021-2032)
9.1.1. North America Natural and Processed Cheese Ingredients Revenue (USD Million) by Type (2021-2032)
9.1.2. North America Natural and Processed Cheese Ingredients Revenue (USD Million) by Application (2021-2032)
9.1.3. North America Natural and Processed Cheese Ingredients Revenue (USD Million) by Product (2021-2032)
By Type
Natural
Processed
By Application
Milk
Cultures
Enzymes
Additives
Chapter 10. Europe Natural and Processed Cheese Ingredients Analysis and Outlook
10.1. Europe Natural and Processed Cheese Ingredients Revenue (USD Million), by Segments (USD Million) (2021-2032)
10.1.1. Europe Natural and Processed Cheese Ingredients Revenue (USD Million) by Type (2021-2032)
10.1.2. Europe Natural and Processed Cheese Ingredients Revenue (USD Million) by Application (2021-2032)
10.1.3. Europe Natural and Processed Cheese Ingredients Revenue (USD Million) by Product (2021-2032)
By Type
Natural
Processed
By Application
Milk
Cultures
Enzymes
Additives
Chapter 11. Asia Pacific Natural and Processed Cheese Ingredients Analysis and Outlook
11.1. Asia Pacific Natural and Processed Cheese Ingredients Revenue (USD Million), and Revenue (USD Million) by Segments (2021-2032)
11.1.1. Asia Pacific Natural and Processed Cheese Ingredients Revenue (USD Million) by Type (2021-2032)
11.1.2. Asia Pacific Natural and Processed Cheese Ingredients Revenue (USD Million) by Application (2021-2032)
11.1.3. Asia Pacific Natural and Processed Cheese Ingredients Revenue (USD Million) by Product (2021-2032)
By Type
Natural
Processed
By Application
Milk
Cultures
Enzymes
Additives
Chapter 12. South America Natural and Processed Cheese Ingredients Analysis and Outlook
12.1. South America Natural and Processed Cheese Ingredients Revenue (USD Million), by Segments (2021-2032)
12.1.1. South America Natural and Processed Cheese Ingredients Revenue (USD Million) by Type (2021-2032)
12.1.2. South America Natural and Processed Cheese Ingredients Revenue (USD Million) by Application (2021-2032)
12.1.3. South America Natural and Processed Cheese Ingredients Revenue (USD Million) by Product (2021-2032)
By Type
Natural
Processed
By Application
Milk
Cultures
Enzymes
Additives
Chapter 13. Middle East and Africa Natural and Processed Cheese Ingredients Analysis and Outlook
13.1. Middle East and Africa Natural and Processed Cheese Ingredients Revenue (USD Million), by Segments (2021-2032)
13.1.1. Middle East and Africa Natural and Processed Cheese Ingredients Revenue (USD Million) by Type (2021-2032)
13.1.2. Middle East and Africa Natural and Processed Cheese Ingredients Revenue (USD Million) by Application (2021-2032)
13.1.3. Middle East and Africa Natural and Processed Cheese Ingredients Revenue (USD Million) by Product (2021-2032)
By Type
Natural
Processed
By Application
Milk
Cultures
Enzymes
Additives
Chapter 14. Natural and Processed Cheese Ingredients Company Profiles
14.1 Business Overview
14.2 Product Profiles
14.3 SWOT Profiles
14.5 Recent Developments
14.6 Financial Profile
List of Companies
Archer Daniels Midland Company (ADM)
Chr. Hansen Holdings A/S
DuPont
Fonterra Co-operative Group Limited
Koninklijke DSM N.V.
15. Methodology and Data Sources
15.1 Customization Offerings
15.2 Subscription Services
15.3 Related Reports
15.4 Publisher Expertise
LIST OF TABLES
Table 1 Market Segmentation Analysis
Table 2 Global Natural and Processed Cheese Ingredients Market Share of Leading Companies, 2023
Table 3 Product Offerings of Leading Companies
Table 4 Low Growth Scenario Forecasts
Table 5 Reference Case Growth Scenario
Table 6 High Growth Case Scenario
Table 7 Global Natural and Processed Cheese Ingredients Revenue (USD Million) And CAGR (%) By Type (2021-2032)
Table 8 Global Natural and Processed Cheese Ingredients Revenue (USD Million) And CAGR (%) By Application (2021-2032)
Table 9 Global Natural and Processed Cheese Ingredients Revenue (USD Million) And CAGR (%) By Product (2021-2032)
Table 10 Global Natural and Processed Cheese Ingredients Market Revenue (USD Million) By Regions (2021-2032)
Table 11 Global Natural and Processed Cheese Ingredients Market Share (%) By Regions (2021-2032)
Table 12 North America Natural and Processed Cheese Ingredients Revenue (USD Million) By Country (2021-2032)
Table 13 Europe Natural and Processed Cheese Ingredients Revenue (USD Million) By Country (2021-2032)
Table 14 Asia Pacific Natural and Processed Cheese Ingredients Revenue (USD Million) By Country (2021-2032)
Table 15 South America Natural and Processed Cheese Ingredients Revenue (USD Million) By Country (2021-2032)
Table 16 Middle East and Africa Natural and Processed Cheese Ingredients Revenue (USD Million) By Region (2021-2032)
Table 17 North America Natural and Processed Cheese Ingredients Revenue (USD Million) By Type (2021-2032)
Table 18 North America Natural and Processed Cheese Ingredients Revenue (USD Million) By Application (2021-2032)
Table 19 North America Natural and Processed Cheese Ingredients Revenue (USD Million) By Product (2021-2032)
Table 20 Europe Natural and Processed Cheese Ingredients Revenue (USD Million) By Type (2021-2032)
Table 21 Europe Natural and Processed Cheese Ingredients Revenue (USD Million) By Application (2021-2032)
Table 22 Europe Natural and Processed Cheese Ingredients Revenue (USD Million) By Product (2021-2032)
Table 23 Asia Pacific Natural and Processed Cheese Ingredients Revenue (USD Million) By Type (2021-2032)
Table 24 Asia Pacific Natural and Processed Cheese Ingredients Revenue (USD Million) By Application (2021-2032)
Table 25 Asia Pacific Natural and Processed Cheese Ingredients Revenue (USD Million) By Product (2021-2032)
Table 26 South America Natural and Processed Cheese Ingredients Revenue (USD Million) By Type (2021-2032)
Table 27 South America Natural and Processed Cheese Ingredients Revenue (USD Million) By Application (2021-2032)
Table 28 South America Natural and Processed Cheese Ingredients Revenue (USD Million) By Product (2021-2032)
Table 29 Middle East and Africa Natural and Processed Cheese Ingredients Revenue (USD Million) By Type (2021-2032)
Table 30 Middle East and Africa Natural and Processed Cheese Ingredients Revenue (USD Million) By Application (2021-2032)
Table 31 Middle East and Africa Natural and Processed Cheese Ingredients Revenue (USD Million) By Product (2021-2032)
LIST OF FIGURES
Figure 1. Market Scope
Figure 2. Pricing Forecasts Per Unit, 2023- 2032
Figure 3. Porter’s Five Forces
Figure 4. Global Natural and Processed Cheese Ingredients Market Revenue (USD Million) By Regions (2021-2032)
Figure 5. Global Natural and Processed Cheese Ingredients Market Share (%) By Regions (2023)
Figure 6. North America Natural and Processed Cheese Ingredients Revenue (USD Million) By Country (2021-2032)
Figure 7. United States Natural and Processed Cheese Ingredients Revenue (USD Million) By Country (2021-2032)
Figure 8. Canada Natural and Processed Cheese Ingredients Revenue (USD Million) By Country (2021-2032)
Figure 9. Mexico Natural and Processed Cheese Ingredients Revenue (USD Million) By Country (2021-2032)
Figure 10. Europe Natural and Processed Cheese Ingredients Revenue (USD Million) By Country (2021-2032)
Figure 11. Germany Natural and Processed Cheese Ingredients Revenue (USD Million) By Country (2021-2032)
Figure 12. France Natural and Processed Cheese Ingredients Revenue (USD Million) By Country (2021-2032)
Figure 13. United Kingdom Natural and Processed Cheese Ingredients Revenue (USD Million) By Country (2021-2032)
Figure 14. Spain Natural and Processed Cheese Ingredients Revenue (USD Million) By Country (2021-2032)
Figure 15. Italy Natural and Processed Cheese Ingredients Revenue (USD Million) By Country (2021-2032)
Figure 16. Russia Natural and Processed Cheese Ingredients Revenue (USD Million) By Country (2021-2032)
Figure 17. Rest of Europe Natural and Processed Cheese Ingredients Revenue (USD Million) By Country (2021-2032)
Figure 11. Asia Pacific Natural and Processed Cheese Ingredients Revenue (USD Million) By Country (2021-2032)
Figure 12. China Natural and Processed Cheese Ingredients Revenue (USD Million) By Country (2021-2032)
Figure 13. Japan Natural and Processed Cheese Ingredients Revenue (USD Million) By Country (2021-2032)
Figure 14. India Natural and Processed Cheese Ingredients Revenue (USD Million) By Country (2021-2032)
Figure 15. South Korea Natural and Processed Cheese Ingredients Revenue (USD Million) By Country (2021-2032)
Figure 16. Australia Natural and Processed Cheese Ingredients Revenue (USD Million) By Country (2021-2032)
Figure 17. South East Asia Natural and Processed Cheese Ingredients Revenue (USD Million) By Country (2021-2032)
Figure 18. South America Natural and Processed Cheese Ingredients Revenue (USD Million) By Country (2021-2032)
Figure 19. Brazil Natural and Processed Cheese Ingredients Revenue (USD Million) By Country (2021-2032)
Figure 20. Argentina Natural and Processed Cheese Ingredients Revenue (USD Million) By Country (2021-2032)
Figure 21. Rest of Asia Pacific Natural and Processed Cheese Ingredients Revenue (USD Million) By Country (2021-2032)
Figure 22. Middle East and Africa Natural and Processed Cheese Ingredients Revenue (USD Million) By Region (2021-2032)
Figure 23. Saudi Arabia Natural and Processed Cheese Ingredients Revenue (USD Million) By Region (2021-2032)
Figure 24. The UAE Natural and Processed Cheese Ingredients Revenue (USD Million) By Region (2021-2032)
Figure 25. Rest of Middle East Natural and Processed Cheese Ingredients Revenue (USD Million) By Region (2021-2032)
Figure 26. South Africa Natural and Processed Cheese Ingredients Revenue (USD Million) By Region (2021-2032)
Figure 27. Africa Natural and Processed Cheese Ingredients Revenue (USD Million) By Region (2021-2032)
Figure 28. North America Natural and Processed Cheese Ingredients Revenue (USD Million) By Type (2021-2032)
Figure 29. North America Natural and Processed Cheese Ingredients Revenue (USD Million) By Application (2021-2032)
Figure 30. North America Natural and Processed Cheese Ingredients Revenue (USD Million) By Product (2021-2032)
Figure 31. Europe Natural and Processed Cheese Ingredients Revenue (USD Million) By Type (2021-2032)
Figure 32. Europe Natural and Processed Cheese Ingredients Revenue (USD Million) By Application (2021-2032)
Figure 33. Europe Natural and Processed Cheese Ingredients Revenue (USD Million) By Product (2021-2032)
Figure 34. Asia Pacific Natural and Processed Cheese Ingredients Revenue (USD Million) By Type (2021-2032)
Figure 35. Asia Pacific Natural and Processed Cheese Ingredients Revenue (USD Million) By Application (2021-2032)
Figure 36. Asia Pacific Natural and Processed Cheese Ingredients Revenue (USD Million) By Product (2021-2032)
Figure 37. South America Natural and Processed Cheese Ingredients Revenue (USD Million) By Type (2021-2032)
Figure 38. South America Natural and Processed Cheese Ingredients Revenue (USD Million) By Application (2021-2032)
Figure 39. South America Natural and Processed Cheese Ingredients Revenue (USD Million) By Product (2021-2032)
Figure 40. Middle East and Africa Natural and Processed Cheese Ingredients Revenue (USD Million) By Type (2021-2032)
Figure 41. Middle East and Africa Natural and Processed Cheese Ingredients Revenue (USD Million) By Application (2021-2032)
Figure 42. Middle East and Africa Natural and Processed Cheese Ingredients Revenue (USD Million) By Product (2021-2032)
By Type
Natural
Processed
By Application
Milk
Cultures
Enzymes
Additives
Countries Analyzed
North America (US, Canada, Mexico)
Europe (Germany, UK, France, Spain, Italy, Russia, Rest of Europe)
Asia Pacific (China, India, Japan, South Korea, Australia, South East Asia, Rest of Asia)
South America (Brazil, Argentina, Rest of South America)
Middle East and Africa (Saudi Arabia, UAE, Rest of Middle East, South Africa, Egypt, Rest of Africa)
