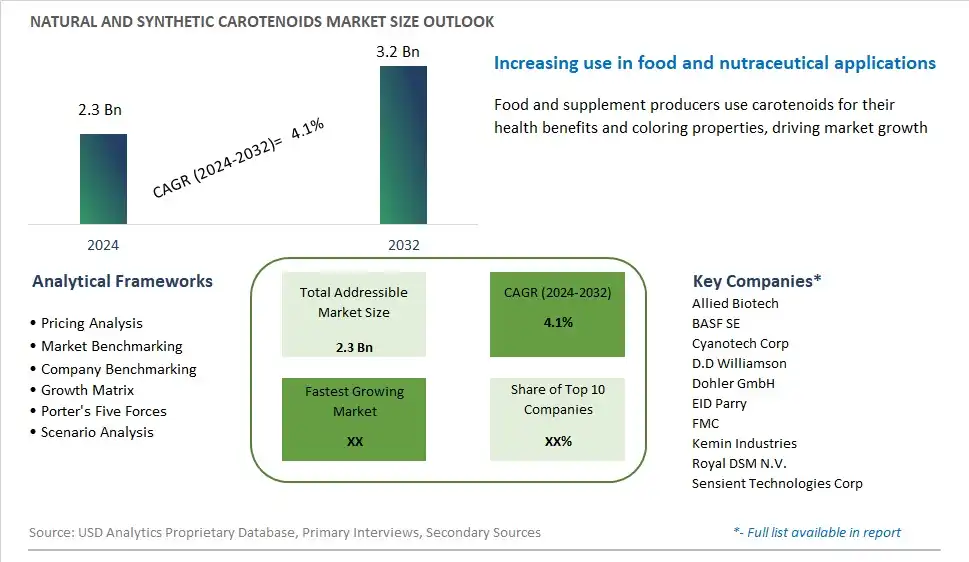
Global Natural and Synthetic Carotenoids Market Size is valued at $2.3 Billion in 2024 and is forecast to register a growth rate (CAGR) of 4.1% to reach $3.2 Billion by 2032.
The global Natural and Synthetic Carotenoids Market Comprehensive Study analyzes and forecasts the market size across 6 regions and 24 countries for diverse segments -By Type (Astaxanthin, Beta-Carotene, Lutein, Lycopene, Canthaxanthin, Zeaxanthin), By Application (Pharmaceuticals, Cosmetics, Feed, Food, Supplements)
An Introduction to Natural and Synthetic Carotenoids Market
The market for natural and synthetic carotenoids, vibrant pigments found in fruits, vegetables, and microorganisms, is witnessing dynamic growth and innovation in 2024. Carotenoids play diverse roles in food, feed, pharmaceuticals, and cosmetics, offering coloration, flavor enhancement, and nutritional benefits. While natural carotenoids sourced from plants and algae continue to dominate the market, advancements in biotechnology and fermentation have enabled the production of synthetic carotenoids that mimic their natural counterparts. This convergence of natural and synthetic approaches presents opportunities for manufacturers to meet the increasing demand for vibrant, stable colorants while addressing regulatory and sustainability concerns. Additionally, research into the health-promoting properties of carotenoids, including their role as antioxidants and potential benefits for eye health and skin care, is driving innovation in product development and market expansion.
Natural And Synthetic Carotenoids Competitive Landscape
The market report analyses the leading companies in the industry including Allied Biotech, BASF SE, Cyanotech Corp, D.D Williamson, Dohler GmbH, EID Parry, FMC, Kemin Industries, Royal DSM N.V., Sensient Technologies Corp, and Others.
Natural And Synthetic Carotenoids Market Dynamics
Natural And Synthetic Carotenoids Market Trend: Growing Demand for Natural Carotenoids
The most prominent trend in the natural and synthetic carotenoids market is the growing demand for natural carotenoids. Consumers are increasingly leaning towards natural ingredients due to rising health awareness and concerns about synthetic additives. Natural carotenoids, derived from sources like algae, plants, and fruits, are perceived as safer and more beneficial compared to their synthetic counterparts. This shift is driven by the clean label movement, where consumers prefer products with recognizable and minimally processed ingredients. Additionally, the use of natural carotenoids in dietary supplements, functional foods, and beverages has surged, supported by their antioxidant properties and health benefits, such as promoting eye health and reducing the risk of chronic diseases. As a result, manufacturers are investing in natural extraction methods and sustainable sourcing to meet this rising demand, which is reshaping the carotenoids market landscape.
Market Driver: Increasing Awareness of Health Benefits
A major driver of the natural and synthetic carotenoids market is the increasing awareness of the health benefits associated with carotenoids. Carotenoids like beta-carotene, lycopene, lutein, and zeaxanthin are well-known for their antioxidant properties, which help in protecting cells from damage and supporting overall health. Public knowledge about the role of carotenoids in promoting eye health, boosting the immune system, and reducing the risk of chronic diseases such as cardiovascular conditions and certain cancers has significantly increased. This awareness is fueled by scientific research and widespread dissemination of health information through media and health campaigns. As consumers become more proactive about their health, the demand for carotenoid-rich products, including supplements, fortified foods, and nutraceuticals, continues to grow. This health-driven demand is encouraging manufacturers to innovate and incorporate carotenoids into a wider range of products, thus driving market expansion.
Market Opportunity: Expansion into Emerging Markets and New Applications
There is a significant opportunity for growth in the natural and synthetic carotenoids market through expansion into emerging markets and new applications. Emerging economies in regions such as Asia-Pacific, Latin America, and Africa are witnessing a rise in disposable incomes and health consciousness among consumers, leading to increased demand for nutritional and health-enhancing products. This presents a lucrative market for carotenoid-enriched products. Additionally, the potential for carotenoids extends beyond dietary supplements and food fortification. Innovations in skincare and cosmetics, where carotenoids are valued for their anti-aging and skin-protective properties, offer new avenues for market growth. Carotenoids are also being explored in animal nutrition to enhance the health and pigmentation of livestock and pets. By developing region-specific products and expanding into these diverse applications, companies can tap into new revenue streams and strengthen their presence in the global carotenoids market.
Natural And Synthetic Carotenoids Market Share Analysis: Beta-Carotene held the dominant market share in 2024
The "Beta-Carotene" segment stands out as the largest within the Natural and Synthetic Carotenoids market, driven by its widespread applications in food, pharmaceuticals, and cosmetics. As a potent precursor of vitamin A, beta-carotene plays a crucial role in promoting eye health, immune function, and overall well-being, thus experiencing robust demand in dietary supplements and fortified foods. Further, its antioxidant properties make it a sought-after ingredient in skincare products, contributing to its dominance in the cosmetics industry. Additionally, the versatility of beta-carotene as a natural pigment and flavor enhancer in food and beverage formulations further propels its market growth. With increasing consumer awareness of the health benefits associated with beta-carotene and growing demand for natural and sustainable ingredients, the segment is poised to maintain its leading position in the Natural and Synthetic Carotenoids market.
Natural And Synthetic Carotenoids Market Share Analysis: Supplements market is poised to register the fastest growth rae over the forecast period to 2032
The "Supplements" segment is the fastest-growing within the Natural and Synthetic Carotenoids market, fueled by increasing consumer awareness of the health benefits associated with carotenoids and rising demand for nutritional supplements. Carotenoids, renowned for their antioxidant properties and role in supporting eye health, immune function, and skin protection, are highly sought-after ingredients in dietary supplements. Further, the growing prevalence of lifestyle-related health concerns, coupled with aging populations globally, drives the demand for supplements fortified with carotenoids. Additionally, advancements in formulation technologies and product innovation, such as the development of bioavailable and concentrated carotenoid supplements, further bolster the segment's growth. As consumers prioritize preventive healthcare and seek natural solutions to support overall well-being, the supplements segment is poised to sustain its rapid growth trajectory, reshaping the landscape of the Natural and Synthetic Carotenoids market.
Natural And Synthetic Carotenoids Market Segmentation
By Type
Astaxanthin
Beta-Carotene
Lutein
Lycopene
Canthaxanthin
Zeaxanthin
By Application
Pharmaceuticals
Cosmetics
Feed
Food
Supplements
Countries Analyzed
North America (US, Canada, Mexico)
Europe (Germany, UK, France, Spain, Italy, Russia, Rest of Europe)
Asia Pacific (China, India, Japan, South Korea, Australia, South East Asia, Rest of Asia)
South America (Brazil, Argentina, Rest of South America)
Middle East and Africa (Saudi Arabia, UAE, Rest of Middle East, South Africa, Egypt, Rest of Africa)
Natural And Synthetic Carotenoids Companies Profiled in the Study
Allied Biotech
BASF SE
Cyanotech Corp
D.D Williamson
Dohler GmbH
EID Parry
FMC
Kemin Industries
Royal DSM N.V.
Sensient Technologies Corp
*- List Not Exhaustive
Chapter 1. TABLE OF CONTENTS
Chapter 2. Introduction to Natural And Synthetic Carotenoids Market
2.1. Market Overview
2.2. Key Statistics and Report Highlights
2.3. Scope of the Comprehensive Study
2.3.1. Market Definition
2.3.2 Countries and Regions Covered
2.3.3 Research Objective
2.3.4 Units, Currency, and Conversions
2.3.5 Industry Value Chain
2.4. Key Market Segments
2.5. Key Companies
2.6. Study Period
Chapter 3. Strategic Analysis Review
3.1. Natural And Synthetic Carotenoids Pricing Analysis and Forecast
3.2. Porter’s Five Forces
3.3. Market Ecosystem
3.4. SWOT Analysis
3.5. Regulatory Scenario
3.3. Effects of Inflation, Russia-Ukraine War, moderating economic growth, and other macroeconomic factors
Chapter 4. Competitive Landscape
4.1. Market Share Analysis
4.1.1. Global Natural And Synthetic Carotenoids Market Share by Company, 2023
4.1.2. Product Offerings of Leading Natural And Synthetic Carotenoids Companies
4.2. Market Entropy
4.2.1. New Product Launches in the Industry
4.2.2. Mergers, Acquisitions, Joint ventures, and Partnerships
4.3. Key Strategies and Best Practices
Chapter 5. Global Market Projections: Best, Reference, and Low Case Scenarios
5.1. Growth Analysis- Case Scenario Definitions
5.2. Low Growth Case Scenario Forecasts
5.3. Reference Growth Case Scenario Forecasts
5.4. High Growth Case Scenario Forecasts
Chapter 6. Market Dynamics
6.1. Natural And Synthetic Carotenoids Market Drivers
6.2. Natural And Synthetic Carotenoids Market Challenges
6.6. Natural And Synthetic Carotenoids Market Opportunities
6.4. Natural And Synthetic Carotenoids Market Trends
Chapter 7. Global Natural And Synthetic Carotenoids Market Outlook Trends
7.1. Global Natural And Synthetic Carotenoids Revenue (USD Million) and CAGR (%) by Type (2021-2032)
7.2. Global Natural And Synthetic Carotenoids Revenue (USD Million) and CAGR (%) by Application (2021-2032)
7.3. Global Natural And Synthetic Carotenoids Revenue (USD Million) and CAGR (%) by Product (2021-2032)
By Type
Astaxanthin
Beta-Carotene
Lutein
Lycopene
Canthaxanthin
Zeaxanthin
By Application
Pharmaceuticals
Cosmetics
Feed
Food
Supplements
Chapter 8. Global Natural And Synthetic Carotenoids Regional Analysis and Outlook
8.1. Global Natural And Synthetic Carotenoids Revenue (USD Million) By Regions (2021- 2032)
8.2. North America Natural And Synthetic Carotenoids Revenue (USD Million) by Country (2021-2032)
8.2.1. United States Natural And Synthetic Carotenoids Regional Analysis and Outlook
8.2.2. Canada Natural And Synthetic Carotenoids Regional Analysis and Outlook
8.2.3. Mexico Natural And Synthetic Carotenoids Regional Analysis and Outlook
8.3. Europe Natural And Synthetic Carotenoids Revenue (USD Million), by Country (2021-2032)
8.3.1. Germany Natural And Synthetic Carotenoids Regional Analysis and Outlook
8.3.2. France Natural And Synthetic Carotenoids Regional Analysis and Outlook
8.3.3. United Kingdom Natural And Synthetic Carotenoids Regional Analysis and Outlook
8.3.4. Spain Natural And Synthetic Carotenoids Regional Analysis and Outlook
8.3.5. Italy Natural And Synthetic Carotenoids Regional Analysis and Outlook
8.3.6. Russia Natural And Synthetic Carotenoids Regional Analysis and Outlook
8.3.7. Rest of Europe Natural And Synthetic Carotenoids Regional Analysis and Outlook
8.4. Asia Pacific Natural And Synthetic Carotenoids Revenue (USD Million) by Country (2021-2032)
8.4.1. China Natural And Synthetic Carotenoids Regional Analysis and Outlook
8.4.2. Japan Natural And Synthetic Carotenoids Regional Analysis and Outlook
8.4.3. India Natural And Synthetic Carotenoids Regional Analysis and Outlook
8.4.4. South Korea Natural And Synthetic Carotenoids Regional Analysis and Outlook
8.4.5. Australia Natural And Synthetic Carotenoids Regional Analysis and Outlook
8.4.6. South East Asia Natural And Synthetic Carotenoids Regional Analysis and Outlook
8.4.7. Rest of Asia Pacific Natural And Synthetic Carotenoids Regional Analysis and Outlook
8.5. South America Natural And Synthetic Carotenoids Revenue (USD Million), by Country (2021-2032)
8.5.1. Brazil Natural And Synthetic Carotenoids Regional Analysis and Outlook
8.5.2. Argentina Natural And Synthetic Carotenoids Regional Analysis and Outlook
8.5.3. Rest of South America Natural And Synthetic Carotenoids Regional Analysis and Outlook
8.6. Middle East and Africa Natural And Synthetic Carotenoids Revenue (USD Million) by Country (2021-2032)
8.6.1. Middle East Natural And Synthetic Carotenoids Regional Analysis and Outlook
8.6.2. Africa Natural And Synthetic Carotenoids Regional Analysis and Outlook
Chapter 9. North America Natural And Synthetic Carotenoids Analysis and Outlook
9.1. North America Natural And Synthetic Carotenoids Revenue (USD Million) by Segments (2021-2032)
9.1.1. North America Natural And Synthetic Carotenoids Revenue (USD Million) by Type (2021-2032)
9.1.2. North America Natural And Synthetic Carotenoids Revenue (USD Million) by Application (2021-2032)
9.1.3. North America Natural And Synthetic Carotenoids Revenue (USD Million) by Product (2021-2032)
By Type
Astaxanthin
Beta-Carotene
Lutein
Lycopene
Canthaxanthin
Zeaxanthin
By Application
Pharmaceuticals
Cosmetics
Feed
Food
Supplements
Chapter 10. Europe Natural And Synthetic Carotenoids Analysis and Outlook
10.1. Europe Natural And Synthetic Carotenoids Revenue (USD Million), by Segments (USD Million) (2021-2032)
10.1.1. Europe Natural And Synthetic Carotenoids Revenue (USD Million) by Type (2021-2032)
10.1.2. Europe Natural And Synthetic Carotenoids Revenue (USD Million) by Application (2021-2032)
10.1.3. Europe Natural And Synthetic Carotenoids Revenue (USD Million) by Product (2021-2032)
By Type
Astaxanthin
Beta-Carotene
Lutein
Lycopene
Canthaxanthin
Zeaxanthin
By Application
Pharmaceuticals
Cosmetics
Feed
Food
Supplements
Chapter 11. Asia Pacific Natural And Synthetic Carotenoids Analysis and Outlook
11.1. Asia Pacific Natural And Synthetic Carotenoids Revenue (USD Million), and Revenue (USD Million) by Segments (2021-2032)
11.1.1. Asia Pacific Natural And Synthetic Carotenoids Revenue (USD Million) by Type (2021-2032)
11.1.2. Asia Pacific Natural And Synthetic Carotenoids Revenue (USD Million) by Application (2021-2032)
11.1.3. Asia Pacific Natural And Synthetic Carotenoids Revenue (USD Million) by Product (2021-2032)
By Type
Astaxanthin
Beta-Carotene
Lutein
Lycopene
Canthaxanthin
Zeaxanthin
By Application
Pharmaceuticals
Cosmetics
Feed
Food
Supplements
Chapter 12. South America Natural And Synthetic Carotenoids Analysis and Outlook
12.1. South America Natural And Synthetic Carotenoids Revenue (USD Million), by Segments (2021-2032)
12.1.1. South America Natural And Synthetic Carotenoids Revenue (USD Million) by Type (2021-2032)
12.1.2. South America Natural And Synthetic Carotenoids Revenue (USD Million) by Application (2021-2032)
12.1.3. South America Natural And Synthetic Carotenoids Revenue (USD Million) by Product (2021-2032)
By Type
Astaxanthin
Beta-Carotene
Lutein
Lycopene
Canthaxanthin
Zeaxanthin
By Application
Pharmaceuticals
Cosmetics
Feed
Food
Supplements
Chapter 13. Middle East and Africa Natural And Synthetic Carotenoids Analysis and Outlook
13.1. Middle East and Africa Natural And Synthetic Carotenoids Revenue (USD Million), by Segments (2021-2032)
13.1.1. Middle East and Africa Natural And Synthetic Carotenoids Revenue (USD Million) by Type (2021-2032)
13.1.2. Middle East and Africa Natural And Synthetic Carotenoids Revenue (USD Million) by Application (2021-2032)
13.1.3. Middle East and Africa Natural And Synthetic Carotenoids Revenue (USD Million) by Product (2021-2032)
By Type
Astaxanthin
Beta-Carotene
Lutein
Lycopene
Canthaxanthin
Zeaxanthin
By Application
Pharmaceuticals
Cosmetics
Feed
Food
Supplements
Chapter 14. Natural And Synthetic Carotenoids Company Profiles
14.1 Business Overview
14.2 Product Profiles
14.3 SWOT Profiles
14.5 Recent Developments
14.6 Financial Profile
List of Companies
Allied Biotech
BASF SE
Cyanotech Corp
D.D Williamson
Dohler GmbH
EID Parry
FMC
Kemin Industries
Royal DSM N.V.
Sensient Technologies Corp
15. Methodology and Data Sources
15.1 Customization Offerings
15.2 Subscription Services
15.3 Related Reports
15.4 Publisher Expertise
LIST OF TABLES
Table 1 Market Segmentation Analysis
Table 2 Global Natural And Synthetic Carotenoids Market Share of Leading Companies, 2023
Table 3 Product Offerings of Leading Companies
Table 4 Low Growth Scenario Forecasts
Table 5 Reference Case Growth Scenario
Table 6 High Growth Case Scenario
Table 7 Global Natural And Synthetic Carotenoids Revenue (USD Million) And CAGR (%) By Type (2021-2032)
Table 8 Global Natural And Synthetic Carotenoids Revenue (USD Million) And CAGR (%) By Application (2021-2032)
Table 9 Global Natural And Synthetic Carotenoids Revenue (USD Million) And CAGR (%) By Product (2021-2032)
Table 10 Global Natural And Synthetic Carotenoids Market Revenue (USD Million) By Regions (2021-2032)
Table 11 Global Natural And Synthetic Carotenoids Market Share (%) By Regions (2021-2032)
Table 12 North America Natural And Synthetic Carotenoids Revenue (USD Million) By Country (2021-2032)
Table 13 Europe Natural And Synthetic Carotenoids Revenue (USD Million) By Country (2021-2032)
Table 14 Asia Pacific Natural And Synthetic Carotenoids Revenue (USD Million) By Country (2021-2032)
Table 15 South America Natural And Synthetic Carotenoids Revenue (USD Million) By Country (2021-2032)
Table 16 Middle East and Africa Natural And Synthetic Carotenoids Revenue (USD Million) By Region (2021-2032)
Table 17 North America Natural And Synthetic Carotenoids Revenue (USD Million) By Type (2021-2032)
Table 18 North America Natural And Synthetic Carotenoids Revenue (USD Million) By Application (2021-2032)
Table 19 North America Natural And Synthetic Carotenoids Revenue (USD Million) By Product (2021-2032)
Table 20 Europe Natural And Synthetic Carotenoids Revenue (USD Million) By Type (2021-2032)
Table 21 Europe Natural And Synthetic Carotenoids Revenue (USD Million) By Application (2021-2032)
Table 22 Europe Natural And Synthetic Carotenoids Revenue (USD Million) By Product (2021-2032)
Table 23 Asia Pacific Natural And Synthetic Carotenoids Revenue (USD Million) By Type (2021-2032)
Table 24 Asia Pacific Natural And Synthetic Carotenoids Revenue (USD Million) By Application (2021-2032)
Table 25 Asia Pacific Natural And Synthetic Carotenoids Revenue (USD Million) By Product (2021-2032)
Table 26 South America Natural And Synthetic Carotenoids Revenue (USD Million) By Type (2021-2032)
Table 27 South America Natural And Synthetic Carotenoids Revenue (USD Million) By Application (2021-2032)
Table 28 South America Natural And Synthetic Carotenoids Revenue (USD Million) By Product (2021-2032)
Table 29 Middle East and Africa Natural And Synthetic Carotenoids Revenue (USD Million) By Type (2021-2032)
Table 30 Middle East and Africa Natural And Synthetic Carotenoids Revenue (USD Million) By Application (2021-2032)
Table 31 Middle East and Africa Natural And Synthetic Carotenoids Revenue (USD Million) By Product (2021-2032)
LIST OF FIGURES
Figure 1. Market Scope
Figure 2. Pricing Forecasts Per Unit, 2023- 2032
Figure 3. Porter’s Five Forces
Figure 4. Global Natural And Synthetic Carotenoids Market Revenue (USD Million) By Regions (2021-2032)
Figure 5. Global Natural And Synthetic Carotenoids Market Share (%) By Regions (2023)
Figure 6. North America Natural And Synthetic Carotenoids Revenue (USD Million) By Country (2021-2032)
Figure 7. United States Natural And Synthetic Carotenoids Revenue (USD Million) By Country (2021-2032)
Figure 8. Canada Natural And Synthetic Carotenoids Revenue (USD Million) By Country (2021-2032)
Figure 9. Mexico Natural And Synthetic Carotenoids Revenue (USD Million) By Country (2021-2032)
Figure 10. Europe Natural And Synthetic Carotenoids Revenue (USD Million) By Country (2021-2032)
Figure 11. Germany Natural And Synthetic Carotenoids Revenue (USD Million) By Country (2021-2032)
Figure 12. France Natural And Synthetic Carotenoids Revenue (USD Million) By Country (2021-2032)
Figure 13. United Kingdom Natural And Synthetic Carotenoids Revenue (USD Million) By Country (2021-2032)
Figure 14. Spain Natural And Synthetic Carotenoids Revenue (USD Million) By Country (2021-2032)
Figure 15. Italy Natural And Synthetic Carotenoids Revenue (USD Million) By Country (2021-2032)
Figure 16. Russia Natural And Synthetic Carotenoids Revenue (USD Million) By Country (2021-2032)
Figure 17. Rest of Europe Natural And Synthetic Carotenoids Revenue (USD Million) By Country (2021-2032)
Figure 11. Asia Pacific Natural And Synthetic Carotenoids Revenue (USD Million) By Country (2021-2032)
Figure 12. China Natural And Synthetic Carotenoids Revenue (USD Million) By Country (2021-2032)
Figure 13. Japan Natural And Synthetic Carotenoids Revenue (USD Million) By Country (2021-2032)
Figure 14. India Natural And Synthetic Carotenoids Revenue (USD Million) By Country (2021-2032)
Figure 15. South Korea Natural And Synthetic Carotenoids Revenue (USD Million) By Country (2021-2032)
Figure 16. Australia Natural And Synthetic Carotenoids Revenue (USD Million) By Country (2021-2032)
Figure 17. South East Asia Natural And Synthetic Carotenoids Revenue (USD Million) By Country (2021-2032)
Figure 18. South America Natural And Synthetic Carotenoids Revenue (USD Million) By Country (2021-2032)
Figure 19. Brazil Natural And Synthetic Carotenoids Revenue (USD Million) By Country (2021-2032)
Figure 20. Argentina Natural And Synthetic Carotenoids Revenue (USD Million) By Country (2021-2032)
Figure 21. Rest of Asia Pacific Natural And Synthetic Carotenoids Revenue (USD Million) By Country (2021-2032)
Figure 22. Middle East and Africa Natural And Synthetic Carotenoids Revenue (USD Million) By Region (2021-2032)
Figure 23. Saudi Arabia Natural And Synthetic Carotenoids Revenue (USD Million) By Region (2021-2032)
Figure 24. The UAE Natural And Synthetic Carotenoids Revenue (USD Million) By Region (2021-2032)
Figure 25. Rest of Middle East Natural And Synthetic Carotenoids Revenue (USD Million) By Region (2021-2032)
Figure 26. South Africa Natural And Synthetic Carotenoids Revenue (USD Million) By Region (2021-2032)
Figure 27. Africa Natural And Synthetic Carotenoids Revenue (USD Million) By Region (2021-2032)
Figure 28. North America Natural And Synthetic Carotenoids Revenue (USD Million) By Type (2021-2032)
Figure 29. North America Natural And Synthetic Carotenoids Revenue (USD Million) By Application (2021-2032)
Figure 30. North America Natural And Synthetic Carotenoids Revenue (USD Million) By Product (2021-2032)
Figure 31. Europe Natural And Synthetic Carotenoids Revenue (USD Million) By Type (2021-2032)
Figure 32. Europe Natural And Synthetic Carotenoids Revenue (USD Million) By Application (2021-2032)
Figure 33. Europe Natural And Synthetic Carotenoids Revenue (USD Million) By Product (2021-2032)
Figure 34. Asia Pacific Natural And Synthetic Carotenoids Revenue (USD Million) By Type (2021-2032)
Figure 35. Asia Pacific Natural And Synthetic Carotenoids Revenue (USD Million) By Application (2021-2032)
Figure 36. Asia Pacific Natural And Synthetic Carotenoids Revenue (USD Million) By Product (2021-2032)
Figure 37. South America Natural And Synthetic Carotenoids Revenue (USD Million) By Type (2021-2032)
Figure 38. South America Natural And Synthetic Carotenoids Revenue (USD Million) By Application (2021-2032)
Figure 39. South America Natural And Synthetic Carotenoids Revenue (USD Million) By Product (2021-2032)
Figure 40. Middle East and Africa Natural And Synthetic Carotenoids Revenue (USD Million) By Type (2021-2032)
Figure 41. Middle East and Africa Natural And Synthetic Carotenoids Revenue (USD Million) By Application (2021-2032)
Figure 42. Middle East and Africa Natural And Synthetic Carotenoids Revenue (USD Million) By Product (2021-2032)
By Type
Astaxanthin
Beta-Carotene
Lutein
Lycopene
Canthaxanthin
Zeaxanthin
By Application
Pharmaceuticals
Cosmetics
Feed
Food
Supplements
Countries Analyzed
North America (US, Canada, Mexico)
Europe (Germany, UK, France, Spain, Italy, Russia, Rest of Europe)
Asia Pacific (China, India, Japan, South Korea, Australia, South East Asia, Rest of Asia)
South America (Brazil, Argentina, Rest of South America)
Middle East and Africa (Saudi Arabia, UAE, Rest of Middle East, South Africa, Egypt, Rest of Africa)
