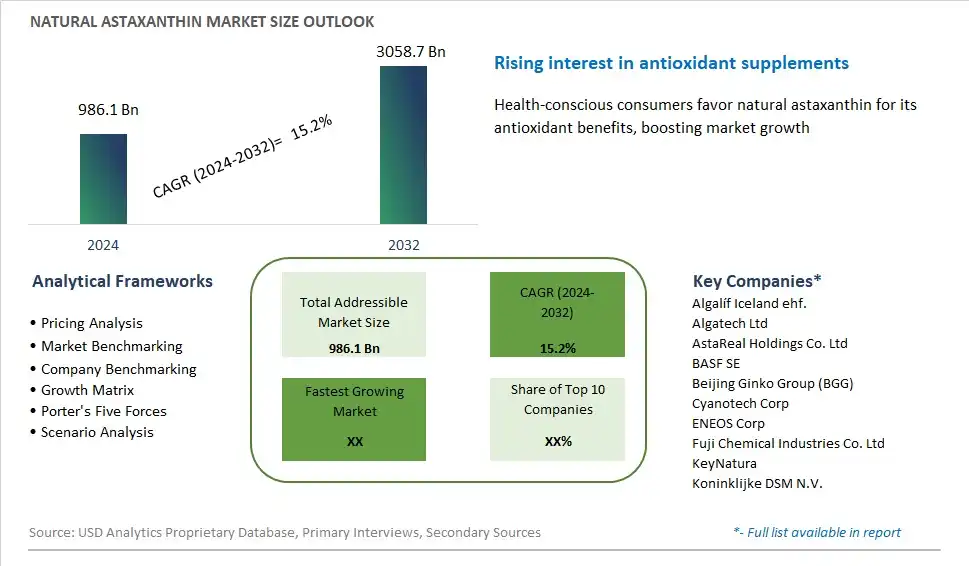
Global Natural Astaxanthin Market Size is valued at $986.1 Billion in 2024 and is forecast to register a growth rate (CAGR) of 15.2% to reach $3058.7 Billion by 2032.
The global Natural Astaxanthin Market Comprehensive Study analyzes and forecasts the market size across 6 regions and 24 countries for diverse segments -By Source (Microalgae, Yeast, Plants, Others), By Application (Dietary Supplements, Food and Beverages, Cosmetics and Personal Care, Animal Feed, Pharmaceuticals)
An Introduction to Natural Astaxanthin Market
In 2024, the market for natural astaxanthin, a potent antioxidant pigment found in algae, seafood, and certain microorganisms, continues to expand as consumers seek natural solutions for health and wellness. Astaxanthin's unique molecular structure grants it exceptional antioxidant properties, making it highly sought after in dietary supplements, functional foods, and cosmetics. As awareness of its benefits grows, particularly in skincare and sports nutrition, manufacturers are investing in advanced cultivation and extraction technologies to meet the rising demand for high-quality natural astaxanthin. Moreover, research into astaxanthin's potential applications in areas such as cardiovascular health, eye health, and anti-aging is fueling innovation and driving market growth, positioning it as a valuable ingredient in the burgeoning market for nutraceuticals and cosmeceuticals.
Natural Astaxanthin Competitive Landscape
The market report analyses the leading companies in the industry including Algalíf Iceland ehf., Algatech Ltd, AstaReal Holdings Co. Ltd, BASF SE, Beijing Ginko Group (BGG), Cyanotech Corp, ENEOS Corp, Fuji Chemical Industries Co. Ltd, KeyNatura, Koninklijke DSM N.V., and Others.
Natural Astaxanthin Market Dynamics
Natural Astaxanthin Market Trend: Increasing Demand for Natural Antioxidants
The most prominent trend in the natural astaxanthin market is the increasing demand for natural antioxidants. Astaxanthin, known for its powerful antioxidant properties, is gaining popularity among health-conscious consumers and the wellness industry. This trend is driven by the growing awareness of the harmful effects of oxidative stress and the role of antioxidants in combating it. Natural astaxanthin, derived from sources like Haematococcus pluvialis microalgae and krill, is preferred over synthetic alternatives due to its superior bioavailability and safety profile. The trend is further amplified by the clean label movement, where consumers seek products with natural and minimally processed ingredients. As a result, natural astaxanthin is being incorporated into a variety of products, including dietary supplements, functional foods, beverages, and cosmetics, fueling its market growth and establishing it as a key ingredient in the health and wellness sector.
Market Driver: Rising Prevalence of Chronic Diseases and Aging Population
A major driver of the natural astaxanthin market is the rising prevalence of chronic diseases and the aging population. With an increase in lifestyle-related ailments such as cardiovascular diseases, diabetes, and cancer, there is a heightened demand for preventive healthcare solutions. Natural astaxanthin is known for its multiple health benefits, including anti-inflammatory, anti-cancer, and immune-boosting properties, making it a valuable addition to preventive health regimes. Additionally, as the global population ages, there is a growing focus on maintaining health and vitality in later years. Astaxanthin’s potential in supporting eye health, reducing skin aging, and enhancing cognitive function makes it particularly appealing to older adults. This demographic shift is driving the consumption of astaxanthin-rich products, leading to increased market demand and encouraging further research and development in the field.
Market Opportunity: Expansion into New Product Categories and Emerging Markets
There is a significant opportunity for growth in the natural astaxanthin market through expansion into new product categories and emerging markets. The versatility of astaxanthin allows for its incorporation into a wide range of applications beyond traditional dietary supplements. The cosmetic industry, for example, is increasingly utilizing astaxanthin for its skin health benefits, such as reducing wrinkles and protecting against UV damage. Similarly, the food and beverage industry can explore fortified products that offer additional health benefits, appealing to health-conscious consumers. Emerging markets in regions like Asia-Pacific and Latin America, where health awareness and disposable incomes are rising, present untapped potential for market expansion. By developing region-specific products and leveraging local distribution networks, companies can capture a larger share of these growing markets. Strategic partnerships and innovative product formulations can further enhance market presence, driving the global growth of natural astaxanthin.
Natural Astaxanthin Market Share Analysis: Microalgae held the dominant market share in 2024
The "Microalgae" segment is the largest within the Natural Astaxanthin market, driven by its superior quality, purity, and sustainability. Microalgae, particularly Haematococcus pluvialis, are a primary natural source of astaxanthin, known for their ability to produce high concentrations of this potent antioxidant pigment. As consumers increasingly prioritize natural ingredients and seek products with proven health benefits, astaxanthin derived from microalgae stands out for its efficacy and safety. Further, microalgae cultivation offers a sustainable and environmentally friendly approach, as it requires minimal land and water resources compared to other sources. Additionally, technological advancements in microalgae cultivation and extraction processes have enhanced efficiency and scalability, ensuring a consistent supply of high-quality astaxanthin for various applications, including dietary supplements, food, cosmetics, and animal feed. As the demand for natural astaxanthin continues to soar, driven by its potent antioxidant properties and diverse health benefits, the dominance of the microalgae segment in the Natural Astaxanthin market is expected to endure.
Natural Astaxanthin Market Share Analysis: Dietary Supplements market is poised to register the fastest growth rae over the forecast period to 2032
The "Dietary Supplements" segment is the fastest-growing within the Natural Astaxanthin market, fueled by increasing consumer awareness of its potent antioxidant properties and health benefits. Astaxanthin, renowned for its superior antioxidant activity and potential to support eye health, skin protection, and immune function, is gaining prominence as a key ingredient in nutritional supplements. Further, as consumers prioritize preventive healthcare and seek natural solutions to enhance overall well-being, the demand for astaxanthin supplements continues to surge. Additionally, advancements in formulation technologies, such as microencapsulation and lipid-based delivery systems, enhance the bioavailability and efficacy of astaxanthin supplements, further driving market growth. With ongoing research highlighting the diverse health benefits of astaxanthin and rising consumer demand for natural and efficacious dietary supplements, the dietary supplements segment is poised to sustain its rapid growth trajectory, reshaping the landscape of the Natural Astaxanthin market.
Natural Astaxanthin Market Segmentation
By Source
Microalgae
Yeast
Plants
Others
By Application
Dietary Supplements
Food and Beverages
Cosmetics and Personal Care
Animal Feed
Pharmaceuticals
Countries Analyzed
North America (US, Canada, Mexico)
Europe (Germany, UK, France, Spain, Italy, Russia, Rest of Europe)
Asia Pacific (China, India, Japan, South Korea, Australia, South East Asia, Rest of Asia)
South America (Brazil, Argentina, Rest of South America)
Middle East and Africa (Saudi Arabia, UAE, Rest of Middle East, South Africa, Egypt, Rest of Africa)
Natural Astaxanthin Companies Profiled in the Study
Algalíf Iceland ehf.
Algatech Ltd
AstaReal Holdings Co. Ltd
BASF SE
Beijing Ginko Group (BGG)
Cyanotech Corp
ENEOS Corp
Fuji Chemical Industries Co. Ltd
KeyNatura
Koninklijke DSM N.V.
*- List Not Exhaustive
Chapter 1. TABLE OF CONTENTS
Chapter 2. Introduction to Natural Astaxanthin Market
2.1. Market Overview
2.2. Key Statistics and Report Highlights
2.3. Scope of the Comprehensive Study
2.3.1. Market Definition
2.3.2 Countries and Regions Covered
2.3.3 Research Objective
2.3.4 Units, Currency, and Conversions
2.3.5 Industry Value Chain
2.4. Key Market Segments
2.5. Key Companies
2.6. Study Period
Chapter 3. Strategic Analysis Review
3.1. Natural Astaxanthin Pricing Analysis and Forecast
3.2. Porter’s Five Forces
3.3. Market Ecosystem
3.4. SWOT Analysis
3.5. Regulatory Scenario
3.3. Effects of Inflation, Russia-Ukraine War, moderating economic growth, and other macroeconomic factors
Chapter 4. Competitive Landscape
4.1. Market Share Analysis
4.1.1. Global Natural Astaxanthin Market Share by Company, 2023
4.1.2. Product Offerings of Leading Natural Astaxanthin Companies
4.2. Market Entropy
4.2.1. New Product Launches in the Industry
4.2.2. Mergers, Acquisitions, Joint ventures, and Partnerships
4.3. Key Strategies and Best Practices
Chapter 5. Global Market Projections: Best, Reference, and Low Case Scenarios
5.1. Growth Analysis- Case Scenario Definitions
5.2. Low Growth Case Scenario Forecasts
5.3. Reference Growth Case Scenario Forecasts
5.4. High Growth Case Scenario Forecasts
Chapter 6. Market Dynamics
6.1. Natural Astaxanthin Market Drivers
6.2. Natural Astaxanthin Market Challenges
6.6. Natural Astaxanthin Market Opportunities
6.4. Natural Astaxanthin Market Trends
Chapter 7. Global Natural Astaxanthin Market Outlook Trends
7.1. Global Natural Astaxanthin Revenue (USD Million) and CAGR (%) by Type (2021-2032)
7.2. Global Natural Astaxanthin Revenue (USD Million) and CAGR (%) by Application (2021-2032)
7.3. Global Natural Astaxanthin Revenue (USD Million) and CAGR (%) by Product (2021-2032)
By Source
Microalgae
Yeast
Plants
Others
By Application
Dietary Supplements
Food and Beverages
Cosmetics and Personal Care
Animal Feed
Pharmaceuticals
Chapter 8. Global Natural Astaxanthin Regional Analysis and Outlook
8.1. Global Natural Astaxanthin Revenue (USD Million) By Regions (2021- 2032)
8.2. North America Natural Astaxanthin Revenue (USD Million) by Country (2021-2032)
8.2.1. United States Natural Astaxanthin Regional Analysis and Outlook
8.2.2. Canada Natural Astaxanthin Regional Analysis and Outlook
8.2.3. Mexico Natural Astaxanthin Regional Analysis and Outlook
8.3. Europe Natural Astaxanthin Revenue (USD Million), by Country (2021-2032)
8.3.1. Germany Natural Astaxanthin Regional Analysis and Outlook
8.3.2. France Natural Astaxanthin Regional Analysis and Outlook
8.3.3. United Kingdom Natural Astaxanthin Regional Analysis and Outlook
8.3.4. Spain Natural Astaxanthin Regional Analysis and Outlook
8.3.5. Italy Natural Astaxanthin Regional Analysis and Outlook
8.3.6. Russia Natural Astaxanthin Regional Analysis and Outlook
8.3.7. Rest of Europe Natural Astaxanthin Regional Analysis and Outlook
8.4. Asia Pacific Natural Astaxanthin Revenue (USD Million) by Country (2021-2032)
8.4.1. China Natural Astaxanthin Regional Analysis and Outlook
8.4.2. Japan Natural Astaxanthin Regional Analysis and Outlook
8.4.3. India Natural Astaxanthin Regional Analysis and Outlook
8.4.4. South Korea Natural Astaxanthin Regional Analysis and Outlook
8.4.5. Australia Natural Astaxanthin Regional Analysis and Outlook
8.4.6. South East Asia Natural Astaxanthin Regional Analysis and Outlook
8.4.7. Rest of Asia Pacific Natural Astaxanthin Regional Analysis and Outlook
8.5. South America Natural Astaxanthin Revenue (USD Million), by Country (2021-2032)
8.5.1. Brazil Natural Astaxanthin Regional Analysis and Outlook
8.5.2. Argentina Natural Astaxanthin Regional Analysis and Outlook
8.5.3. Rest of South America Natural Astaxanthin Regional Analysis and Outlook
8.6. Middle East and Africa Natural Astaxanthin Revenue (USD Million) by Country (2021-2032)
8.6.1. Middle East Natural Astaxanthin Regional Analysis and Outlook
8.6.2. Africa Natural Astaxanthin Regional Analysis and Outlook
Chapter 9. North America Natural Astaxanthin Analysis and Outlook
9.1. North America Natural Astaxanthin Revenue (USD Million) by Segments (2021-2032)
9.1.1. North America Natural Astaxanthin Revenue (USD Million) by Type (2021-2032)
9.1.2. North America Natural Astaxanthin Revenue (USD Million) by Application (2021-2032)
9.1.3. North America Natural Astaxanthin Revenue (USD Million) by Product (2021-2032)
By Source
Microalgae
Yeast
Plants
Others
By Application
Dietary Supplements
Food and Beverages
Cosmetics and Personal Care
Animal Feed
Pharmaceuticals
Chapter 10. Europe Natural Astaxanthin Analysis and Outlook
10.1. Europe Natural Astaxanthin Revenue (USD Million), by Segments (USD Million) (2021-2032)
10.1.1. Europe Natural Astaxanthin Revenue (USD Million) by Type (2021-2032)
10.1.2. Europe Natural Astaxanthin Revenue (USD Million) by Application (2021-2032)
10.1.3. Europe Natural Astaxanthin Revenue (USD Million) by Product (2021-2032)
By Source
Microalgae
Yeast
Plants
Others
By Application
Dietary Supplements
Food and Beverages
Cosmetics and Personal Care
Animal Feed
Pharmaceuticals
Chapter 11. Asia Pacific Natural Astaxanthin Analysis and Outlook
11.1. Asia Pacific Natural Astaxanthin Revenue (USD Million), and Revenue (USD Million) by Segments (2021-2032)
11.1.1. Asia Pacific Natural Astaxanthin Revenue (USD Million) by Type (2021-2032)
11.1.2. Asia Pacific Natural Astaxanthin Revenue (USD Million) by Application (2021-2032)
11.1.3. Asia Pacific Natural Astaxanthin Revenue (USD Million) by Product (2021-2032)
By Source
Microalgae
Yeast
Plants
Others
By Application
Dietary Supplements
Food and Beverages
Cosmetics and Personal Care
Animal Feed
Pharmaceuticals
Chapter 12. South America Natural Astaxanthin Analysis and Outlook
12.1. South America Natural Astaxanthin Revenue (USD Million), by Segments (2021-2032)
12.1.1. South America Natural Astaxanthin Revenue (USD Million) by Type (2021-2032)
12.1.2. South America Natural Astaxanthin Revenue (USD Million) by Application (2021-2032)
12.1.3. South America Natural Astaxanthin Revenue (USD Million) by Product (2021-2032)
By Source
Microalgae
Yeast
Plants
Others
By Application
Dietary Supplements
Food and Beverages
Cosmetics and Personal Care
Animal Feed
Pharmaceuticals
Chapter 13. Middle East and Africa Natural Astaxanthin Analysis and Outlook
13.1. Middle East and Africa Natural Astaxanthin Revenue (USD Million), by Segments (2021-2032)
13.1.1. Middle East and Africa Natural Astaxanthin Revenue (USD Million) by Type (2021-2032)
13.1.2. Middle East and Africa Natural Astaxanthin Revenue (USD Million) by Application (2021-2032)
13.1.3. Middle East and Africa Natural Astaxanthin Revenue (USD Million) by Product (2021-2032)
By Source
Microalgae
Yeast
Plants
Others
By Application
Dietary Supplements
Food and Beverages
Cosmetics and Personal Care
Animal Feed
Pharmaceuticals
Chapter 14. Natural Astaxanthin Company Profiles
14.1 Business Overview
14.2 Product Profiles
14.3 SWOT Profiles
14.5 Recent Developments
14.6 Financial Profile
List of Companies
Algalíf Iceland ehf.
Algatech Ltd
AstaReal Holdings Co. Ltd
BASF SE
Beijing Ginko Group (BGG)
Cyanotech Corp
ENEOS Corp
Fuji Chemical Industries Co. Ltd
KeyNatura
Koninklijke DSM N.V.
15. Methodology and Data Sources
15.1 Customization Offerings
15.2 Subscription Services
15.3 Related Reports
15.4 Publisher Expertise
LIST OF TABLES
Table 1 Market Segmentation Analysis
Table 2 Global Natural Astaxanthin Market Share of Leading Companies, 2023
Table 3 Product Offerings of Leading Companies
Table 4 Low Growth Scenario Forecasts
Table 5 Reference Case Growth Scenario
Table 6 High Growth Case Scenario
Table 7 Global Natural Astaxanthin Revenue (USD Million) And CAGR (%) By Type (2021-2032)
Table 8 Global Natural Astaxanthin Revenue (USD Million) And CAGR (%) By Application (2021-2032)
Table 9 Global Natural Astaxanthin Revenue (USD Million) And CAGR (%) By Product (2021-2032)
Table 10 Global Natural Astaxanthin Market Revenue (USD Million) By Regions (2021-2032)
Table 11 Global Natural Astaxanthin Market Share (%) By Regions (2021-2032)
Table 12 North America Natural Astaxanthin Revenue (USD Million) By Country (2021-2032)
Table 13 Europe Natural Astaxanthin Revenue (USD Million) By Country (2021-2032)
Table 14 Asia Pacific Natural Astaxanthin Revenue (USD Million) By Country (2021-2032)
Table 15 South America Natural Astaxanthin Revenue (USD Million) By Country (2021-2032)
Table 16 Middle East and Africa Natural Astaxanthin Revenue (USD Million) By Region (2021-2032)
Table 17 North America Natural Astaxanthin Revenue (USD Million) By Type (2021-2032)
Table 18 North America Natural Astaxanthin Revenue (USD Million) By Application (2021-2032)
Table 19 North America Natural Astaxanthin Revenue (USD Million) By Product (2021-2032)
Table 20 Europe Natural Astaxanthin Revenue (USD Million) By Type (2021-2032)
Table 21 Europe Natural Astaxanthin Revenue (USD Million) By Application (2021-2032)
Table 22 Europe Natural Astaxanthin Revenue (USD Million) By Product (2021-2032)
Table 23 Asia Pacific Natural Astaxanthin Revenue (USD Million) By Type (2021-2032)
Table 24 Asia Pacific Natural Astaxanthin Revenue (USD Million) By Application (2021-2032)
Table 25 Asia Pacific Natural Astaxanthin Revenue (USD Million) By Product (2021-2032)
Table 26 South America Natural Astaxanthin Revenue (USD Million) By Type (2021-2032)
Table 27 South America Natural Astaxanthin Revenue (USD Million) By Application (2021-2032)
Table 28 South America Natural Astaxanthin Revenue (USD Million) By Product (2021-2032)
Table 29 Middle East and Africa Natural Astaxanthin Revenue (USD Million) By Type (2021-2032)
Table 30 Middle East and Africa Natural Astaxanthin Revenue (USD Million) By Application (2021-2032)
Table 31 Middle East and Africa Natural Astaxanthin Revenue (USD Million) By Product (2021-2032)
LIST OF FIGURES
Figure 1. Market Scope
Figure 2. Pricing Forecasts Per Unit, 2023- 2032
Figure 3. Porter’s Five Forces
Figure 4. Global Natural Astaxanthin Market Revenue (USD Million) By Regions (2021-2032)
Figure 5. Global Natural Astaxanthin Market Share (%) By Regions (2023)
Figure 6. North America Natural Astaxanthin Revenue (USD Million) By Country (2021-2032)
Figure 7. United States Natural Astaxanthin Revenue (USD Million) By Country (2021-2032)
Figure 8. Canada Natural Astaxanthin Revenue (USD Million) By Country (2021-2032)
Figure 9. Mexico Natural Astaxanthin Revenue (USD Million) By Country (2021-2032)
Figure 10. Europe Natural Astaxanthin Revenue (USD Million) By Country (2021-2032)
Figure 11. Germany Natural Astaxanthin Revenue (USD Million) By Country (2021-2032)
Figure 12. France Natural Astaxanthin Revenue (USD Million) By Country (2021-2032)
Figure 13. United Kingdom Natural Astaxanthin Revenue (USD Million) By Country (2021-2032)
Figure 14. Spain Natural Astaxanthin Revenue (USD Million) By Country (2021-2032)
Figure 15. Italy Natural Astaxanthin Revenue (USD Million) By Country (2021-2032)
Figure 16. Russia Natural Astaxanthin Revenue (USD Million) By Country (2021-2032)
Figure 17. Rest of Europe Natural Astaxanthin Revenue (USD Million) By Country (2021-2032)
Figure 11. Asia Pacific Natural Astaxanthin Revenue (USD Million) By Country (2021-2032)
Figure 12. China Natural Astaxanthin Revenue (USD Million) By Country (2021-2032)
Figure 13. Japan Natural Astaxanthin Revenue (USD Million) By Country (2021-2032)
Figure 14. India Natural Astaxanthin Revenue (USD Million) By Country (2021-2032)
Figure 15. South Korea Natural Astaxanthin Revenue (USD Million) By Country (2021-2032)
Figure 16. Australia Natural Astaxanthin Revenue (USD Million) By Country (2021-2032)
Figure 17. South East Asia Natural Astaxanthin Revenue (USD Million) By Country (2021-2032)
Figure 18. South America Natural Astaxanthin Revenue (USD Million) By Country (2021-2032)
Figure 19. Brazil Natural Astaxanthin Revenue (USD Million) By Country (2021-2032)
Figure 20. Argentina Natural Astaxanthin Revenue (USD Million) By Country (2021-2032)
Figure 21. Rest of Asia Pacific Natural Astaxanthin Revenue (USD Million) By Country (2021-2032)
Figure 22. Middle East and Africa Natural Astaxanthin Revenue (USD Million) By Region (2021-2032)
Figure 23. Saudi Arabia Natural Astaxanthin Revenue (USD Million) By Region (2021-2032)
Figure 24. The UAE Natural Astaxanthin Revenue (USD Million) By Region (2021-2032)
Figure 25. Rest of Middle East Natural Astaxanthin Revenue (USD Million) By Region (2021-2032)
Figure 26. South Africa Natural Astaxanthin Revenue (USD Million) By Region (2021-2032)
Figure 27. Africa Natural Astaxanthin Revenue (USD Million) By Region (2021-2032)
Figure 28. North America Natural Astaxanthin Revenue (USD Million) By Type (2021-2032)
Figure 29. North America Natural Astaxanthin Revenue (USD Million) By Application (2021-2032)
Figure 30. North America Natural Astaxanthin Revenue (USD Million) By Product (2021-2032)
Figure 31. Europe Natural Astaxanthin Revenue (USD Million) By Type (2021-2032)
Figure 32. Europe Natural Astaxanthin Revenue (USD Million) By Application (2021-2032)
Figure 33. Europe Natural Astaxanthin Revenue (USD Million) By Product (2021-2032)
Figure 34. Asia Pacific Natural Astaxanthin Revenue (USD Million) By Type (2021-2032)
Figure 35. Asia Pacific Natural Astaxanthin Revenue (USD Million) By Application (2021-2032)
Figure 36. Asia Pacific Natural Astaxanthin Revenue (USD Million) By Product (2021-2032)
Figure 37. South America Natural Astaxanthin Revenue (USD Million) By Type (2021-2032)
Figure 38. South America Natural Astaxanthin Revenue (USD Million) By Application (2021-2032)
Figure 39. South America Natural Astaxanthin Revenue (USD Million) By Product (2021-2032)
Figure 40. Middle East and Africa Natural Astaxanthin Revenue (USD Million) By Type (2021-2032)
Figure 41. Middle East and Africa Natural Astaxanthin Revenue (USD Million) By Application (2021-2032)
Figure 42. Middle East and Africa Natural Astaxanthin Revenue (USD Million) By Product (2021-2032)
By Source
Microalgae
Yeast
Plants
Others
By Application
Dietary Supplements
Food and Beverages
Cosmetics and Personal Care
Animal Feed
Pharmaceuticals
Countries Analyzed
North America (US, Canada, Mexico)
Europe (Germany, UK, France, Spain, Italy, Russia, Rest of Europe)
Asia Pacific (China, India, Japan, South Korea, Australia, South East Asia, Rest of Asia)
South America (Brazil, Argentina, Rest of South America)
Middle East and Africa (Saudi Arabia, UAE, Rest of Middle East, South Africa, Egypt, Rest of Africa)
