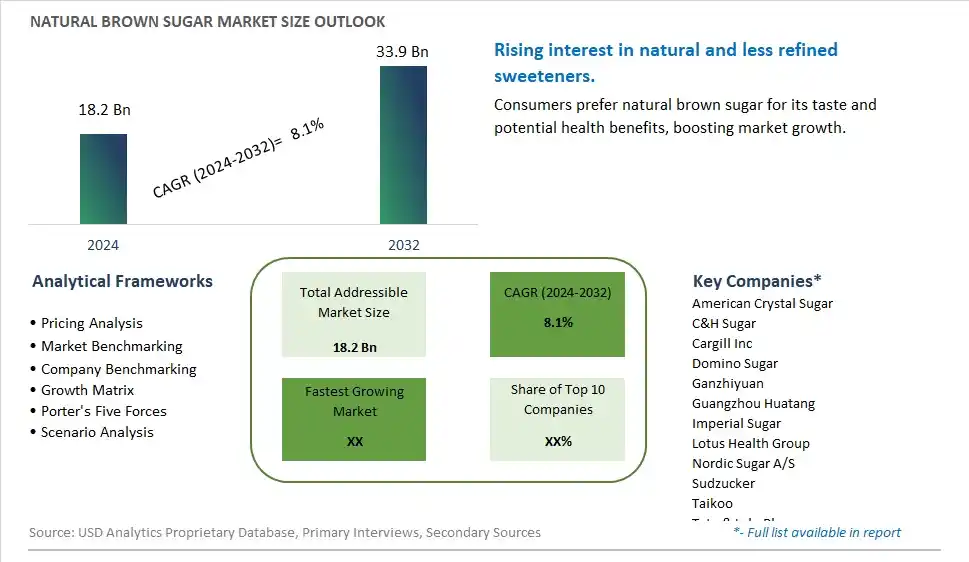
Global Natural Brown Sugar Market Size is valued at $18.2 Billion in 2024 and is forecast to register a growth rate (CAGR) of 8.1% to reach $33.9 Billion by 2032.
The global Natural Brown Sugar Market Comprehensive Study analyzes and forecasts the market size across 6 regions and 24 countries for diverse segments -By Type (Light Brown Sugar, Dark Brown Sugar), By Application (Bakery and Confectionery, Beverages , Desserts and Ice Creams, Others)
An Introduction to Natural Brown Sugar Market
In 2024, the natural brown sugar market is thriving, fueled by the demand for minimally processed sweeteners with a rich flavor and nutritional benefits. Natural brown sugar, made from cane sugar with retained molasses, is preferred by consumers seeking a natural alternative to refined sugars. The market benefits from innovations in sugar processing and sustainable farming practices. The trend towards clean label and natural ingredients is influencing product development. Increasing consumer interest in traditional and minimally processed foods, supported by the popularity of home baking and artisanal products, is further supporting market growth.
Natural Brown Sugar Competitive Landscape
The market report analyses the leading companies in the industry including American Crystal Sugar, C&H Sugar, Cargill Inc, Domino Sugar, Ganzhiyuan, Guangzhou Huatang, Imperial Sugar, Lotus Health Group, Nordic Sugar A/S, Sudzucker, Taikoo, Tate & Lyle Plc, Wholesome Sweeteners, and Others.
Natural Brown Sugar Market Dynamics
Natural Brown Sugar Market Trend: Increasing Demand for Natural and Unrefined Sweeteners
The most prominent trend in the Natural Brown Sugar Market is the increasing demand for natural and unrefined sweeteners. As consumers seek healthier alternatives to refined white sugar, natural brown sugar, with its minimal processing and rich molasses content, is gaining popularity for its flavor and nutritional benefits.
Natural Brown Sugar Market Driver: Health Consciousness and Demand for Clean Label Products
A key driver in the Natural Brown Sugar Market is health consciousness and the demand for clean label products. As more individuals focus on improving their diet and avoiding highly processed foods, there is a rising demand for natural brown sugar that aligns with clean label standards, supporting market growth.
Natural Brown Sugar Market Opportunity: Innovation in Natural Sweetener Blends
One significant opportunity in the Natural Brown Sugar Market lies in innovation in natural sweetener blends. Companies can develop new products that combine natural brown sugar with other unrefined sweeteners, such as coconut sugar and honey, offering consumers unique and health-focused options that cater to their taste and dietary preferences, driving market growth.
Natural Brown Sugar Market Share Analysis- Largest Segment by Type
The Light Brown Sugar segment is the largest in the Natural Brown Sugar Market. Light brown sugar is more widely used in a variety of food products due to its milder flavor and versatility compared to dark brown sugar. It is commonly found in baked goods, sauces, and beverages, which contributes to its significant market share. Additionally, light brown sugar is preferred for its lighter color and less intense molasses flavor, making it a staple ingredient in many recipes.
Natural Brown Sugar Market Share Analysis- Fastest Growing Segment by Application
The Desserts and Ice Creams application segment is expected to grow the fastest in the Natural Brown Sugar Market over the next five years. This growth is driven by the increasing consumer demand for natural and premium ingredients in desserts and frozen treats. Natural brown sugar's rich flavor and caramel notes enhance the taste and texture of desserts and ice creams, making it a preferred choice for premium product lines. The trend towards artisanal and gourmet desserts, combined with a rising focus on natural ingredients, fuels the rapid growth of this segment.
Natural Brown Sugar Market Segmentation
By Type
Light Brown Sugar
Dark Brown Sugar
By Application
Bakery and Confectionery
Beverages
Desserts and Ice Creams
Others
Countries Analyzed
North America (US, Canada, Mexico)
Europe (Germany, UK, France, Spain, Italy, Russia, Rest of Europe)
Asia Pacific (China, India, Japan, South Korea, Australia, South East Asia, Rest of Asia)
South America (Brazil, Argentina, Rest of South America)
Middle East and Africa (Saudi Arabia, UAE, Rest of Middle East, South Africa, Egypt, Rest of Africa)
Natural Brown Sugar Companies Profiled in the Study
American Crystal Sugar
C&H Sugar
Cargill Inc
Domino Sugar
Ganzhiyuan
Guangzhou Huatang
Imperial Sugar
Lotus Health Group
Nordic Sugar A/S
Sudzucker
Taikoo
Tate & Lyle Plc
Wholesome Sweeteners
*- List Not Exhaustive
Chapter 1. TABLE OF CONTENTS
Chapter 2. Introduction to Natural Brown Sugar Market
2.1. Market Overview
2.2. Key Statistics and Report Highlights
2.3. Scope of the Comprehensive Study
2.3.1. Market Definition
2.3.2 Countries and Regions Covered
2.3.3 Research Objective
2.3.4 Units, Currency, and Conversions
2.3.5 Industry Value Chain
2.4. Key Market Segments
2.5. Key Companies
2.6. Study Period
Chapter 3. Strategic Analysis Review
3.1. Natural Brown Sugar Pricing Analysis and Forecast
3.2. Porter’s Five Forces
3.3. Market Ecosystem
3.4. SWOT Analysis
3.5. Regulatory Scenario
3.3. Effects of Inflation, Russia-Ukraine War, moderating economic growth, and other macroeconomic factors
Chapter 4. Competitive Landscape
4.1. Market Share Analysis
4.1.1. Global Natural Brown Sugar Market Share by Company, 2023
4.1.2. Product Offerings of Leading Natural Brown Sugar Companies
4.2. Market Entropy
4.2.1. New Product Launches in the Industry
4.2.2. Mergers, Acquisitions, Joint ventures, and Partnerships
4.3. Key Strategies and Best Practices
Chapter 5. Global Market Projections: Best, Reference, and Low Case Scenarios
5.1. Growth Analysis- Case Scenario Definitions
5.2. Low Growth Case Scenario Forecasts
5.3. Reference Growth Case Scenario Forecasts
5.4. High Growth Case Scenario Forecasts
Chapter 6. Market Dynamics
6.1. Natural Brown Sugar Market Drivers
6.2. Natural Brown Sugar Market Challenges
6.6. Natural Brown Sugar Market Opportunities
6.4. Natural Brown Sugar Market Trends
Chapter 7. Global Natural Brown Sugar Market Outlook Trends
7.1. Global Natural Brown Sugar Revenue (USD Million) and CAGR (%) by Type (2021-2032)
7.2. Global Natural Brown Sugar Revenue (USD Million) and CAGR (%) by Application (2021-2032)
7.3. Global Natural Brown Sugar Revenue (USD Million) and CAGR (%) by Product (2021-2032)
By Type
Light Brown Sugar
Dark Brown Sugar
By Application
Bakery and Confectionery
Beverages
Desserts and Ice Creams
Others
Chapter 8. Global Natural Brown Sugar Regional Analysis and Outlook
8.1. Global Natural Brown Sugar Revenue (USD Million) By Regions (2021- 2032)
8.2. North America Natural Brown Sugar Revenue (USD Million) by Country (2021-2032)
8.2.1. United States Natural Brown Sugar Regional Analysis and Outlook
8.2.2. Canada Natural Brown Sugar Regional Analysis and Outlook
8.2.3. Mexico Natural Brown Sugar Regional Analysis and Outlook
8.3. Europe Natural Brown Sugar Revenue (USD Million), by Country (2021-2032)
8.3.1. Germany Natural Brown Sugar Regional Analysis and Outlook
8.3.2. France Natural Brown Sugar Regional Analysis and Outlook
8.3.3. United Kingdom Natural Brown Sugar Regional Analysis and Outlook
8.3.4. Spain Natural Brown Sugar Regional Analysis and Outlook
8.3.5. Italy Natural Brown Sugar Regional Analysis and Outlook
8.3.6. Russia Natural Brown Sugar Regional Analysis and Outlook
8.3.7. Rest of Europe Natural Brown Sugar Regional Analysis and Outlook
8.4. Asia Pacific Natural Brown Sugar Revenue (USD Million) by Country (2021-2032)
8.4.1. China Natural Brown Sugar Regional Analysis and Outlook
8.4.2. Japan Natural Brown Sugar Regional Analysis and Outlook
8.4.3. India Natural Brown Sugar Regional Analysis and Outlook
8.4.4. South Korea Natural Brown Sugar Regional Analysis and Outlook
8.4.5. Australia Natural Brown Sugar Regional Analysis and Outlook
8.4.6. South East Asia Natural Brown Sugar Regional Analysis and Outlook
8.4.7. Rest of Asia Pacific Natural Brown Sugar Regional Analysis and Outlook
8.5. South America Natural Brown Sugar Revenue (USD Million), by Country (2021-2032)
8.5.1. Brazil Natural Brown Sugar Regional Analysis and Outlook
8.5.2. Argentina Natural Brown Sugar Regional Analysis and Outlook
8.5.3. Rest of South America Natural Brown Sugar Regional Analysis and Outlook
8.6. Middle East and Africa Natural Brown Sugar Revenue (USD Million) by Country (2021-2032)
8.6.1. Middle East Natural Brown Sugar Regional Analysis and Outlook
8.6.2. Africa Natural Brown Sugar Regional Analysis and Outlook
Chapter 9. North America Natural Brown Sugar Analysis and Outlook
9.1. North America Natural Brown Sugar Revenue (USD Million) by Segments (2021-2032)
9.1.1. North America Natural Brown Sugar Revenue (USD Million) by Type (2021-2032)
9.1.2. North America Natural Brown Sugar Revenue (USD Million) by Application (2021-2032)
9.1.3. North America Natural Brown Sugar Revenue (USD Million) by Product (2021-2032)
By Type
Light Brown Sugar
Dark Brown Sugar
By Application
Bakery and Confectionery
Beverages
Desserts and Ice Creams
Others
Chapter 10. Europe Natural Brown Sugar Analysis and Outlook
10.1. Europe Natural Brown Sugar Revenue (USD Million), by Segments (USD Million) (2021-2032)
10.1.1. Europe Natural Brown Sugar Revenue (USD Million) by Type (2021-2032)
10.1.2. Europe Natural Brown Sugar Revenue (USD Million) by Application (2021-2032)
10.1.3. Europe Natural Brown Sugar Revenue (USD Million) by Product (2021-2032)
By Type
Light Brown Sugar
Dark Brown Sugar
By Application
Bakery and Confectionery
Beverages
Desserts and Ice Creams
Others
Chapter 11. Asia Pacific Natural Brown Sugar Analysis and Outlook
11.1. Asia Pacific Natural Brown Sugar Revenue (USD Million), and Revenue (USD Million) by Segments (2021-2032)
11.1.1. Asia Pacific Natural Brown Sugar Revenue (USD Million) by Type (2021-2032)
11.1.2. Asia Pacific Natural Brown Sugar Revenue (USD Million) by Application (2021-2032)
11.1.3. Asia Pacific Natural Brown Sugar Revenue (USD Million) by Product (2021-2032)
By Type
Light Brown Sugar
Dark Brown Sugar
By Application
Bakery and Confectionery
Beverages
Desserts and Ice Creams
Others
Chapter 12. South America Natural Brown Sugar Analysis and Outlook
12.1. South America Natural Brown Sugar Revenue (USD Million), by Segments (2021-2032)
12.1.1. South America Natural Brown Sugar Revenue (USD Million) by Type (2021-2032)
12.1.2. South America Natural Brown Sugar Revenue (USD Million) by Application (2021-2032)
12.1.3. South America Natural Brown Sugar Revenue (USD Million) by Product (2021-2032)
By Type
Light Brown Sugar
Dark Brown Sugar
By Application
Bakery and Confectionery
Beverages
Desserts and Ice Creams
Others
Chapter 13. Middle East and Africa Natural Brown Sugar Analysis and Outlook
13.1. Middle East and Africa Natural Brown Sugar Revenue (USD Million), by Segments (2021-2032)
13.1.1. Middle East and Africa Natural Brown Sugar Revenue (USD Million) by Type (2021-2032)
13.1.2. Middle East and Africa Natural Brown Sugar Revenue (USD Million) by Application (2021-2032)
13.1.3. Middle East and Africa Natural Brown Sugar Revenue (USD Million) by Product (2021-2032)
By Type
Light Brown Sugar
Dark Brown Sugar
By Application
Bakery and Confectionery
Beverages
Desserts and Ice Creams
Others
Chapter 14. Natural Brown Sugar Company Profiles
14.1 Business Overview
14.2 Product Profiles
14.3 SWOT Profiles
14.5 Recent Developments
14.6 Financial Profile
List of Companies
American Crystal Sugar
C&H Sugar
Cargill Inc
Domino Sugar
Ganzhiyuan
Guangzhou Huatang
Imperial Sugar
Lotus Health Group
Nordic Sugar A/S
Sudzucker
Taikoo
Tate & Lyle Plc
Wholesome Sweeteners
15. Methodology and Data Sources
15.1 Customization Offerings
15.2 Subscription Services
15.3 Related Reports
15.4 Publisher Expertise
LIST OF TABLES
Table 1 Market Segmentation Analysis
Table 2 Global Natural Brown Sugar Market Share of Leading Companies, 2023
Table 3 Product Offerings of Leading Companies
Table 4 Low Growth Scenario Forecasts
Table 5 Reference Case Growth Scenario
Table 6 High Growth Case Scenario
Table 7 Global Natural Brown Sugar Revenue (USD Million) And CAGR (%) By Type (2021-2032)
Table 8 Global Natural Brown Sugar Revenue (USD Million) And CAGR (%) By Application (2021-2032)
Table 9 Global Natural Brown Sugar Revenue (USD Million) And CAGR (%) By Product (2021-2032)
Table 10 Global Natural Brown Sugar Market Revenue (USD Million) By Regions (2021-2032)
Table 11 Global Natural Brown Sugar Market Share (%) By Regions (2021-2032)
Table 12 North America Natural Brown Sugar Revenue (USD Million) By Country (2021-2032)
Table 13 Europe Natural Brown Sugar Revenue (USD Million) By Country (2021-2032)
Table 14 Asia Pacific Natural Brown Sugar Revenue (USD Million) By Country (2021-2032)
Table 15 South America Natural Brown Sugar Revenue (USD Million) By Country (2021-2032)
Table 16 Middle East and Africa Natural Brown Sugar Revenue (USD Million) By Region (2021-2032)
Table 17 North America Natural Brown Sugar Revenue (USD Million) By Type (2021-2032)
Table 18 North America Natural Brown Sugar Revenue (USD Million) By Application (2021-2032)
Table 19 North America Natural Brown Sugar Revenue (USD Million) By Product (2021-2032)
Table 20 Europe Natural Brown Sugar Revenue (USD Million) By Type (2021-2032)
Table 21 Europe Natural Brown Sugar Revenue (USD Million) By Application (2021-2032)
Table 22 Europe Natural Brown Sugar Revenue (USD Million) By Product (2021-2032)
Table 23 Asia Pacific Natural Brown Sugar Revenue (USD Million) By Type (2021-2032)
Table 24 Asia Pacific Natural Brown Sugar Revenue (USD Million) By Application (2021-2032)
Table 25 Asia Pacific Natural Brown Sugar Revenue (USD Million) By Product (2021-2032)
Table 26 South America Natural Brown Sugar Revenue (USD Million) By Type (2021-2032)
Table 27 South America Natural Brown Sugar Revenue (USD Million) By Application (2021-2032)
Table 28 South America Natural Brown Sugar Revenue (USD Million) By Product (2021-2032)
Table 29 Middle East and Africa Natural Brown Sugar Revenue (USD Million) By Type (2021-2032)
Table 30 Middle East and Africa Natural Brown Sugar Revenue (USD Million) By Application (2021-2032)
Table 31 Middle East and Africa Natural Brown Sugar Revenue (USD Million) By Product (2021-2032)
LIST OF FIGURES
Figure 1. Market Scope
Figure 2. Pricing Forecasts Per Unit, 2023- 2032
Figure 3. Porter’s Five Forces
Figure 4. Global Natural Brown Sugar Market Revenue (USD Million) By Regions (2021-2032)
Figure 5. Global Natural Brown Sugar Market Share (%) By Regions (2023)
Figure 6. North America Natural Brown Sugar Revenue (USD Million) By Country (2021-2032)
Figure 7. United States Natural Brown Sugar Revenue (USD Million) By Country (2021-2032)
Figure 8. Canada Natural Brown Sugar Revenue (USD Million) By Country (2021-2032)
Figure 9. Mexico Natural Brown Sugar Revenue (USD Million) By Country (2021-2032)
Figure 10. Europe Natural Brown Sugar Revenue (USD Million) By Country (2021-2032)
Figure 11. Germany Natural Brown Sugar Revenue (USD Million) By Country (2021-2032)
Figure 12. France Natural Brown Sugar Revenue (USD Million) By Country (2021-2032)
Figure 13. United Kingdom Natural Brown Sugar Revenue (USD Million) By Country (2021-2032)
Figure 14. Spain Natural Brown Sugar Revenue (USD Million) By Country (2021-2032)
Figure 15. Italy Natural Brown Sugar Revenue (USD Million) By Country (2021-2032)
Figure 16. Russia Natural Brown Sugar Revenue (USD Million) By Country (2021-2032)
Figure 17. Rest of Europe Natural Brown Sugar Revenue (USD Million) By Country (2021-2032)
Figure 11. Asia Pacific Natural Brown Sugar Revenue (USD Million) By Country (2021-2032)
Figure 12. China Natural Brown Sugar Revenue (USD Million) By Country (2021-2032)
Figure 13. Japan Natural Brown Sugar Revenue (USD Million) By Country (2021-2032)
Figure 14. India Natural Brown Sugar Revenue (USD Million) By Country (2021-2032)
Figure 15. South Korea Natural Brown Sugar Revenue (USD Million) By Country (2021-2032)
Figure 16. Australia Natural Brown Sugar Revenue (USD Million) By Country (2021-2032)
Figure 17. South East Asia Natural Brown Sugar Revenue (USD Million) By Country (2021-2032)
Figure 18. South America Natural Brown Sugar Revenue (USD Million) By Country (2021-2032)
Figure 19. Brazil Natural Brown Sugar Revenue (USD Million) By Country (2021-2032)
Figure 20. Argentina Natural Brown Sugar Revenue (USD Million) By Country (2021-2032)
Figure 21. Rest of Asia Pacific Natural Brown Sugar Revenue (USD Million) By Country (2021-2032)
Figure 22. Middle East and Africa Natural Brown Sugar Revenue (USD Million) By Region (2021-2032)
Figure 23. Saudi Arabia Natural Brown Sugar Revenue (USD Million) By Region (2021-2032)
Figure 24. The UAE Natural Brown Sugar Revenue (USD Million) By Region (2021-2032)
Figure 25. Rest of Middle East Natural Brown Sugar Revenue (USD Million) By Region (2021-2032)
Figure 26. South Africa Natural Brown Sugar Revenue (USD Million) By Region (2021-2032)
Figure 27. Africa Natural Brown Sugar Revenue (USD Million) By Region (2021-2032)
Figure 28. North America Natural Brown Sugar Revenue (USD Million) By Type (2021-2032)
Figure 29. North America Natural Brown Sugar Revenue (USD Million) By Application (2021-2032)
Figure 30. North America Natural Brown Sugar Revenue (USD Million) By Product (2021-2032)
Figure 31. Europe Natural Brown Sugar Revenue (USD Million) By Type (2021-2032)
Figure 32. Europe Natural Brown Sugar Revenue (USD Million) By Application (2021-2032)
Figure 33. Europe Natural Brown Sugar Revenue (USD Million) By Product (2021-2032)
Figure 34. Asia Pacific Natural Brown Sugar Revenue (USD Million) By Type (2021-2032)
Figure 35. Asia Pacific Natural Brown Sugar Revenue (USD Million) By Application (2021-2032)
Figure 36. Asia Pacific Natural Brown Sugar Revenue (USD Million) By Product (2021-2032)
Figure 37. South America Natural Brown Sugar Revenue (USD Million) By Type (2021-2032)
Figure 38. South America Natural Brown Sugar Revenue (USD Million) By Application (2021-2032)
Figure 39. South America Natural Brown Sugar Revenue (USD Million) By Product (2021-2032)
Figure 40. Middle East and Africa Natural Brown Sugar Revenue (USD Million) By Type (2021-2032)
Figure 41. Middle East and Africa Natural Brown Sugar Revenue (USD Million) By Application (2021-2032)
Figure 42. Middle East and Africa Natural Brown Sugar Revenue (USD Million) By Product (2021-2032)
By Type
Light Brown Sugar
Dark Brown Sugar
By Application
Bakery and Confectionery
Beverages
Desserts and Ice Creams
Others
Countries Analyzed
North America (US, Canada, Mexico)
Europe (Germany, UK, France, Spain, Italy, Russia, Rest of Europe)
Asia Pacific (China, India, Japan, South Korea, Australia, South East Asia, Rest of Asia)
South America (Brazil, Argentina, Rest of South America)
Middle East and Africa (Saudi Arabia, UAE, Rest of Middle East, South Africa, Egypt, Rest of Africa)
