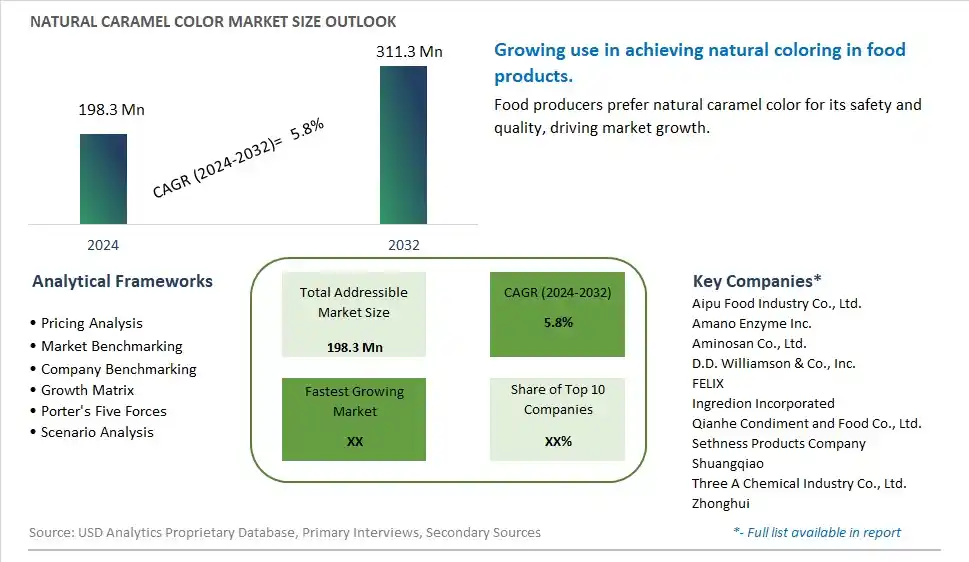
Global Natural Caramel Color Market Size is valued at $198.3 Million in 2024 and is forecast to register a growth rate (CAGR) of 5.8% to reach $311.3 Million by 2032.
The global Natural Caramel Color Market Comprehensive Study analyzes and forecasts the market size across 6 regions and 24 countries for diverse segments -By Type (Class I Caramel Color, Class II Caramel Color, Class III Caramel Color, Class IV Caramel Color), By Application (Bakery Goods, Soy Sauces, Alcoholic Beverage, Soft Drink, Others)
An Introduction to Natural Caramel Color Market
In 2024, the natural caramel color market is thriving, fueled by the demand for natural food colorings that enhance the appearance of various food and beverage products. Natural caramel color, derived from the controlled heat treatment of carbohydrates, offers a rich brown hue and is used in products like soft drinks, baked goods, and sauces. The market benefits from advancements in caramelization and processing technologies that improve color stability and consistency. The trend towards clean label and natural ingredients is influencing product development. Increasing consumer awareness of artificial color additives and the popularity of natural and organic foods are further supporting market growth.
Natural Caramel Color Competitive Landscape
The market report analyses the leading companies in the industry including Aipu Food Industry Co., Ltd., Amano Enzyme Inc., Aminosan Co., Ltd., D.D. Williamson & Co., Inc., FELIX, Ingredion Incorporated, Qianhe Condiment and Food Co., Ltd., Sethness Products Company, Shuangqiao, Three A Chemical Industry Co., Ltd., Zhonghui, and Others.
Natural Caramel Color Market Dynamics
Natural Caramel Color Market Trend: Increasing Use of Natural Colors in Food and Beverages
The most prominent trend in the Natural Caramel Color Market is the increasing use of natural colors in food and beverages. Consumers are seeking products that use natural colorants, such as caramel color, instead of synthetic dyes, driven by the desire for clean-label and minimally processed ingredients. This trend is fueled by the growing awareness of the potential health risks associated with artificial colors and the demand for transparency in food production.
Natural Caramel Color Market Driver: Health Consciousness and Demand for Clean Label Products
A key driver in the Natural Caramel Color Market is health consciousness and the demand for clean label products. As more individuals focus on improving their diet and avoiding synthetic additives, there is a rising demand for natural caramel color that provides a safe and natural alternative for coloring foods and beverages. This demand supports the growth of the market as consumers seek out natural and minimally processed food ingredients.
Natural Caramel Color Market Opportunity: Innovation in Color Stability and Applications
One significant opportunity in the Natural Caramel Color Market lies in innovation in color stability and applications. Companies can develop new caramel color formulations that offer improved stability under various processing conditions, such as heat and pH variations, and expand their use in a wide range of food and beverage products, including baked goods, sauces, and soft drinks. By offering versatile and high-performance natural colorants, manufacturers can attract food and beverage producers seeking clean-label solutions and drive market growth.
Natural Caramel Color Market Share Analysis- Largest Segment by Type
The Class I Caramel Color segment is the largest in the Natural Caramel Color Market. This dominance is largely due to its broad application and regulatory approval for use in a wide range of food and beverage products. Class I Caramel Color, also known as plain caramel or caramelized sugar, is produced by heating sugar without the use of acids or alkalis, making it suitable for a wide variety of applications while maintaining a clean label. Its versatility allows it to be used in products such as baked goods, dairy products, and confectioneries, which contribute to its significant market share. Additionally, the increasing consumer preference for natural and clean-label products drives demand for Class I Caramel Color, reinforcing its position as the largest segment.
Natural Caramel Color Market Share Analysis- Poised to Grow Fastest Over the Next Five Years by Application
The Soft Drink application segment is poised to grow fastest in the Natural Caramel Color Market over the next five years. This anticipated growth is driven by the ongoing demand for natural and aesthetically appealing colorants in beverages. Soft drinks, particularly those targeting health-conscious consumers and premium markets, are increasingly using natural caramel colors to replace synthetic dyes. This shift aligns with broader trends towards natural ingredients and clean labels in the beverage industry. Additionally, the expanding range of soft drink products, including new flavors and formulations, increases the need for versatile and visually appealing caramel colors. The growing emphasis on natural ingredients in the beverage sector supports the rapid growth of the Soft Drink segment.
Natural Caramel Color Market Segmentation
By Type
Class I Caramel Color
Class II Caramel Color
Class III Caramel Color
Class IV Caramel Color
By Application
Bakery Goods
Soy Sauces
Alcoholic Beverage
Soft Drink
Others
Countries Analyzed
North America (US, Canada, Mexico)
Europe (Germany, UK, France, Spain, Italy, Russia, Rest of Europe)
Asia Pacific (China, India, Japan, South Korea, Australia, South East Asia, Rest of Asia)
South America (Brazil, Argentina, Rest of South America)
Middle East and Africa (Saudi Arabia, UAE, Rest of Middle East, South Africa, Egypt, Rest of Africa)
Natural Caramel Color Companies Profiled in the Study
Aipu Food Industry Co., Ltd.
Amano Enzyme Inc.
Aminosan Co., Ltd.
D.D. Williamson & Co., Inc.
FELIX
Ingredion Incorporated
Qianhe Condiment and Food Co., Ltd.
Sethness Products Company
Shuangqiao
Three A Chemical Industry Co., Ltd.
Zhonghui
*- List Not Exhaustive
Chapter 1. TABLE OF CONTENTS
Chapter 2. Introduction to Natural Caramel Color Market
2.1. Market Overview
2.2. Key Statistics and Report Highlights
2.3. Scope of the Comprehensive Study
2.3.1. Market Definition
2.3.2 Countries and Regions Covered
2.3.3 Research Objective
2.3.4 Units, Currency, and Conversions
2.3.5 Industry Value Chain
2.4. Key Market Segments
2.5. Key Companies
2.6. Study Period
Chapter 3. Strategic Analysis Review
3.1. Natural Caramel Color Pricing Analysis and Forecast
3.2. Porter’s Five Forces
3.3. Market Ecosystem
3.4. SWOT Analysis
3.5. Regulatory Scenario
3.3. Effects of Inflation, Russia-Ukraine War, moderating economic growth, and other macroeconomic factors
Chapter 4. Competitive Landscape
4.1. Market Share Analysis
4.1.1. Global Natural Caramel Color Market Share by Company, 2023
4.1.2. Product Offerings of Leading Natural Caramel Color Companies
4.2. Market Entropy
4.2.1. New Product Launches in the Industry
4.2.2. Mergers, Acquisitions, Joint ventures, and Partnerships
4.3. Key Strategies and Best Practices
Chapter 5. Global Market Projections: Best, Reference, and Low Case Scenarios
5.1. Growth Analysis- Case Scenario Definitions
5.2. Low Growth Case Scenario Forecasts
5.3. Reference Growth Case Scenario Forecasts
5.4. High Growth Case Scenario Forecasts
Chapter 6. Market Dynamics
6.1. Natural Caramel Color Market Drivers
6.2. Natural Caramel Color Market Challenges
6.6. Natural Caramel Color Market Opportunities
6.4. Natural Caramel Color Market Trends
Chapter 7. Global Natural Caramel Color Market Outlook Trends
7.1. Global Natural Caramel Color Revenue (USD Million) and CAGR (%) by Type (2021-2032)
7.2. Global Natural Caramel Color Revenue (USD Million) and CAGR (%) by Application (2021-2032)
7.3. Global Natural Caramel Color Revenue (USD Million) and CAGR (%) by Product (2021-2032)
By Type
Class I Caramel Color
Class II Caramel Color
Class III Caramel Color
Class IV Caramel Color
By Application
Bakery Goods
Soy Sauces
Alcoholic Beverage
Soft Drink
Others
Chapter 8. Global Natural Caramel Color Regional Analysis and Outlook
8.1. Global Natural Caramel Color Revenue (USD Million) By Regions (2021- 2032)
8.2. North America Natural Caramel Color Revenue (USD Million) by Country (2021-2032)
8.2.1. United States Natural Caramel Color Regional Analysis and Outlook
8.2.2. Canada Natural Caramel Color Regional Analysis and Outlook
8.2.3. Mexico Natural Caramel Color Regional Analysis and Outlook
8.3. Europe Natural Caramel Color Revenue (USD Million), by Country (2021-2032)
8.3.1. Germany Natural Caramel Color Regional Analysis and Outlook
8.3.2. France Natural Caramel Color Regional Analysis and Outlook
8.3.3. United Kingdom Natural Caramel Color Regional Analysis and Outlook
8.3.4. Spain Natural Caramel Color Regional Analysis and Outlook
8.3.5. Italy Natural Caramel Color Regional Analysis and Outlook
8.3.6. Russia Natural Caramel Color Regional Analysis and Outlook
8.3.7. Rest of Europe Natural Caramel Color Regional Analysis and Outlook
8.4. Asia Pacific Natural Caramel Color Revenue (USD Million) by Country (2021-2032)
8.4.1. China Natural Caramel Color Regional Analysis and Outlook
8.4.2. Japan Natural Caramel Color Regional Analysis and Outlook
8.4.3. India Natural Caramel Color Regional Analysis and Outlook
8.4.4. South Korea Natural Caramel Color Regional Analysis and Outlook
8.4.5. Australia Natural Caramel Color Regional Analysis and Outlook
8.4.6. South East Asia Natural Caramel Color Regional Analysis and Outlook
8.4.7. Rest of Asia Pacific Natural Caramel Color Regional Analysis and Outlook
8.5. South America Natural Caramel Color Revenue (USD Million), by Country (2021-2032)
8.5.1. Brazil Natural Caramel Color Regional Analysis and Outlook
8.5.2. Argentina Natural Caramel Color Regional Analysis and Outlook
8.5.3. Rest of South America Natural Caramel Color Regional Analysis and Outlook
8.6. Middle East and Africa Natural Caramel Color Revenue (USD Million) by Country (2021-2032)
8.6.1. Middle East Natural Caramel Color Regional Analysis and Outlook
8.6.2. Africa Natural Caramel Color Regional Analysis and Outlook
Chapter 9. North America Natural Caramel Color Analysis and Outlook
9.1. North America Natural Caramel Color Revenue (USD Million) by Segments (2021-2032)
9.1.1. North America Natural Caramel Color Revenue (USD Million) by Type (2021-2032)
9.1.2. North America Natural Caramel Color Revenue (USD Million) by Application (2021-2032)
9.1.3. North America Natural Caramel Color Revenue (USD Million) by Product (2021-2032)
By Type
Class I Caramel Color
Class II Caramel Color
Class III Caramel Color
Class IV Caramel Color
By Application
Bakery Goods
Soy Sauces
Alcoholic Beverage
Soft Drink
Others
Chapter 10. Europe Natural Caramel Color Analysis and Outlook
10.1. Europe Natural Caramel Color Revenue (USD Million), by Segments (USD Million) (2021-2032)
10.1.1. Europe Natural Caramel Color Revenue (USD Million) by Type (2021-2032)
10.1.2. Europe Natural Caramel Color Revenue (USD Million) by Application (2021-2032)
10.1.3. Europe Natural Caramel Color Revenue (USD Million) by Product (2021-2032)
By Type
Class I Caramel Color
Class II Caramel Color
Class III Caramel Color
Class IV Caramel Color
By Application
Bakery Goods
Soy Sauces
Alcoholic Beverage
Soft Drink
Others
Chapter 11. Asia Pacific Natural Caramel Color Analysis and Outlook
11.1. Asia Pacific Natural Caramel Color Revenue (USD Million), and Revenue (USD Million) by Segments (2021-2032)
11.1.1. Asia Pacific Natural Caramel Color Revenue (USD Million) by Type (2021-2032)
11.1.2. Asia Pacific Natural Caramel Color Revenue (USD Million) by Application (2021-2032)
11.1.3. Asia Pacific Natural Caramel Color Revenue (USD Million) by Product (2021-2032)
By Type
Class I Caramel Color
Class II Caramel Color
Class III Caramel Color
Class IV Caramel Color
By Application
Bakery Goods
Soy Sauces
Alcoholic Beverage
Soft Drink
Others
Chapter 12. South America Natural Caramel Color Analysis and Outlook
12.1. South America Natural Caramel Color Revenue (USD Million), by Segments (2021-2032)
12.1.1. South America Natural Caramel Color Revenue (USD Million) by Type (2021-2032)
12.1.2. South America Natural Caramel Color Revenue (USD Million) by Application (2021-2032)
12.1.3. South America Natural Caramel Color Revenue (USD Million) by Product (2021-2032)
By Type
Class I Caramel Color
Class II Caramel Color
Class III Caramel Color
Class IV Caramel Color
By Application
Bakery Goods
Soy Sauces
Alcoholic Beverage
Soft Drink
Others
Chapter 13. Middle East and Africa Natural Caramel Color Analysis and Outlook
13.1. Middle East and Africa Natural Caramel Color Revenue (USD Million), by Segments (2021-2032)
13.1.1. Middle East and Africa Natural Caramel Color Revenue (USD Million) by Type (2021-2032)
13.1.2. Middle East and Africa Natural Caramel Color Revenue (USD Million) by Application (2021-2032)
13.1.3. Middle East and Africa Natural Caramel Color Revenue (USD Million) by Product (2021-2032)
By Type
Class I Caramel Color
Class II Caramel Color
Class III Caramel Color
Class IV Caramel Color
By Application
Bakery Goods
Soy Sauces
Alcoholic Beverage
Soft Drink
Others
Chapter 14. Natural Caramel Color Company Profiles
14.1 Business Overview
14.2 Product Profiles
14.3 SWOT Profiles
14.5 Recent Developments
14.6 Financial Profile
List of Companies
Aipu Food Industry Co., Ltd.
Amano Enzyme Inc.
Aminosan Co., Ltd.
D.D. Williamson & Co., Inc.
FELIX
Ingredion Incorporated
Qianhe Condiment and Food Co., Ltd.
Sethness Products Company
Shuangqiao
Three A Chemical Industry Co., Ltd.
Zhonghui
15. Methodology and Data Sources
15.1 Customization Offerings
15.2 Subscription Services
15.3 Related Reports
15.4 Publisher Expertise
LIST OF TABLES
Table 1 Market Segmentation Analysis
Table 2 Global Natural Caramel Color Market Share of Leading Companies, 2023
Table 3 Product Offerings of Leading Companies
Table 4 Low Growth Scenario Forecasts
Table 5 Reference Case Growth Scenario
Table 6 High Growth Case Scenario
Table 7 Global Natural Caramel Color Revenue (USD Million) And CAGR (%) By Type (2021-2032)
Table 8 Global Natural Caramel Color Revenue (USD Million) And CAGR (%) By Application (2021-2032)
Table 9 Global Natural Caramel Color Revenue (USD Million) And CAGR (%) By Product (2021-2032)
Table 10 Global Natural Caramel Color Market Revenue (USD Million) By Regions (2021-2032)
Table 11 Global Natural Caramel Color Market Share (%) By Regions (2021-2032)
Table 12 North America Natural Caramel Color Revenue (USD Million) By Country (2021-2032)
Table 13 Europe Natural Caramel Color Revenue (USD Million) By Country (2021-2032)
Table 14 Asia Pacific Natural Caramel Color Revenue (USD Million) By Country (2021-2032)
Table 15 South America Natural Caramel Color Revenue (USD Million) By Country (2021-2032)
Table 16 Middle East and Africa Natural Caramel Color Revenue (USD Million) By Region (2021-2032)
Table 17 North America Natural Caramel Color Revenue (USD Million) By Type (2021-2032)
Table 18 North America Natural Caramel Color Revenue (USD Million) By Application (2021-2032)
Table 19 North America Natural Caramel Color Revenue (USD Million) By Product (2021-2032)
Table 20 Europe Natural Caramel Color Revenue (USD Million) By Type (2021-2032)
Table 21 Europe Natural Caramel Color Revenue (USD Million) By Application (2021-2032)
Table 22 Europe Natural Caramel Color Revenue (USD Million) By Product (2021-2032)
Table 23 Asia Pacific Natural Caramel Color Revenue (USD Million) By Type (2021-2032)
Table 24 Asia Pacific Natural Caramel Color Revenue (USD Million) By Application (2021-2032)
Table 25 Asia Pacific Natural Caramel Color Revenue (USD Million) By Product (2021-2032)
Table 26 South America Natural Caramel Color Revenue (USD Million) By Type (2021-2032)
Table 27 South America Natural Caramel Color Revenue (USD Million) By Application (2021-2032)
Table 28 South America Natural Caramel Color Revenue (USD Million) By Product (2021-2032)
Table 29 Middle East and Africa Natural Caramel Color Revenue (USD Million) By Type (2021-2032)
Table 30 Middle East and Africa Natural Caramel Color Revenue (USD Million) By Application (2021-2032)
Table 31 Middle East and Africa Natural Caramel Color Revenue (USD Million) By Product (2021-2032)
LIST OF FIGURES
Figure 1. Market Scope
Figure 2. Pricing Forecasts Per Unit, 2023- 2032
Figure 3. Porter’s Five Forces
Figure 4. Global Natural Caramel Color Market Revenue (USD Million) By Regions (2021-2032)
Figure 5. Global Natural Caramel Color Market Share (%) By Regions (2023)
Figure 6. North America Natural Caramel Color Revenue (USD Million) By Country (2021-2032)
Figure 7. United States Natural Caramel Color Revenue (USD Million) By Country (2021-2032)
Figure 8. Canada Natural Caramel Color Revenue (USD Million) By Country (2021-2032)
Figure 9. Mexico Natural Caramel Color Revenue (USD Million) By Country (2021-2032)
Figure 10. Europe Natural Caramel Color Revenue (USD Million) By Country (2021-2032)
Figure 11. Germany Natural Caramel Color Revenue (USD Million) By Country (2021-2032)
Figure 12. France Natural Caramel Color Revenue (USD Million) By Country (2021-2032)
Figure 13. United Kingdom Natural Caramel Color Revenue (USD Million) By Country (2021-2032)
Figure 14. Spain Natural Caramel Color Revenue (USD Million) By Country (2021-2032)
Figure 15. Italy Natural Caramel Color Revenue (USD Million) By Country (2021-2032)
Figure 16. Russia Natural Caramel Color Revenue (USD Million) By Country (2021-2032)
Figure 17. Rest of Europe Natural Caramel Color Revenue (USD Million) By Country (2021-2032)
Figure 11. Asia Pacific Natural Caramel Color Revenue (USD Million) By Country (2021-2032)
Figure 12. China Natural Caramel Color Revenue (USD Million) By Country (2021-2032)
Figure 13. Japan Natural Caramel Color Revenue (USD Million) By Country (2021-2032)
Figure 14. India Natural Caramel Color Revenue (USD Million) By Country (2021-2032)
Figure 15. South Korea Natural Caramel Color Revenue (USD Million) By Country (2021-2032)
Figure 16. Australia Natural Caramel Color Revenue (USD Million) By Country (2021-2032)
Figure 17. South East Asia Natural Caramel Color Revenue (USD Million) By Country (2021-2032)
Figure 18. South America Natural Caramel Color Revenue (USD Million) By Country (2021-2032)
Figure 19. Brazil Natural Caramel Color Revenue (USD Million) By Country (2021-2032)
Figure 20. Argentina Natural Caramel Color Revenue (USD Million) By Country (2021-2032)
Figure 21. Rest of Asia Pacific Natural Caramel Color Revenue (USD Million) By Country (2021-2032)
Figure 22. Middle East and Africa Natural Caramel Color Revenue (USD Million) By Region (2021-2032)
Figure 23. Saudi Arabia Natural Caramel Color Revenue (USD Million) By Region (2021-2032)
Figure 24. The UAE Natural Caramel Color Revenue (USD Million) By Region (2021-2032)
Figure 25. Rest of Middle East Natural Caramel Color Revenue (USD Million) By Region (2021-2032)
Figure 26. South Africa Natural Caramel Color Revenue (USD Million) By Region (2021-2032)
Figure 27. Africa Natural Caramel Color Revenue (USD Million) By Region (2021-2032)
Figure 28. North America Natural Caramel Color Revenue (USD Million) By Type (2021-2032)
Figure 29. North America Natural Caramel Color Revenue (USD Million) By Application (2021-2032)
Figure 30. North America Natural Caramel Color Revenue (USD Million) By Product (2021-2032)
Figure 31. Europe Natural Caramel Color Revenue (USD Million) By Type (2021-2032)
Figure 32. Europe Natural Caramel Color Revenue (USD Million) By Application (2021-2032)
Figure 33. Europe Natural Caramel Color Revenue (USD Million) By Product (2021-2032)
Figure 34. Asia Pacific Natural Caramel Color Revenue (USD Million) By Type (2021-2032)
Figure 35. Asia Pacific Natural Caramel Color Revenue (USD Million) By Application (2021-2032)
Figure 36. Asia Pacific Natural Caramel Color Revenue (USD Million) By Product (2021-2032)
Figure 37. South America Natural Caramel Color Revenue (USD Million) By Type (2021-2032)
Figure 38. South America Natural Caramel Color Revenue (USD Million) By Application (2021-2032)
Figure 39. South America Natural Caramel Color Revenue (USD Million) By Product (2021-2032)
Figure 40. Middle East and Africa Natural Caramel Color Revenue (USD Million) By Type (2021-2032)
Figure 41. Middle East and Africa Natural Caramel Color Revenue (USD Million) By Application (2021-2032)
Figure 42. Middle East and Africa Natural Caramel Color Revenue (USD Million) By Product (2021-2032)
By Type
Class I Caramel Color
Class II Caramel Color
Class III Caramel Color
Class IV Caramel Color
By Application
Bakery Goods
Soy Sauces
Alcoholic Beverage
Soft Drink
Others
Countries Analyzed
North America (US, Canada, Mexico)
Europe (Germany, UK, France, Spain, Italy, Russia, Rest of Europe)
Asia Pacific (China, India, Japan, South Korea, Australia, South East Asia, Rest of Asia)
South America (Brazil, Argentina, Rest of South America)
Middle East and Africa (Saudi Arabia, UAE, Rest of Middle East, South Africa, Egypt, Rest of Africa)
