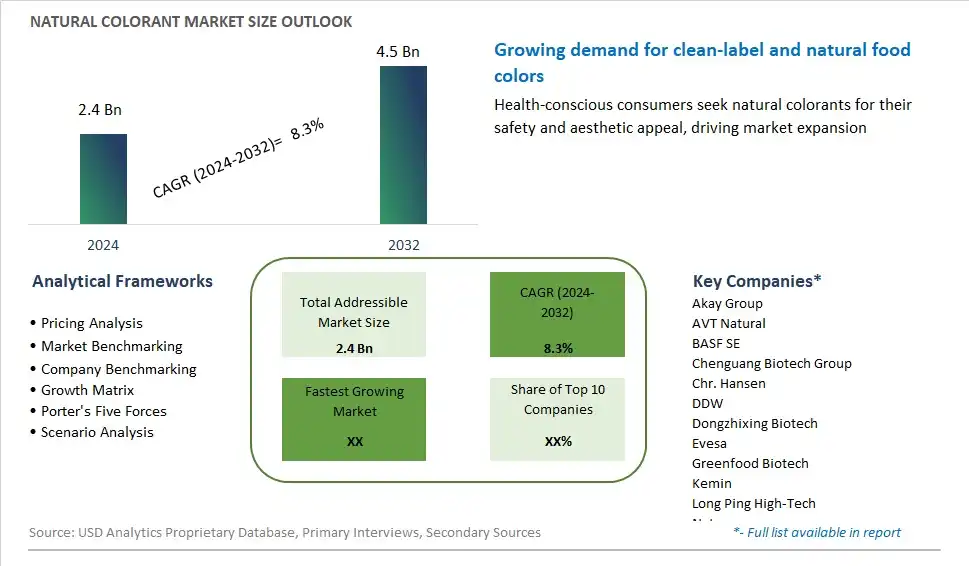
Global Natural Colorant Market Size is valued at $2.4 Billion in 2024 and is forecast to register a growth rate (CAGR) of 8.3% to reach $4.5 Billion by 2032.
The global Natural Colorant Market Comprehensive Study analyzes and forecasts the market size across 6 regions and 24 countries for diverse segments -By Type (Pigment, Dyes), By Process (Packaging, Paint and Coatings, Food & Beverages, Textiles, Paper & Printing, Others)
An Introduction to Natural Colorant Market
In 2024, the consumption of natural colorants is on the rise as consumers increasingly prioritize clean label products and seek alternatives to synthetic additives. Natural colorants derived from fruits, vegetables, herbs, and spices offer vibrant hues while aligning with clean label trends and sustainability concerns. From anthocyanins and beta-carotene to turmeric and spirulina extract, the natural colorant market is characterized by a diverse array of options that cater to various food and beverage applications. Moreover, regulatory pressures and consumer demand for transparency are driving manufacturers to reformulate products with natural colorants, spurring innovation in extraction methods, stability testing, and application technologies. As the natural food movement continues to gain momentum, the consumption of natural colorants is poised for sustained growth, reshaping the landscape of food and beverage formulation and marketing strategies.
Natural Colorant Competitive Landscape
The market report analyses the leading companies in the industry including Akay Group, AVT Natural, BASF SE, Chenguang Biotech Group, Chr. Hansen, DDW, Dongzhixing Biotech, Evesa, Greenfood Biotech, Kemin, Long Ping High-Tech, Naturex, Plant Lipids, Qingdao Scitech, San-Ei-Gen, Sensient Technologies Corp, Synthite Industries, Yunnan Rainbow Biotech, Zhongda Hengyuan, and Others.
Natural Colorant Market Dynamics
Natural Colorant Consumption Market Trend: Shift Towards Clean Label Products
The most prominent trend in the natural colorant consumption market is the shift towards clean label products. Consumers are increasingly demanding transparency about the ingredients in their food, beverages, and personal care products. This has led to a significant move away from synthetic colorants, which are often associated with health risks and negative perceptions, towards natural colorants derived from fruits, vegetables, herbs, and other plant sources. Natural colorants are perceived as safer, healthier, and more environmentally friendly. This trend is driven by growing health awareness, regulatory changes favoring natural ingredients, and the overall push for more sustainable and ethical consumption. The food and beverage industry, in particular, is seeing a rise in products labeled with terms like "no artificial colors" and "naturally colored," reflecting this consumer preference and reshaping the market landscape towards natural alternatives.
Market Driver: Increasing Health Consciousness and Demand for Natural Ingredients
A major driver of the natural colorant consumption market is the increasing health consciousness and demand for natural ingredients. Consumers are becoming more aware of the potential adverse effects of synthetic additives, including artificial colorants, which are linked to various health issues such as allergies and hyperactivity in children. This awareness is leading to a growing preference for products that contain natural ingredients, which are perceived to be safer and more beneficial to health. Additionally, the rise of organic and natural food markets is bolstering the demand for natural colorants, as these products often require colorants that align with their health-oriented branding. The increasing availability of information about the benefits of natural ingredients through digital media, health blogs, and influencers further drives consumer choices towards natural colorants, resulting in a robust demand across various sectors including food, beverages, cosmetics, and pharmaceuticals.
Market Opportunity: Innovation and Expansion in Emerging Markets
There is a significant opportunity for growth in the natural colorant consumption market through innovation and expansion in emerging markets. The development of new natural colorant sources and advanced extraction technologies can lead to a wider variety of vibrant and stable color options, catering to diverse consumer preferences and industrial requirements. For instance, advancements in biotechnology can enable the production of novel natural colorants with improved stability and color intensity. Additionally, emerging markets in regions such as Asia-Pacific, Latin America, and Africa present untapped potential due to their increasing urbanization, rising disposable incomes, and growing awareness of health and wellness. Companies can capitalize on these opportunities by introducing region-specific products and expanding their distribution networks. Strategic partnerships with local businesses and leveraging local agricultural resources for natural colorant production can also drive market penetration and growth, positioning companies to capture a significant share in these rapidly expanding markets.
Natural Colorant Consumption Market Share Analysis: Pigment held the dominant market share in 2024
The "Pigment" segment is the largest within the Natural Colorant Consumption market, driven by its versatility, stability, and wide range of applications across various industries. Natural pigments, derived from sources such as plants, fruits, and vegetables, offer vibrant and long-lasting color solutions for food, beverages, cosmetics, and textiles. With increasing consumer demand for natural and clean label products, manufacturers are increasingly opting for natural pigments to replace synthetic colorants. Further, the inherent stability of natural pigments against heat, light, and pH variations makes them suitable for a diverse range of manufacturing processes and end products. Additionally, the growing preference for plant-based and eco-friendly products further reinforces the dominance of the pigment segment in the Natural Colorant Consumption market. As consumers continue to prioritize natural ingredients and sustainability, the pigment segment is expected to maintain its leading position, shaping the future of the Natural Colorant Consumption market.
Natural Colorant Consumption Market Share Analysis: Food & Beverages market is poised to register the fastest growth rae over the forecast period to 2032
The "Food & Beverages" segment is the fastest-growing within the Natural Colorant Consumption market, fueled by increasing consumer demand for natural and clean label products. As awareness of the potential health risks associated with synthetic colorants grows, manufacturers in the food and beverage industry are increasingly shifting towards natural alternatives. Natural colorants derived from plant sources offer vibrant hues while meeting clean label requirements, thereby addressing consumer preferences for healthier and more transparent product formulations. Further, stringent regulations and guidelines governing food safety and labeling further incentivize the adoption of natural colorants in the food and beverage sector. Additionally, the rising popularity of plant-based and organic foods drives the demand for natural colorants as manufacturers seek to appeal to health-conscious consumers. With the continuous expansion of natural colorant applications in the food and beverage industry and ongoing consumer demand for clean label products, the segment is poised to sustain its rapid growth trajectory, reshaping the landscape of the Natural Colorant Consumption market.
Natural Colorant Market Segmentation
By Type
Pigment
Dyes
By Process
Packaging
Paint and Coatings
Food & Beverages
Textiles
Paper & Printing
Others
Countries Analyzed
North America (US, Canada, Mexico)
Europe (Germany, UK, France, Spain, Italy, Russia, Rest of Europe)
Asia Pacific (China, India, Japan, South Korea, Australia, South East Asia, Rest of Asia)
South America (Brazil, Argentina, Rest of South America)
Middle East and Africa (Saudi Arabia, UAE, Rest of Middle East, South Africa, Egypt, Rest of Africa)
Natural Colorant Companies Profiled in the Study
Akay Group
AVT Natural
BASF SE
Chenguang Biotech Group
Chr. Hansen
DDW
Dongzhixing Biotech
Evesa
Greenfood Biotech
Kemin
Long Ping High-Tech
Naturex
Plant Lipids
Qingdao Scitech
San-Ei-Gen
Sensient Technologies Corp
Synthite Industries
Yunnan Rainbow Biotech
Zhongda Hengyuan
*- List Not Exhaustive
Chapter 1. TABLE OF CONTENTS
Chapter 2. Introduction to Natural Colorant Market
2.1. Market Overview
2.2. Key Statistics and Report Highlights
2.3. Scope of the Comprehensive Study
2.3.1. Market Definition
2.3.2 Countries and Regions Covered
2.3.3 Research Objective
2.3.4 Units, Currency, and Conversions
2.3.5 Industry Value Chain
2.4. Key Market Segments
2.5. Key Companies
2.6. Study Period
Chapter 3. Strategic Analysis Review
3.1. Natural Colorant Pricing Analysis and Forecast
3.2. Porter’s Five Forces
3.3. Market Ecosystem
3.4. SWOT Analysis
3.5. Regulatory Scenario
3.3. Effects of Inflation, Russia-Ukraine War, moderating economic growth, and other macroeconomic factors
Chapter 4. Competitive Landscape
4.1. Market Share Analysis
4.1.1. Global Natural Colorant Market Share by Company, 2023
4.1.2. Product Offerings of Leading Natural Colorant Companies
4.2. Market Entropy
4.2.1. New Product Launches in the Industry
4.2.2. Mergers, Acquisitions, Joint ventures, and Partnerships
4.3. Key Strategies and Best Practices
Chapter 5. Global Market Projections: Best, Reference, and Low Case Scenarios
5.1. Growth Analysis- Case Scenario Definitions
5.2. Low Growth Case Scenario Forecasts
5.3. Reference Growth Case Scenario Forecasts
5.4. High Growth Case Scenario Forecasts
Chapter 6. Market Dynamics
6.1. Natural Colorant Market Drivers
6.2. Natural Colorant Market Challenges
6.6. Natural Colorant Market Opportunities
6.4. Natural Colorant Market Trends
Chapter 7. Global Natural Colorant Market Outlook Trends
7.1. Global Natural Colorant Revenue (USD Million) and CAGR (%) by Type (2021-2032)
7.2. Global Natural Colorant Revenue (USD Million) and CAGR (%) by Application (2021-2032)
7.3. Global Natural Colorant Revenue (USD Million) and CAGR (%) by Product (2021-2032)
By Type
Pigment
Dyes
By Process
Packaging
Paint and Coatings
Food & Beverages
Textiles
Paper & Printing
Others
Chapter 8. Global Natural Colorant Regional Analysis and Outlook
8.1. Global Natural Colorant Revenue (USD Million) By Regions (2021- 2032)
8.2. North America Natural Colorant Revenue (USD Million) by Country (2021-2032)
8.2.1. United States Natural Colorant Regional Analysis and Outlook
8.2.2. Canada Natural Colorant Regional Analysis and Outlook
8.2.3. Mexico Natural Colorant Regional Analysis and Outlook
8.3. Europe Natural Colorant Revenue (USD Million), by Country (2021-2032)
8.3.1. Germany Natural Colorant Regional Analysis and Outlook
8.3.2. France Natural Colorant Regional Analysis and Outlook
8.3.3. United Kingdom Natural Colorant Regional Analysis and Outlook
8.3.4. Spain Natural Colorant Regional Analysis and Outlook
8.3.5. Italy Natural Colorant Regional Analysis and Outlook
8.3.6. Russia Natural Colorant Regional Analysis and Outlook
8.3.7. Rest of Europe Natural Colorant Regional Analysis and Outlook
8.4. Asia Pacific Natural Colorant Revenue (USD Million) by Country (2021-2032)
8.4.1. China Natural Colorant Regional Analysis and Outlook
8.4.2. Japan Natural Colorant Regional Analysis and Outlook
8.4.3. India Natural Colorant Regional Analysis and Outlook
8.4.4. South Korea Natural Colorant Regional Analysis and Outlook
8.4.5. Australia Natural Colorant Regional Analysis and Outlook
8.4.6. South East Asia Natural Colorant Regional Analysis and Outlook
8.4.7. Rest of Asia Pacific Natural Colorant Regional Analysis and Outlook
8.5. South America Natural Colorant Revenue (USD Million), by Country (2021-2032)
8.5.1. Brazil Natural Colorant Regional Analysis and Outlook
8.5.2. Argentina Natural Colorant Regional Analysis and Outlook
8.5.3. Rest of South America Natural Colorant Regional Analysis and Outlook
8.6. Middle East and Africa Natural Colorant Revenue (USD Million) by Country (2021-2032)
8.6.1. Middle East Natural Colorant Regional Analysis and Outlook
8.6.2. Africa Natural Colorant Regional Analysis and Outlook
Chapter 9. North America Natural Colorant Analysis and Outlook
9.1. North America Natural Colorant Revenue (USD Million) by Segments (2021-2032)
9.1.1. North America Natural Colorant Revenue (USD Million) by Type (2021-2032)
9.1.2. North America Natural Colorant Revenue (USD Million) by Application (2021-2032)
9.1.3. North America Natural Colorant Revenue (USD Million) by Product (2021-2032)
By Type
Pigment
Dyes
By Process
Packaging
Paint and Coatings
Food & Beverages
Textiles
Paper & Printing
Others
Chapter 10. Europe Natural Colorant Analysis and Outlook
10.1. Europe Natural Colorant Revenue (USD Million), by Segments (USD Million) (2021-2032)
10.1.1. Europe Natural Colorant Revenue (USD Million) by Type (2021-2032)
10.1.2. Europe Natural Colorant Revenue (USD Million) by Application (2021-2032)
10.1.3. Europe Natural Colorant Revenue (USD Million) by Product (2021-2032)
By Type
Pigment
Dyes
By Process
Packaging
Paint and Coatings
Food & Beverages
Textiles
Paper & Printing
Others
Chapter 11. Asia Pacific Natural Colorant Analysis and Outlook
11.1. Asia Pacific Natural Colorant Revenue (USD Million), and Revenue (USD Million) by Segments (2021-2032)
11.1.1. Asia Pacific Natural Colorant Revenue (USD Million) by Type (2021-2032)
11.1.2. Asia Pacific Natural Colorant Revenue (USD Million) by Application (2021-2032)
11.1.3. Asia Pacific Natural Colorant Revenue (USD Million) by Product (2021-2032)
By Type
Pigment
Dyes
By Process
Packaging
Paint and Coatings
Food & Beverages
Textiles
Paper & Printing
Others
Chapter 12. South America Natural Colorant Analysis and Outlook
12.1. South America Natural Colorant Revenue (USD Million), by Segments (2021-2032)
12.1.1. South America Natural Colorant Revenue (USD Million) by Type (2021-2032)
12.1.2. South America Natural Colorant Revenue (USD Million) by Application (2021-2032)
12.1.3. South America Natural Colorant Revenue (USD Million) by Product (2021-2032)
By Type
Pigment
Dyes
By Process
Packaging
Paint and Coatings
Food & Beverages
Textiles
Paper & Printing
Others
Chapter 13. Middle East and Africa Natural Colorant Analysis and Outlook
13.1. Middle East and Africa Natural Colorant Revenue (USD Million), by Segments (2021-2032)
13.1.1. Middle East and Africa Natural Colorant Revenue (USD Million) by Type (2021-2032)
13.1.2. Middle East and Africa Natural Colorant Revenue (USD Million) by Application (2021-2032)
13.1.3. Middle East and Africa Natural Colorant Revenue (USD Million) by Product (2021-2032)
By Type
Pigment
Dyes
By Process
Packaging
Paint and Coatings
Food & Beverages
Textiles
Paper & Printing
Others
Chapter 14. Natural Colorant Company Profiles
14.1 Business Overview
14.2 Product Profiles
14.3 SWOT Profiles
14.5 Recent Developments
14.6 Financial Profile
List of Companies
Akay Group
AVT Natural
BASF SE
Chenguang Biotech Group
Chr. Hansen
DDW
Dongzhixing Biotech
Evesa
Greenfood Biotech
Kemin
Long Ping High-Tech
Naturex
Plant Lipids
Qingdao Scitech
San-Ei-Gen
Sensient Technologies Corp
Synthite Industries
Yunnan Rainbow Biotech
Zhongda Hengyuan
15. Methodology and Data Sources
15.1 Customization Offerings
15.2 Subscription Services
15.3 Related Reports
15.4 Publisher Expertise
LIST OF TABLES
Table 1 Market Segmentation Analysis
Table 2 Global Natural Colorant Market Share of Leading Companies, 2023
Table 3 Product Offerings of Leading Companies
Table 4 Low Growth Scenario Forecasts
Table 5 Reference Case Growth Scenario
Table 6 High Growth Case Scenario
Table 7 Global Natural Colorant Revenue (USD Million) And CAGR (%) By Type (2021-2032)
Table 8 Global Natural Colorant Revenue (USD Million) And CAGR (%) By Application (2021-2032)
Table 9 Global Natural Colorant Revenue (USD Million) And CAGR (%) By Product (2021-2032)
Table 10 Global Natural Colorant Market Revenue (USD Million) By Regions (2021-2032)
Table 11 Global Natural Colorant Market Share (%) By Regions (2021-2032)
Table 12 North America Natural Colorant Revenue (USD Million) By Country (2021-2032)
Table 13 Europe Natural Colorant Revenue (USD Million) By Country (2021-2032)
Table 14 Asia Pacific Natural Colorant Revenue (USD Million) By Country (2021-2032)
Table 15 South America Natural Colorant Revenue (USD Million) By Country (2021-2032)
Table 16 Middle East and Africa Natural Colorant Revenue (USD Million) By Region (2021-2032)
Table 17 North America Natural Colorant Revenue (USD Million) By Type (2021-2032)
Table 18 North America Natural Colorant Revenue (USD Million) By Application (2021-2032)
Table 19 North America Natural Colorant Revenue (USD Million) By Product (2021-2032)
Table 20 Europe Natural Colorant Revenue (USD Million) By Type (2021-2032)
Table 21 Europe Natural Colorant Revenue (USD Million) By Application (2021-2032)
Table 22 Europe Natural Colorant Revenue (USD Million) By Product (2021-2032)
Table 23 Asia Pacific Natural Colorant Revenue (USD Million) By Type (2021-2032)
Table 24 Asia Pacific Natural Colorant Revenue (USD Million) By Application (2021-2032)
Table 25 Asia Pacific Natural Colorant Revenue (USD Million) By Product (2021-2032)
Table 26 South America Natural Colorant Revenue (USD Million) By Type (2021-2032)
Table 27 South America Natural Colorant Revenue (USD Million) By Application (2021-2032)
Table 28 South America Natural Colorant Revenue (USD Million) By Product (2021-2032)
Table 29 Middle East and Africa Natural Colorant Revenue (USD Million) By Type (2021-2032)
Table 30 Middle East and Africa Natural Colorant Revenue (USD Million) By Application (2021-2032)
Table 31 Middle East and Africa Natural Colorant Revenue (USD Million) By Product (2021-2032)
LIST OF FIGURES
Figure 1. Market Scope
Figure 2. Pricing Forecasts Per Unit, 2023- 2032
Figure 3. Porter’s Five Forces
Figure 4. Global Natural Colorant Market Revenue (USD Million) By Regions (2021-2032)
Figure 5. Global Natural Colorant Market Share (%) By Regions (2023)
Figure 6. North America Natural Colorant Revenue (USD Million) By Country (2021-2032)
Figure 7. United States Natural Colorant Revenue (USD Million) By Country (2021-2032)
Figure 8. Canada Natural Colorant Revenue (USD Million) By Country (2021-2032)
Figure 9. Mexico Natural Colorant Revenue (USD Million) By Country (2021-2032)
Figure 10. Europe Natural Colorant Revenue (USD Million) By Country (2021-2032)
Figure 11. Germany Natural Colorant Revenue (USD Million) By Country (2021-2032)
Figure 12. France Natural Colorant Revenue (USD Million) By Country (2021-2032)
Figure 13. United Kingdom Natural Colorant Revenue (USD Million) By Country (2021-2032)
Figure 14. Spain Natural Colorant Revenue (USD Million) By Country (2021-2032)
Figure 15. Italy Natural Colorant Revenue (USD Million) By Country (2021-2032)
Figure 16. Russia Natural Colorant Revenue (USD Million) By Country (2021-2032)
Figure 17. Rest of Europe Natural Colorant Revenue (USD Million) By Country (2021-2032)
Figure 11. Asia Pacific Natural Colorant Revenue (USD Million) By Country (2021-2032)
Figure 12. China Natural Colorant Revenue (USD Million) By Country (2021-2032)
Figure 13. Japan Natural Colorant Revenue (USD Million) By Country (2021-2032)
Figure 14. India Natural Colorant Revenue (USD Million) By Country (2021-2032)
Figure 15. South Korea Natural Colorant Revenue (USD Million) By Country (2021-2032)
Figure 16. Australia Natural Colorant Revenue (USD Million) By Country (2021-2032)
Figure 17. South East Asia Natural Colorant Revenue (USD Million) By Country (2021-2032)
Figure 18. South America Natural Colorant Revenue (USD Million) By Country (2021-2032)
Figure 19. Brazil Natural Colorant Revenue (USD Million) By Country (2021-2032)
Figure 20. Argentina Natural Colorant Revenue (USD Million) By Country (2021-2032)
Figure 21. Rest of Asia Pacific Natural Colorant Revenue (USD Million) By Country (2021-2032)
Figure 22. Middle East and Africa Natural Colorant Revenue (USD Million) By Region (2021-2032)
Figure 23. Saudi Arabia Natural Colorant Revenue (USD Million) By Region (2021-2032)
Figure 24. The UAE Natural Colorant Revenue (USD Million) By Region (2021-2032)
Figure 25. Rest of Middle East Natural Colorant Revenue (USD Million) By Region (2021-2032)
Figure 26. South Africa Natural Colorant Revenue (USD Million) By Region (2021-2032)
Figure 27. Africa Natural Colorant Revenue (USD Million) By Region (2021-2032)
Figure 28. North America Natural Colorant Revenue (USD Million) By Type (2021-2032)
Figure 29. North America Natural Colorant Revenue (USD Million) By Application (2021-2032)
Figure 30. North America Natural Colorant Revenue (USD Million) By Product (2021-2032)
Figure 31. Europe Natural Colorant Revenue (USD Million) By Type (2021-2032)
Figure 32. Europe Natural Colorant Revenue (USD Million) By Application (2021-2032)
Figure 33. Europe Natural Colorant Revenue (USD Million) By Product (2021-2032)
Figure 34. Asia Pacific Natural Colorant Revenue (USD Million) By Type (2021-2032)
Figure 35. Asia Pacific Natural Colorant Revenue (USD Million) By Application (2021-2032)
Figure 36. Asia Pacific Natural Colorant Revenue (USD Million) By Product (2021-2032)
Figure 37. South America Natural Colorant Revenue (USD Million) By Type (2021-2032)
Figure 38. South America Natural Colorant Revenue (USD Million) By Application (2021-2032)
Figure 39. South America Natural Colorant Revenue (USD Million) By Product (2021-2032)
Figure 40. Middle East and Africa Natural Colorant Revenue (USD Million) By Type (2021-2032)
Figure 41. Middle East and Africa Natural Colorant Revenue (USD Million) By Application (2021-2032)
Figure 42. Middle East and Africa Natural Colorant Revenue (USD Million) By Product (2021-2032)
By Type
Pigment
Dyes
By Process
Packaging
Paint and Coatings
Food & Beverages
Textiles
Paper & Printing
Others
Countries Analyzed
North America (US, Canada, Mexico)
Europe (Germany, UK, France, Spain, Italy, Russia, Rest of Europe)
Asia Pacific (China, India, Japan, South Korea, Australia, South East Asia, Rest of Asia)
South America (Brazil, Argentina, Rest of South America)
Middle East and Africa (Saudi Arabia, UAE, Rest of Middle East, South Africa, Egypt, Rest of Africa)
