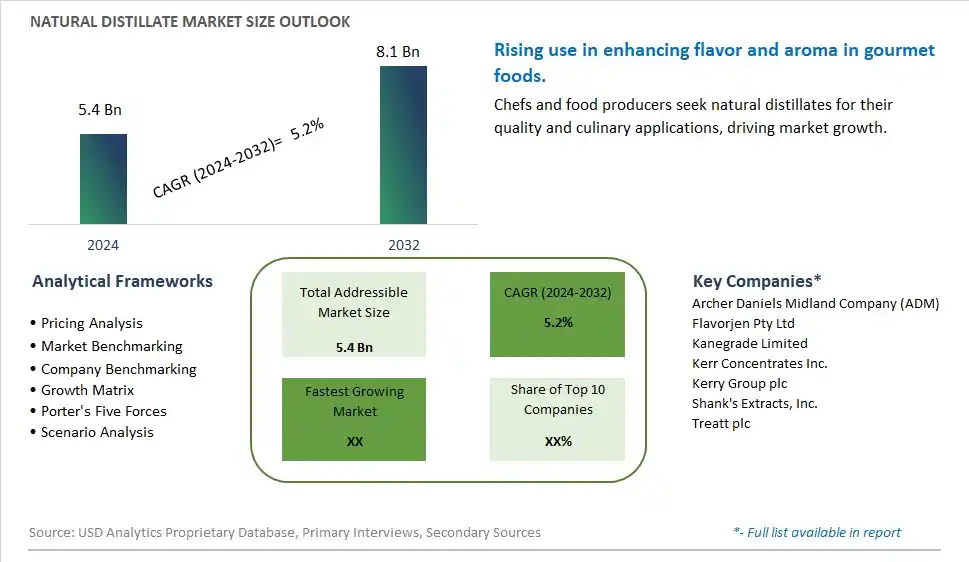
Global Natural Distillate Market Size is valued at $5.4 Billion in 2024 and is forecast to register a growth rate (CAGR) of 5.2% to reach $8.1 Billion by 2032.
The global Natural Distillate Market Comprehensive Study analyzes and forecasts the market size across 6 regions and 24 countries for diverse segments -By Product (Peach, Cherry, Coconut, Others), By Application (Personal Care and Cosmetics, Food and Beverage, Others), By Distribution Channel (Supermarkets/ Hypermarkets, Convenience Stores, Specialty Stores, Online Retail, Others)
An Introduction to Natural Distillate Market
In 2024, the natural distillate market is thriving, fueled by the demand for natural flavoring and aromatic ingredients in the food, beverage, and cosmetic industries. Natural distillates, derived from plant materials through steam distillation, offer concentrated flavors and scents. The market benefits from innovations in distillation technology and sustainable sourcing practices. The trend towards clean label and natural ingredients is influencing product development. Increasing consumer interest in natural and functional products, supported by the popularity of essential oils and natural flavors, is further supporting market growth.
Natural Distillate Competitive Landscape
The market report analyses the leading companies in the industry including Archer Daniels Midland Company (ADM), Flavorjen Pty Ltd, Kanegrade Limited, Kerr Concentrates Inc., Kerry Group plc, Shank's Extracts, Inc., Treatt plc, and Others.
Natural Distillate Market Dynamics
Natural Distillate Market Trend: Increasing Use of Natural Distillates in Flavors and Fragrances
The most prominent trend in the Natural Distillate Market is the increasing use of natural distillates in flavors and fragrances. Natural distillates, known for their purity and aromatic qualities, are being incorporated into a variety of products, including perfumes, cosmetics, and food flavorings, driven by consumer demand for natural and authentic ingredients.
Natural Distillate Market Driver: Growth of the Natural and Organic Products Market
Natural Distillate Market Share Analysis- Largest Segment by Product
The Coconut distillate segment is the largest in the Natural Distillate Market. Coconut distillates are widely used in personal care, food and beverage, and fragrance industries due to their versatile applications and appealing scent profile. The high demand for coconut-based products, driven by trends in natural and organic personal care items and culinary innovations, supports its leading position. Additionally, coconut distillates are valued for their stability and long shelf life, which enhances their market dominance.
Natural Distillate Market Share Analysis- Fastest Growing Segment by Application
The Personal Care and Cosmetics application segment is expected to grow the fastest in the Natural Distillate Market over the next five years. This growth is driven by the increasing consumer preference for natural and organic personal care products, where natural distillates are used for their fragrance and beneficial properties. The demand for high-quality, eco-friendly personal care products is accelerating the use of natural distillates in cosmetics and skincare. Additionally, regulatory trends favoring natural ingredients in personal care products contribute to this segment's rapid growth.
Natural Distillate Market Share Analysis- Largest Segment by Distribution Channel
The Supermarkets/Hypermarkets distribution channel is the largest in the Natural Distillate Market. Supermarkets and hypermarkets offer a wide range of natural distillate products and are well-positioned to cater to diverse consumer needs with their extensive product selections. The convenience of one-stop shopping and the ability to reach a broad consumer base make supermarkets and hypermarkets the leading distribution channel for natural distillates. Their established supply chains and promotional capabilities further solidify their dominant market position.
Natural Distillate Market Segmentation
By Product
Peach
Cherry
Coconut
Others
By Application
Personal Care and Cosmetics
Food and Beverage
Others
By Distribution Channel
Supermarkets/ Hypermarkets
Convenience Stores
Specialty Stores
Online Retail
Others
Countries Analyzed
North America (US, Canada, Mexico)
Europe (Germany, UK, France, Spain, Italy, Russia, Rest of Europe)
Asia Pacific (China, India, Japan, South Korea, Australia, South East Asia, Rest of Asia)
South America (Brazil, Argentina, Rest of South America)
Middle East and Africa (Saudi Arabia, UAE, Rest of Middle East, South Africa, Egypt, Rest of Africa)
Natural Distillate Companies Profiled in the Study
Archer Daniels Midland Company (ADM)
Flavorjen Pty Ltd
Kanegrade Limited
Kerr Concentrates Inc.
Kerry Group plc
Shank's Extracts, Inc.
Treatt plc
*- List Not Exhaustive
Chapter 1. TABLE OF CONTENTS
Chapter 2. Introduction to Natural Distillate Market
2.1. Market Overview
2.2. Key Statistics and Report Highlights
2.3. Scope of the Comprehensive Study
2.3.1. Market Definition
2.3.2 Countries and Regions Covered
2.3.3 Research Objective
2.3.4 Units, Currency, and Conversions
2.3.5 Industry Value Chain
2.4. Key Market Segments
2.5. Key Companies
2.6. Study Period
Chapter 3. Strategic Analysis Review
3.1. Natural Distillate Pricing Analysis and Forecast
3.2. Porter’s Five Forces
3.3. Market Ecosystem
3.4. SWOT Analysis
3.5. Regulatory Scenario
3.3. Effects of Inflation, Russia-Ukraine War, moderating economic growth, and other macroeconomic factors
Chapter 4. Competitive Landscape
4.1. Market Share Analysis
4.1.1. Global Natural Distillate Market Share by Company, 2023
4.1.2. Product Offerings of Leading Natural Distillate Companies
4.2. Market Entropy
4.2.1. New Product Launches in the Industry
4.2.2. Mergers, Acquisitions, Joint ventures, and Partnerships
4.3. Key Strategies and Best Practices
Chapter 5. Global Market Projections: Best, Reference, and Low Case Scenarios
5.1. Growth Analysis- Case Scenario Definitions
5.2. Low Growth Case Scenario Forecasts
5.3. Reference Growth Case Scenario Forecasts
5.4. High Growth Case Scenario Forecasts
Chapter 6. Market Dynamics
6.1. Natural Distillate Market Drivers
6.2. Natural Distillate Market Challenges
6.6. Natural Distillate Market Opportunities
6.4. Natural Distillate Market Trends
Chapter 7. Global Natural Distillate Market Outlook Trends
7.1. Global Natural Distillate Revenue (USD Million) and CAGR (%) by Type (2021-2032)
7.2. Global Natural Distillate Revenue (USD Million) and CAGR (%) by Application (2021-2032)
7.3. Global Natural Distillate Revenue (USD Million) and CAGR (%) by Product (2021-2032)
By Product
Peach
Cherry
Coconut
Others
By Application
Personal Care and Cosmetics
Food and Beverage
Others
By Distribution Channel
Supermarkets/ Hypermarkets
Convenience Stores
Specialty Stores
Online Retail
Others
Chapter 8. Global Natural Distillate Regional Analysis and Outlook
8.1. Global Natural Distillate Revenue (USD Million) By Regions (2021- 2032)
8.2. North America Natural Distillate Revenue (USD Million) by Country (2021-2032)
8.2.1. United States Natural Distillate Regional Analysis and Outlook
8.2.2. Canada Natural Distillate Regional Analysis and Outlook
8.2.3. Mexico Natural Distillate Regional Analysis and Outlook
8.3. Europe Natural Distillate Revenue (USD Million), by Country (2021-2032)
8.3.1. Germany Natural Distillate Regional Analysis and Outlook
8.3.2. France Natural Distillate Regional Analysis and Outlook
8.3.3. United Kingdom Natural Distillate Regional Analysis and Outlook
8.3.4. Spain Natural Distillate Regional Analysis and Outlook
8.3.5. Italy Natural Distillate Regional Analysis and Outlook
8.3.6. Russia Natural Distillate Regional Analysis and Outlook
8.3.7. Rest of Europe Natural Distillate Regional Analysis and Outlook
8.4. Asia Pacific Natural Distillate Revenue (USD Million) by Country (2021-2032)
8.4.1. China Natural Distillate Regional Analysis and Outlook
8.4.2. Japan Natural Distillate Regional Analysis and Outlook
8.4.3. India Natural Distillate Regional Analysis and Outlook
8.4.4. South Korea Natural Distillate Regional Analysis and Outlook
8.4.5. Australia Natural Distillate Regional Analysis and Outlook
8.4.6. South East Asia Natural Distillate Regional Analysis and Outlook
8.4.7. Rest of Asia Pacific Natural Distillate Regional Analysis and Outlook
8.5. South America Natural Distillate Revenue (USD Million), by Country (2021-2032)
8.5.1. Brazil Natural Distillate Regional Analysis and Outlook
8.5.2. Argentina Natural Distillate Regional Analysis and Outlook
8.5.3. Rest of South America Natural Distillate Regional Analysis and Outlook
8.6. Middle East and Africa Natural Distillate Revenue (USD Million) by Country (2021-2032)
8.6.1. Middle East Natural Distillate Regional Analysis and Outlook
8.6.2. Africa Natural Distillate Regional Analysis and Outlook
Chapter 9. North America Natural Distillate Analysis and Outlook
9.1. North America Natural Distillate Revenue (USD Million) by Segments (2021-2032)
9.1.1. North America Natural Distillate Revenue (USD Million) by Type (2021-2032)
9.1.2. North America Natural Distillate Revenue (USD Million) by Application (2021-2032)
9.1.3. North America Natural Distillate Revenue (USD Million) by Product (2021-2032)
By Product
Peach
Cherry
Coconut
Others
By Application
Personal Care and Cosmetics
Food and Beverage
Others
By Distribution Channel
Supermarkets/ Hypermarkets
Convenience Stores
Specialty Stores
Online Retail
Others
Chapter 10. Europe Natural Distillate Analysis and Outlook
10.1. Europe Natural Distillate Revenue (USD Million), by Segments (USD Million) (2021-2032)
10.1.1. Europe Natural Distillate Revenue (USD Million) by Type (2021-2032)
10.1.2. Europe Natural Distillate Revenue (USD Million) by Application (2021-2032)
10.1.3. Europe Natural Distillate Revenue (USD Million) by Product (2021-2032)
By Product
Peach
Cherry
Coconut
Others
By Application
Personal Care and Cosmetics
Food and Beverage
Others
By Distribution Channel
Supermarkets/ Hypermarkets
Convenience Stores
Specialty Stores
Online Retail
Others
Chapter 11. Asia Pacific Natural Distillate Analysis and Outlook
11.1. Asia Pacific Natural Distillate Revenue (USD Million), and Revenue (USD Million) by Segments (2021-2032)
11.1.1. Asia Pacific Natural Distillate Revenue (USD Million) by Type (2021-2032)
11.1.2. Asia Pacific Natural Distillate Revenue (USD Million) by Application (2021-2032)
11.1.3. Asia Pacific Natural Distillate Revenue (USD Million) by Product (2021-2032)
By Product
Peach
Cherry
Coconut
Others
By Application
Personal Care and Cosmetics
Food and Beverage
Others
By Distribution Channel
Supermarkets/ Hypermarkets
Convenience Stores
Specialty Stores
Online Retail
Others
Chapter 12. South America Natural Distillate Analysis and Outlook
12.1. South America Natural Distillate Revenue (USD Million), by Segments (2021-2032)
12.1.1. South America Natural Distillate Revenue (USD Million) by Type (2021-2032)
12.1.2. South America Natural Distillate Revenue (USD Million) by Application (2021-2032)
12.1.3. South America Natural Distillate Revenue (USD Million) by Product (2021-2032)
By Product
Peach
Cherry
Coconut
Others
By Application
Personal Care and Cosmetics
Food and Beverage
Others
By Distribution Channel
Supermarkets/ Hypermarkets
Convenience Stores
Specialty Stores
Online Retail
Others
Chapter 13. Middle East and Africa Natural Distillate Analysis and Outlook
13.1. Middle East and Africa Natural Distillate Revenue (USD Million), by Segments (2021-2032)
13.1.1. Middle East and Africa Natural Distillate Revenue (USD Million) by Type (2021-2032)
13.1.2. Middle East and Africa Natural Distillate Revenue (USD Million) by Application (2021-2032)
13.1.3. Middle East and Africa Natural Distillate Revenue (USD Million) by Product (2021-2032)
By Product
Peach
Cherry
Coconut
Others
By Application
Personal Care and Cosmetics
Food and Beverage
Others
By Distribution Channel
Supermarkets/ Hypermarkets
Convenience Stores
Specialty Stores
Online Retail
Others
Chapter 14. Natural Distillate Company Profiles
14.1 Business Overview
14.2 Product Profiles
14.3 SWOT Profiles
14.5 Recent Developments
14.6 Financial Profile
List of Companies
Archer Daniels Midland Company (ADM)
Flavorjen Pty Ltd
Kanegrade Limited
Kerr Concentrates Inc.
Kerry Group plc
Shank's Extracts, Inc.
Treatt plc
15. Methodology and Data Sources
15.1 Customization Offerings
15.2 Subscription Services
15.3 Related Reports
15.4 Publisher Expertise
LIST OF TABLES
Table 1 Market Segmentation Analysis
Table 2 Global Natural Distillate Market Share of Leading Companies, 2023
Table 3 Product Offerings of Leading Companies
Table 4 Low Growth Scenario Forecasts
Table 5 Reference Case Growth Scenario
Table 6 High Growth Case Scenario
Table 7 Global Natural Distillate Revenue (USD Million) And CAGR (%) By Type (2021-2032)
Table 8 Global Natural Distillate Revenue (USD Million) And CAGR (%) By Application (2021-2032)
Table 9 Global Natural Distillate Revenue (USD Million) And CAGR (%) By Product (2021-2032)
Table 10 Global Natural Distillate Market Revenue (USD Million) By Regions (2021-2032)
Table 11 Global Natural Distillate Market Share (%) By Regions (2021-2032)
Table 12 North America Natural Distillate Revenue (USD Million) By Country (2021-2032)
Table 13 Europe Natural Distillate Revenue (USD Million) By Country (2021-2032)
Table 14 Asia Pacific Natural Distillate Revenue (USD Million) By Country (2021-2032)
Table 15 South America Natural Distillate Revenue (USD Million) By Country (2021-2032)
Table 16 Middle East and Africa Natural Distillate Revenue (USD Million) By Region (2021-2032)
Table 17 North America Natural Distillate Revenue (USD Million) By Type (2021-2032)
Table 18 North America Natural Distillate Revenue (USD Million) By Application (2021-2032)
Table 19 North America Natural Distillate Revenue (USD Million) By Product (2021-2032)
Table 20 Europe Natural Distillate Revenue (USD Million) By Type (2021-2032)
Table 21 Europe Natural Distillate Revenue (USD Million) By Application (2021-2032)
Table 22 Europe Natural Distillate Revenue (USD Million) By Product (2021-2032)
Table 23 Asia Pacific Natural Distillate Revenue (USD Million) By Type (2021-2032)
Table 24 Asia Pacific Natural Distillate Revenue (USD Million) By Application (2021-2032)
Table 25 Asia Pacific Natural Distillate Revenue (USD Million) By Product (2021-2032)
Table 26 South America Natural Distillate Revenue (USD Million) By Type (2021-2032)
Table 27 South America Natural Distillate Revenue (USD Million) By Application (2021-2032)
Table 28 South America Natural Distillate Revenue (USD Million) By Product (2021-2032)
Table 29 Middle East and Africa Natural Distillate Revenue (USD Million) By Type (2021-2032)
Table 30 Middle East and Africa Natural Distillate Revenue (USD Million) By Application (2021-2032)
Table 31 Middle East and Africa Natural Distillate Revenue (USD Million) By Product (2021-2032)
LIST OF FIGURES
Figure 1. Market Scope
Figure 2. Pricing Forecasts Per Unit, 2023- 2032
Figure 3. Porter’s Five Forces
Figure 4. Global Natural Distillate Market Revenue (USD Million) By Regions (2021-2032)
Figure 5. Global Natural Distillate Market Share (%) By Regions (2023)
Figure 6. North America Natural Distillate Revenue (USD Million) By Country (2021-2032)
Figure 7. United States Natural Distillate Revenue (USD Million) By Country (2021-2032)
Figure 8. Canada Natural Distillate Revenue (USD Million) By Country (2021-2032)
Figure 9. Mexico Natural Distillate Revenue (USD Million) By Country (2021-2032)
Figure 10. Europe Natural Distillate Revenue (USD Million) By Country (2021-2032)
Figure 11. Germany Natural Distillate Revenue (USD Million) By Country (2021-2032)
Figure 12. France Natural Distillate Revenue (USD Million) By Country (2021-2032)
Figure 13. United Kingdom Natural Distillate Revenue (USD Million) By Country (2021-2032)
Figure 14. Spain Natural Distillate Revenue (USD Million) By Country (2021-2032)
Figure 15. Italy Natural Distillate Revenue (USD Million) By Country (2021-2032)
Figure 16. Russia Natural Distillate Revenue (USD Million) By Country (2021-2032)
Figure 17. Rest of Europe Natural Distillate Revenue (USD Million) By Country (2021-2032)
Figure 11. Asia Pacific Natural Distillate Revenue (USD Million) By Country (2021-2032)
Figure 12. China Natural Distillate Revenue (USD Million) By Country (2021-2032)
Figure 13. Japan Natural Distillate Revenue (USD Million) By Country (2021-2032)
Figure 14. India Natural Distillate Revenue (USD Million) By Country (2021-2032)
Figure 15. South Korea Natural Distillate Revenue (USD Million) By Country (2021-2032)
Figure 16. Australia Natural Distillate Revenue (USD Million) By Country (2021-2032)
Figure 17. South East Asia Natural Distillate Revenue (USD Million) By Country (2021-2032)
Figure 18. South America Natural Distillate Revenue (USD Million) By Country (2021-2032)
Figure 19. Brazil Natural Distillate Revenue (USD Million) By Country (2021-2032)
Figure 20. Argentina Natural Distillate Revenue (USD Million) By Country (2021-2032)
Figure 21. Rest of Asia Pacific Natural Distillate Revenue (USD Million) By Country (2021-2032)
Figure 22. Middle East and Africa Natural Distillate Revenue (USD Million) By Region (2021-2032)
Figure 23. Saudi Arabia Natural Distillate Revenue (USD Million) By Region (2021-2032)
Figure 24. The UAE Natural Distillate Revenue (USD Million) By Region (2021-2032)
Figure 25. Rest of Middle East Natural Distillate Revenue (USD Million) By Region (2021-2032)
Figure 26. South Africa Natural Distillate Revenue (USD Million) By Region (2021-2032)
Figure 27. Africa Natural Distillate Revenue (USD Million) By Region (2021-2032)
Figure 28. North America Natural Distillate Revenue (USD Million) By Type (2021-2032)
Figure 29. North America Natural Distillate Revenue (USD Million) By Application (2021-2032)
Figure 30. North America Natural Distillate Revenue (USD Million) By Product (2021-2032)
Figure 31. Europe Natural Distillate Revenue (USD Million) By Type (2021-2032)
Figure 32. Europe Natural Distillate Revenue (USD Million) By Application (2021-2032)
Figure 33. Europe Natural Distillate Revenue (USD Million) By Product (2021-2032)
Figure 34. Asia Pacific Natural Distillate Revenue (USD Million) By Type (2021-2032)
Figure 35. Asia Pacific Natural Distillate Revenue (USD Million) By Application (2021-2032)
Figure 36. Asia Pacific Natural Distillate Revenue (USD Million) By Product (2021-2032)
Figure 37. South America Natural Distillate Revenue (USD Million) By Type (2021-2032)
Figure 38. South America Natural Distillate Revenue (USD Million) By Application (2021-2032)
Figure 39. South America Natural Distillate Revenue (USD Million) By Product (2021-2032)
Figure 40. Middle East and Africa Natural Distillate Revenue (USD Million) By Type (2021-2032)
Figure 41. Middle East and Africa Natural Distillate Revenue (USD Million) By Application (2021-2032)
Figure 42. Middle East and Africa Natural Distillate Revenue (USD Million) By Product (2021-2032)
By Product
Peach
Cherry
Coconut
Others
By Application
Personal Care and Cosmetics
Food and Beverage
Others
By Distribution Channel
Supermarkets/ Hypermarkets
Convenience Stores
Specialty Stores
Online Retail
Others
Countries Analyzed
North America (US, Canada, Mexico)
Europe (Germany, UK, France, Spain, Italy, Russia, Rest of Europe)
Asia Pacific (China, India, Japan, South Korea, Australia, South East Asia, Rest of Asia)
South America (Brazil, Argentina, Rest of South America)
Middle East and Africa (Saudi Arabia, UAE, Rest of Middle East, South Africa, Egypt, Rest of Africa)
