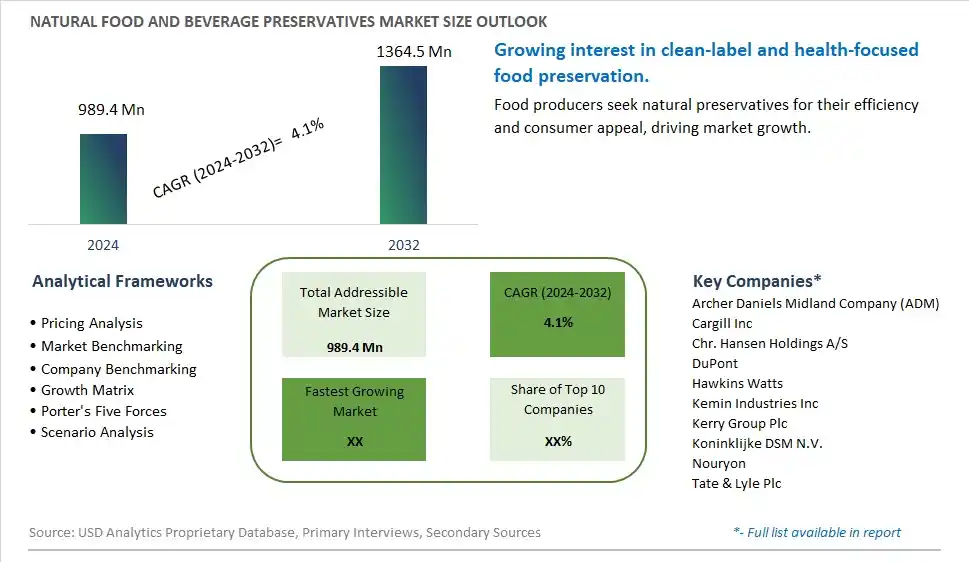
Global Natural Food and Beverage Preservatives Market Size is valued at $989.4 Million in 2024 and is forecast to register a growth rate (CAGR) of 4.1% to reach $1364.5 Million by 2032.
The global Natural Food and Beverage Preservatives Market Comprehensive Study analyzes and forecasts the market size across 6 regions and 24 countries for diverse segments -By Product (Edible Oil, Rosemary Extracts, Natamycin, Vinegar, Chitosan, Others), By Function (Antimicrobials, Antioxidants, Chelating Agents, Flavoring agents, Restaurants, Emulsifier, Others), By Application (Bakery and Confectionery, Beverages, Meat, Poultry & Seafood, Frozen Food, Dairy products, Snack Food, Fats and Oils, Others), By Form (Solid, Liquid)
An Introduction to Natural Food and Beverage Preservatives Market
In 2024, the natural food and beverage preservatives market is thriving, fueled by the demand for clean label and natural preservation solutions. Natural preservatives, including rosemary extract, vinegar, and citrus derivatives, offer antimicrobial and antioxidant properties that extend shelf life. The market benefits from advancements in extraction and formulation technologies that enhance efficacy and stability. The trend towards clean label and natural ingredients is influencing product development. Increasing consumer awareness of food safety and the desire for preservative-free products are further supporting market growth.
Natural Food and Beverage Preservatives Competitive Landscape
The market report analyses the leading companies in the industry including Archer Daniels Midland Company (ADM), Cargill Inc, Chr. Hansen Holdings A/S, DuPont, Hawkins Watts, Kemin Industries Inc, Kerry Group Plc, Koninklijke DSM N.V., Nouryon, Tate & Lyle Plc, and Others.
Natural Food and Beverage Preservatives Market Dynamics
Natural Food and Beverage Preservatives Market Trend: Increasing Demand for Natural Preservatives in Clean Label Foods
The most prominent trend in the Natural Food and Beverage Preservatives Market is the increasing demand for natural preservatives in clean label foods. As consumers seek food and beverages made with natural ingredients and free from synthetic additives, there is a growing demand for natural preservatives that ensure product safety and longevity.
Natural Food and Beverage Preservatives Market Driver: Health Consciousness and Regulatory Pressures
A key driver in the Natural Food and Beverage Preservatives Market is health consciousness and regulatory pressures. As more individuals focus on improving their diet and avoiding artificial preservatives, and as regulations become stricter regarding food safety, there is a rising demand for natural preservatives that meet clean label standards and comply with regulatory requirements, supporting market growth.
Natural Food and Beverage Preservatives Market Opportunity: Innovation in Natural Preservative Formulations
One significant opportunity in the Natural Food and Beverage Preservatives Market lies in innovation in natural preservative formulations. Companies can develop new natural preservatives that offer enhanced antimicrobial and antioxidant properties, catering to the needs of food and beverage manufacturers and ensuring product quality and safety, driving market growth.
Natural Food and Beverage Preservatives Market Share Analysis- Largest Segment by Product
The Rosemary Extracts segment is the largest in the Natural Food and Beverage Preservatives Market. Rosemary extracts are highly valued for their antioxidant properties, which help extend the shelf life of food products by inhibiting oxidation. Their natural origin and effectiveness in preserving flavor and color make them a popular choice among manufacturers. The increasing demand for clean-label and natural ingredients in food and beverages drives the preference for rosemary extracts, contributing to their dominant position in the market.
Natural Food and Beverage Preservatives Market Share Analysis- Fastest Growing Segment by Function
The Antimicrobials function segment is expected to grow fastest in the Natural Food and Beverage Preservatives Market over the next five years. This growth is attributed to the rising consumer demand for preservatives that can effectively inhibit microbial growth and ensure food safety without compromising natural labeling. Antimicrobial preservatives, including natural options like essential oils and plant extracts, are becoming increasingly popular due to their effectiveness and alignment with clean-label trends. The heightened focus on food safety and longer shelf life drives the adoption of antimicrobial preservatives in the market.
Natural Food and Beverage Preservatives Market Share Analysis- Largest Segment by Application
The Beverages application segment is the largest in the Natural Food and Beverage Preservatives Market. Beverages require preservatives to maintain freshness, flavor, and stability over time, which drives significant demand for natural preservatives. The sector's diversity, including juices, soft drinks, and functional beverages, necessitates a wide range of preservative solutions to cater to different formulations and shelf-life requirements. The increasing consumer preference for natural and organic beverages further propels the dominance of the beverages segment in the natural preservatives market.
Natural Food and Beverage Preservatives Market Share Analysis- Fastest Growing Segment by Form
The Liquid form of natural food and beverage preservatives is poised to grow fastest over the next five years. This growth is driven by the versatility and ease of incorporation of liquid preservatives into a wide range of food and beverage products. Liquid preservatives are preferred for their ability to be evenly distributed throughout a product, ensuring consistent preservation and extended shelf life. Additionally, the increasing consumer demand for clean label products and natural ingredients that align with health-conscious trends is propelling the adoption of liquid preservatives. The rapid growth in the beverage industry, where liquid preservatives are widely used, further supports this trend.
Natural Food and Beverage Preservatives Market Segmentation
By Product
Edible Oil
Rosemary Extracts
Natamycin
Vinegar
Chitosan
Others
By Function
Antimicrobials
Antioxidants
Chelating Agents
Flavoring agents
Restaurants
Emulsifier
Others
By Application
Bakery and Confectionery
Beverages
Meat, Poultry & Seafood
Frozen Food
Dairy products
Snack Food
Fats and Oils
Others
By Form
Solid
Liquid
Countries Analyzed
North America (US, Canada, Mexico)
Europe (Germany, UK, France, Spain, Italy, Russia, Rest of Europe)
Asia Pacific (China, India, Japan, South Korea, Australia, South East Asia, Rest of Asia)
South America (Brazil, Argentina, Rest of South America)
Middle East and Africa (Saudi Arabia, UAE, Rest of Middle East, South Africa, Egypt, Rest of Africa)
Natural Food and Beverage Preservatives Companies Profiled in the Study
Archer Daniels Midland Company (ADM)
Cargill Inc
Chr. Hansen Holdings A/S
DuPont
Hawkins Watts
Kemin Industries Inc
Kerry Group Plc
Koninklijke DSM N.V.
Nouryon
Tate & Lyle Plc
*- List Not Exhaustive
Chapter 1. TABLE OF CONTENTS
Chapter 2. Introduction to Natural Food and Beverage Preservatives Market
2.1. Market Overview
2.2. Key Statistics and Report Highlights
2.3. Scope of the Comprehensive Study
2.3.1. Market Definition
2.3.2 Countries and Regions Covered
2.3.3 Research Objective
2.3.4 Units, Currency, and Conversions
2.3.5 Industry Value Chain
2.4. Key Market Segments
2.5. Key Companies
2.6. Study Period
Chapter 3. Strategic Analysis Review
3.1. Natural Food and Beverage Preservatives Pricing Analysis and Forecast
3.2. Porter’s Five Forces
3.3. Market Ecosystem
3.4. SWOT Analysis
3.5. Regulatory Scenario
3.3. Effects of Inflation, Russia-Ukraine War, moderating economic growth, and other macroeconomic factors
Chapter 4. Competitive Landscape
4.1. Market Share Analysis
4.1.1. Global Natural Food and Beverage Preservatives Market Share by Company, 2023
4.1.2. Product Offerings of Leading Natural Food and Beverage Preservatives Companies
4.2. Market Entropy
4.2.1. New Product Launches in the Industry
4.2.2. Mergers, Acquisitions, Joint ventures, and Partnerships
4.3. Key Strategies and Best Practices
Chapter 5. Global Market Projections: Best, Reference, and Low Case Scenarios
5.1. Growth Analysis- Case Scenario Definitions
5.2. Low Growth Case Scenario Forecasts
5.3. Reference Growth Case Scenario Forecasts
5.4. High Growth Case Scenario Forecasts
Chapter 6. Market Dynamics
6.1. Natural Food and Beverage Preservatives Market Drivers
6.2. Natural Food and Beverage Preservatives Market Challenges
6.6. Natural Food and Beverage Preservatives Market Opportunities
6.4. Natural Food and Beverage Preservatives Market Trends
Chapter 7. Global Natural Food and Beverage Preservatives Market Outlook Trends
7.1. Global Natural Food and Beverage Preservatives Revenue (USD Million) and CAGR (%) by Type (2021-2032)
7.2. Global Natural Food and Beverage Preservatives Revenue (USD Million) and CAGR (%) by Application (2021-2032)
7.3. Global Natural Food and Beverage Preservatives Revenue (USD Million) and CAGR (%) by Product (2021-2032)
By Product
Edible Oil
Rosemary Extracts
Natamycin
Vinegar
Chitosan
Others
By Function
Antimicrobials
Antioxidants
Chelating Agents
Flavoring agents
Restaurants
Emulsifier
Others
By Application
Bakery and Confectionery
Beverages
Meat, Poultry & Seafood
Frozen Food
Dairy products
Snack Food
Fats and Oils
Others
By Form
Solid
Liquid
Chapter 8. Global Natural Food and Beverage Preservatives Regional Analysis and Outlook
8.1. Global Natural Food and Beverage Preservatives Revenue (USD Million) By Regions (2021- 2032)
8.2. North America Natural Food and Beverage Preservatives Revenue (USD Million) by Country (2021-2032)
8.2.1. United States Natural Food and Beverage Preservatives Regional Analysis and Outlook
8.2.2. Canada Natural Food and Beverage Preservatives Regional Analysis and Outlook
8.2.3. Mexico Natural Food and Beverage Preservatives Regional Analysis and Outlook
8.3. Europe Natural Food and Beverage Preservatives Revenue (USD Million), by Country (2021-2032)
8.3.1. Germany Natural Food and Beverage Preservatives Regional Analysis and Outlook
8.3.2. France Natural Food and Beverage Preservatives Regional Analysis and Outlook
8.3.3. United Kingdom Natural Food and Beverage Preservatives Regional Analysis and Outlook
8.3.4. Spain Natural Food and Beverage Preservatives Regional Analysis and Outlook
8.3.5. Italy Natural Food and Beverage Preservatives Regional Analysis and Outlook
8.3.6. Russia Natural Food and Beverage Preservatives Regional Analysis and Outlook
8.3.7. Rest of Europe Natural Food and Beverage Preservatives Regional Analysis and Outlook
8.4. Asia Pacific Natural Food and Beverage Preservatives Revenue (USD Million) by Country (2021-2032)
8.4.1. China Natural Food and Beverage Preservatives Regional Analysis and Outlook
8.4.2. Japan Natural Food and Beverage Preservatives Regional Analysis and Outlook
8.4.3. India Natural Food and Beverage Preservatives Regional Analysis and Outlook
8.4.4. South Korea Natural Food and Beverage Preservatives Regional Analysis and Outlook
8.4.5. Australia Natural Food and Beverage Preservatives Regional Analysis and Outlook
8.4.6. South East Asia Natural Food and Beverage Preservatives Regional Analysis and Outlook
8.4.7. Rest of Asia Pacific Natural Food and Beverage Preservatives Regional Analysis and Outlook
8.5. South America Natural Food and Beverage Preservatives Revenue (USD Million), by Country (2021-2032)
8.5.1. Brazil Natural Food and Beverage Preservatives Regional Analysis and Outlook
8.5.2. Argentina Natural Food and Beverage Preservatives Regional Analysis and Outlook
8.5.3. Rest of South America Natural Food and Beverage Preservatives Regional Analysis and Outlook
8.6. Middle East and Africa Natural Food and Beverage Preservatives Revenue (USD Million) by Country (2021-2032)
8.6.1. Middle East Natural Food and Beverage Preservatives Regional Analysis and Outlook
8.6.2. Africa Natural Food and Beverage Preservatives Regional Analysis and Outlook
Chapter 9. North America Natural Food and Beverage Preservatives Analysis and Outlook
9.1. North America Natural Food and Beverage Preservatives Revenue (USD Million) by Segments (2021-2032)
9.1.1. North America Natural Food and Beverage Preservatives Revenue (USD Million) by Type (2021-2032)
9.1.2. North America Natural Food and Beverage Preservatives Revenue (USD Million) by Application (2021-2032)
9.1.3. North America Natural Food and Beverage Preservatives Revenue (USD Million) by Product (2021-2032)
By Product
Edible Oil
Rosemary Extracts
Natamycin
Vinegar
Chitosan
Others
By Function
Antimicrobials
Antioxidants
Chelating Agents
Flavoring agents
Restaurants
Emulsifier
Others
By Application
Bakery and Confectionery
Beverages
Meat, Poultry & Seafood
Frozen Food
Dairy products
Snack Food
Fats and Oils
Others
By Form
Solid
Liquid
Chapter 10. Europe Natural Food and Beverage Preservatives Analysis and Outlook
10.1. Europe Natural Food and Beverage Preservatives Revenue (USD Million), by Segments (USD Million) (2021-2032)
10.1.1. Europe Natural Food and Beverage Preservatives Revenue (USD Million) by Type (2021-2032)
10.1.2. Europe Natural Food and Beverage Preservatives Revenue (USD Million) by Application (2021-2032)
10.1.3. Europe Natural Food and Beverage Preservatives Revenue (USD Million) by Product (2021-2032)
By Product
Edible Oil
Rosemary Extracts
Natamycin
Vinegar
Chitosan
Others
By Function
Antimicrobials
Antioxidants
Chelating Agents
Flavoring agents
Restaurants
Emulsifier
Others
By Application
Bakery and Confectionery
Beverages
Meat, Poultry & Seafood
Frozen Food
Dairy products
Snack Food
Fats and Oils
Others
By Form
Solid
Liquid
Chapter 11. Asia Pacific Natural Food and Beverage Preservatives Analysis and Outlook
11.1. Asia Pacific Natural Food and Beverage Preservatives Revenue (USD Million), and Revenue (USD Million) by Segments (2021-2032)
11.1.1. Asia Pacific Natural Food and Beverage Preservatives Revenue (USD Million) by Type (2021-2032)
11.1.2. Asia Pacific Natural Food and Beverage Preservatives Revenue (USD Million) by Application (2021-2032)
11.1.3. Asia Pacific Natural Food and Beverage Preservatives Revenue (USD Million) by Product (2021-2032)
By Product
Edible Oil
Rosemary Extracts
Natamycin
Vinegar
Chitosan
Others
By Function
Antimicrobials
Antioxidants
Chelating Agents
Flavoring agents
Restaurants
Emulsifier
Others
By Application
Bakery and Confectionery
Beverages
Meat, Poultry & Seafood
Frozen Food
Dairy products
Snack Food
Fats and Oils
Others
By Form
Solid
Liquid
Chapter 12. South America Natural Food and Beverage Preservatives Analysis and Outlook
12.1. South America Natural Food and Beverage Preservatives Revenue (USD Million), by Segments (2021-2032)
12.1.1. South America Natural Food and Beverage Preservatives Revenue (USD Million) by Type (2021-2032)
12.1.2. South America Natural Food and Beverage Preservatives Revenue (USD Million) by Application (2021-2032)
12.1.3. South America Natural Food and Beverage Preservatives Revenue (USD Million) by Product (2021-2032)
By Product
Edible Oil
Rosemary Extracts
Natamycin
Vinegar
Chitosan
Others
By Function
Antimicrobials
Antioxidants
Chelating Agents
Flavoring agents
Restaurants
Emulsifier
Others
By Application
Bakery and Confectionery
Beverages
Meat, Poultry & Seafood
Frozen Food
Dairy products
Snack Food
Fats and Oils
Others
By Form
Solid
Liquid
Chapter 13. Middle East and Africa Natural Food and Beverage Preservatives Analysis and Outlook
13.1. Middle East and Africa Natural Food and Beverage Preservatives Revenue (USD Million), by Segments (2021-2032)
13.1.1. Middle East and Africa Natural Food and Beverage Preservatives Revenue (USD Million) by Type (2021-2032)
13.1.2. Middle East and Africa Natural Food and Beverage Preservatives Revenue (USD Million) by Application (2021-2032)
13.1.3. Middle East and Africa Natural Food and Beverage Preservatives Revenue (USD Million) by Product (2021-2032)
By Product
Edible Oil
Rosemary Extracts
Natamycin
Vinegar
Chitosan
Others
By Function
Antimicrobials
Antioxidants
Chelating Agents
Flavoring agents
Restaurants
Emulsifier
Others
By Application
Bakery and Confectionery
Beverages
Meat, Poultry & Seafood
Frozen Food
Dairy products
Snack Food
Fats and Oils
Others
By Form
Solid
Liquid
Chapter 14. Natural Food and Beverage Preservatives Company Profiles
14.1 Business Overview
14.2 Product Profiles
14.3 SWOT Profiles
14.5 Recent Developments
14.6 Financial Profile
List of Companies
Archer Daniels Midland Company (ADM)
Cargill Inc
Chr. Hansen Holdings A/S
DuPont
Hawkins Watts
Kemin Industries Inc
Kerry Group Plc
Koninklijke DSM N.V.
Nouryon
Tate & Lyle Plc
15. Methodology and Data Sources
15.1 Customization Offerings
15.2 Subscription Services
15.3 Related Reports
15.4 Publisher Expertise
LIST OF TABLES
Table 1 Market Segmentation Analysis
Table 2 Global Natural Food and Beverage Preservatives Market Share of Leading Companies, 2023
Table 3 Product Offerings of Leading Companies
Table 4 Low Growth Scenario Forecasts
Table 5 Reference Case Growth Scenario
Table 6 High Growth Case Scenario
Table 7 Global Natural Food and Beverage Preservatives Revenue (USD Million) And CAGR (%) By Type (2021-2032)
Table 8 Global Natural Food and Beverage Preservatives Revenue (USD Million) And CAGR (%) By Application (2021-2032)
Table 9 Global Natural Food and Beverage Preservatives Revenue (USD Million) And CAGR (%) By Product (2021-2032)
Table 10 Global Natural Food and Beverage Preservatives Market Revenue (USD Million) By Regions (2021-2032)
Table 11 Global Natural Food and Beverage Preservatives Market Share (%) By Regions (2021-2032)
Table 12 North America Natural Food and Beverage Preservatives Revenue (USD Million) By Country (2021-2032)
Table 13 Europe Natural Food and Beverage Preservatives Revenue (USD Million) By Country (2021-2032)
Table 14 Asia Pacific Natural Food and Beverage Preservatives Revenue (USD Million) By Country (2021-2032)
Table 15 South America Natural Food and Beverage Preservatives Revenue (USD Million) By Country (2021-2032)
Table 16 Middle East and Africa Natural Food and Beverage Preservatives Revenue (USD Million) By Region (2021-2032)
Table 17 North America Natural Food and Beverage Preservatives Revenue (USD Million) By Type (2021-2032)
Table 18 North America Natural Food and Beverage Preservatives Revenue (USD Million) By Application (2021-2032)
Table 19 North America Natural Food and Beverage Preservatives Revenue (USD Million) By Product (2021-2032)
Table 20 Europe Natural Food and Beverage Preservatives Revenue (USD Million) By Type (2021-2032)
Table 21 Europe Natural Food and Beverage Preservatives Revenue (USD Million) By Application (2021-2032)
Table 22 Europe Natural Food and Beverage Preservatives Revenue (USD Million) By Product (2021-2032)
Table 23 Asia Pacific Natural Food and Beverage Preservatives Revenue (USD Million) By Type (2021-2032)
Table 24 Asia Pacific Natural Food and Beverage Preservatives Revenue (USD Million) By Application (2021-2032)
Table 25 Asia Pacific Natural Food and Beverage Preservatives Revenue (USD Million) By Product (2021-2032)
Table 26 South America Natural Food and Beverage Preservatives Revenue (USD Million) By Type (2021-2032)
Table 27 South America Natural Food and Beverage Preservatives Revenue (USD Million) By Application (2021-2032)
Table 28 South America Natural Food and Beverage Preservatives Revenue (USD Million) By Product (2021-2032)
Table 29 Middle East and Africa Natural Food and Beverage Preservatives Revenue (USD Million) By Type (2021-2032)
Table 30 Middle East and Africa Natural Food and Beverage Preservatives Revenue (USD Million) By Application (2021-2032)
Table 31 Middle East and Africa Natural Food and Beverage Preservatives Revenue (USD Million) By Product (2021-2032)
LIST OF FIGURES
Figure 1. Market Scope
Figure 2. Pricing Forecasts Per Unit, 2023- 2032
Figure 3. Porter’s Five Forces
Figure 4. Global Natural Food and Beverage Preservatives Market Revenue (USD Million) By Regions (2021-2032)
Figure 5. Global Natural Food and Beverage Preservatives Market Share (%) By Regions (2023)
Figure 6. North America Natural Food and Beverage Preservatives Revenue (USD Million) By Country (2021-2032)
Figure 7. United States Natural Food and Beverage Preservatives Revenue (USD Million) By Country (2021-2032)
Figure 8. Canada Natural Food and Beverage Preservatives Revenue (USD Million) By Country (2021-2032)
Figure 9. Mexico Natural Food and Beverage Preservatives Revenue (USD Million) By Country (2021-2032)
Figure 10. Europe Natural Food and Beverage Preservatives Revenue (USD Million) By Country (2021-2032)
Figure 11. Germany Natural Food and Beverage Preservatives Revenue (USD Million) By Country (2021-2032)
Figure 12. France Natural Food and Beverage Preservatives Revenue (USD Million) By Country (2021-2032)
Figure 13. United Kingdom Natural Food and Beverage Preservatives Revenue (USD Million) By Country (2021-2032)
Figure 14. Spain Natural Food and Beverage Preservatives Revenue (USD Million) By Country (2021-2032)
Figure 15. Italy Natural Food and Beverage Preservatives Revenue (USD Million) By Country (2021-2032)
Figure 16. Russia Natural Food and Beverage Preservatives Revenue (USD Million) By Country (2021-2032)
Figure 17. Rest of Europe Natural Food and Beverage Preservatives Revenue (USD Million) By Country (2021-2032)
Figure 11. Asia Pacific Natural Food and Beverage Preservatives Revenue (USD Million) By Country (2021-2032)
Figure 12. China Natural Food and Beverage Preservatives Revenue (USD Million) By Country (2021-2032)
Figure 13. Japan Natural Food and Beverage Preservatives Revenue (USD Million) By Country (2021-2032)
Figure 14. India Natural Food and Beverage Preservatives Revenue (USD Million) By Country (2021-2032)
Figure 15. South Korea Natural Food and Beverage Preservatives Revenue (USD Million) By Country (2021-2032)
Figure 16. Australia Natural Food and Beverage Preservatives Revenue (USD Million) By Country (2021-2032)
Figure 17. South East Asia Natural Food and Beverage Preservatives Revenue (USD Million) By Country (2021-2032)
Figure 18. South America Natural Food and Beverage Preservatives Revenue (USD Million) By Country (2021-2032)
Figure 19. Brazil Natural Food and Beverage Preservatives Revenue (USD Million) By Country (2021-2032)
Figure 20. Argentina Natural Food and Beverage Preservatives Revenue (USD Million) By Country (2021-2032)
Figure 21. Rest of Asia Pacific Natural Food and Beverage Preservatives Revenue (USD Million) By Country (2021-2032)
Figure 22. Middle East and Africa Natural Food and Beverage Preservatives Revenue (USD Million) By Region (2021-2032)
Figure 23. Saudi Arabia Natural Food and Beverage Preservatives Revenue (USD Million) By Region (2021-2032)
Figure 24. The UAE Natural Food and Beverage Preservatives Revenue (USD Million) By Region (2021-2032)
Figure 25. Rest of Middle East Natural Food and Beverage Preservatives Revenue (USD Million) By Region (2021-2032)
Figure 26. South Africa Natural Food and Beverage Preservatives Revenue (USD Million) By Region (2021-2032)
Figure 27. Africa Natural Food and Beverage Preservatives Revenue (USD Million) By Region (2021-2032)
Figure 28. North America Natural Food and Beverage Preservatives Revenue (USD Million) By Type (2021-2032)
Figure 29. North America Natural Food and Beverage Preservatives Revenue (USD Million) By Application (2021-2032)
Figure 30. North America Natural Food and Beverage Preservatives Revenue (USD Million) By Product (2021-2032)
Figure 31. Europe Natural Food and Beverage Preservatives Revenue (USD Million) By Type (2021-2032)
Figure 32. Europe Natural Food and Beverage Preservatives Revenue (USD Million) By Application (2021-2032)
Figure 33. Europe Natural Food and Beverage Preservatives Revenue (USD Million) By Product (2021-2032)
Figure 34. Asia Pacific Natural Food and Beverage Preservatives Revenue (USD Million) By Type (2021-2032)
Figure 35. Asia Pacific Natural Food and Beverage Preservatives Revenue (USD Million) By Application (2021-2032)
Figure 36. Asia Pacific Natural Food and Beverage Preservatives Revenue (USD Million) By Product (2021-2032)
Figure 37. South America Natural Food and Beverage Preservatives Revenue (USD Million) By Type (2021-2032)
Figure 38. South America Natural Food and Beverage Preservatives Revenue (USD Million) By Application (2021-2032)
Figure 39. South America Natural Food and Beverage Preservatives Revenue (USD Million) By Product (2021-2032)
Figure 40. Middle East and Africa Natural Food and Beverage Preservatives Revenue (USD Million) By Type (2021-2032)
Figure 41. Middle East and Africa Natural Food and Beverage Preservatives Revenue (USD Million) By Application (2021-2032)
Figure 42. Middle East and Africa Natural Food and Beverage Preservatives Revenue (USD Million) By Product (2021-2032)
By Product
Edible Oil
Rosemary Extracts
Natamycin
Vinegar
Chitosan
Others
By Function
Antimicrobials
Antioxidants
Chelating Agents
Flavoring agents
Restaurants
Emulsifier
Others
By Application
Bakery and Confectionery
Beverages
Meat, Poultry & Seafood
Frozen Food
Dairy products
Snack Food
Fats and Oils
Others
By Form
Solid
Liquid
Countries Analyzed
North America (US, Canada, Mexico)
Europe (Germany, UK, France, Spain, Italy, Russia, Rest of Europe)
Asia Pacific (China, India, Japan, South Korea, Australia, South East Asia, Rest of Asia)
South America (Brazil, Argentina, Rest of South America)
Middle East and Africa (Saudi Arabia, UAE, Rest of Middle East, South Africa, Egypt, Rest of Africa)
