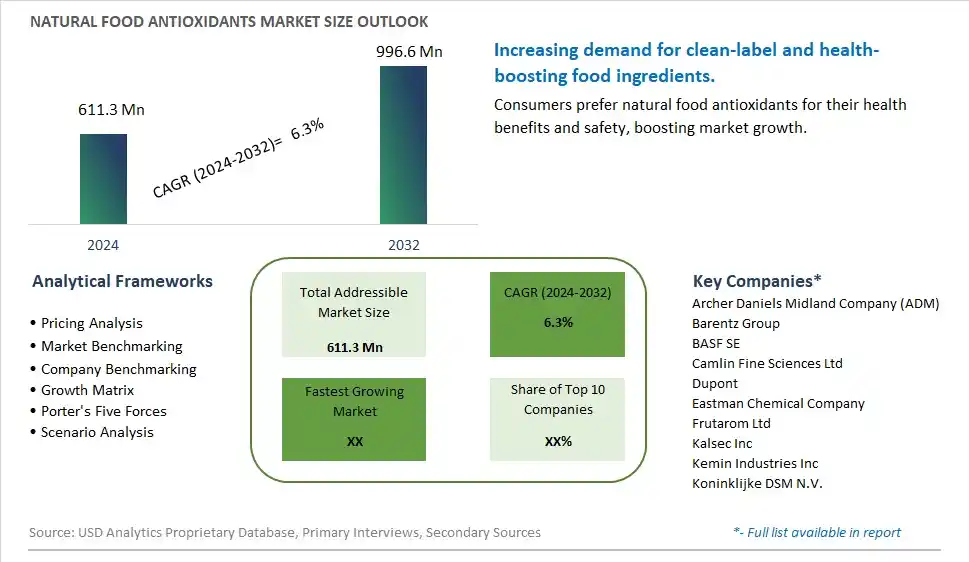
Global Natural Food Antioxidants Market Size is valued at $611.3 Million in 2024 and is forecast to register a growth rate (CAGR) of 6.3% to reach $996.6 Million by 2032.
The global Natural Food Antioxidants Market Comprehensive Study analyzes and forecasts the market size across 6 regions and 24 countries for diverse segments -By Form (Dry, Liquid), By Type (Natural Vitamin E, Pepper Extract, Flavor extracts, Tea Polyphenol, Astaxanthin, Anthocyanin, Others), By Application (Fats & Oils, Prepared Foods, Prepared Meat & Poultry, Beverages, Seafood, Bakery & Confectionery, Plant-Based Alternatives, Nutraceuticals, Others)
An Introduction to Natural Food Antioxidants Market
The natural food antioxidants market in 2024 is expanding rapidly, driven by the demand for natural ingredients that prevent oxidation and spoilage in food products. Natural antioxidants, such as vitamin E, vitamin C, and polyphenols, are used to extend the shelf life and maintain the quality of foods. The market benefits from innovations in extraction and formulation that enhance the potency and application of natural antioxidants. The trend towards clean label and natural ingredients is influencing product development. Increasing consumer interest in health and wellness, supported by the popularity of functional foods, is further propelling market growth.
Natural Food Antioxidants Competitive Landscape
The market report analyses the leading companies in the industry including Archer Daniels Midland Company (ADM), Barentz Group, BASF SE, Camlin Fine Sciences Ltd, Dupont, Eastman Chemical Company, Frutarom Ltd, Kalsec Inc, Kemin Industries Inc, Koninklijke DSM N.V., and Others.
Natural Food Antioxidants Market Dynamics
Natural Food Antioxidants Market Trend: Growing Use of Natural Antioxidants in Functional Foods and Beverages
The most prominent trend in the Natural Food Antioxidants Market is the growing use of natural antioxidants in functional foods and beverages. As consumers seek products that offer health benefits beyond basic nutrition, there is an increasing demand for natural antioxidants that provide protection against oxidative stress and support overall well-being.
Natural Food Antioxidants Market Driver: Health Consciousness and Demand for Functional Ingredients
A key driver in the Natural Food Antioxidants Market is health consciousness and the demand for functional ingredients. As more individuals focus on improving their health and preventing chronic diseases, there is a rising demand for natural antioxidants that offer multiple health benefits, supporting market growth.
Natural Food Antioxidants Market Opportunity: Expansion into Diverse Food Applications
One significant opportunity in the Natural Food Antioxidants Market lies in the expansion into diverse food applications. Companies can innovate by incorporating natural antioxidants into a variety of products, such as snacks, beverages, and dietary supplements, offering consumers convenient and effective ways to enhance their antioxidant intake, driving market growth.
Natural Food Antioxidants Market Share Analysis- Largest Segment by Form
In the Natural Food Antioxidants Market, the Dry form is the largest segment. Dry antioxidants are favored for their long shelf life, stability, and ease of handling and storage compared to liquid forms. They are commonly used in various food products, including snacks, cereals, and baked goods, where they provide extended shelf life and preserve nutritional quality. The preference for dry antioxidants is also driven by their convenience in formulation and their ability to be easily integrated into powder blends and encapsulations, making them a popular choice among manufacturers.
Natural Food Antioxidants Market Share Analysis- Fastest Growing Segment by Type
The Tea Polyphenol segment is poised to grow fastest in the Natural Food Antioxidants Market over the next five years. This growth is attributed to the increasing recognition of tea polyphenols for their potent antioxidant properties and health benefits, including reducing the risk of chronic diseases and improving overall health. The rising trend towards natural and plant-based ingredients in the food and beverage industry, coupled with consumer demand for functional foods, is driving the rapid expansion of tea polyphenols. Additionally, ongoing research into the health benefits of tea polyphenols and their applications in various food products further supports this growth.
Natural Food Antioxidants Market Share Analysis- Largest Segment by Application
In the Natural Food Antioxidants Market, the Beverages segment is the largest. This dominance is due to the high demand for antioxidants in beverages to maintain product quality, extend shelf life, and enhance nutritional value. Beverages, including juices, teas, and health drinks, are significant carriers of antioxidants, as they require effective preservation to prevent oxidation and spoilage. The increasing consumer preference for antioxidant-rich beverages and the rising awareness of health benefits associated with antioxidants drive the largest share of this segment in the market.
Natural Food Antioxidants Market Segmentation
By Form
Dry
Liquid
By Type
Natural Vitamin E
Pepper Extract
Flavor extracts
Tea Polyphenol
Astaxanthin
Anthocyanin
Others
By Application
Fats & Oils
Prepared Foods
Prepared Meat & Poultry
Beverages
Seafood
Bakery & Confectionery
Plant-Based Alternatives
Nutraceuticals
Others
Countries Analyzed
North America (US, Canada, Mexico)
Europe (Germany, UK, France, Spain, Italy, Russia, Rest of Europe)
Asia Pacific (China, India, Japan, South Korea, Australia, South East Asia, Rest of Asia)
South America (Brazil, Argentina, Rest of South America)
Middle East and Africa (Saudi Arabia, UAE, Rest of Middle East, South Africa, Egypt, Rest of Africa)
Natural Food Antioxidants Companies Profiled in the Study
Archer Daniels Midland Company (ADM)
Barentz Group
BASF SE
Camlin Fine Sciences Ltd
Dupont
Eastman Chemical Company
Frutarom Ltd
Kalsec Inc
Kemin Industries Inc
Koninklijke DSM N.V.
*- List Not Exhaustive
Chapter 1. TABLE OF CONTENTS
Chapter 2. Introduction to Natural Food Antioxidants Market
2.1. Market Overview
2.2. Key Statistics and Report Highlights
2.3. Scope of the Comprehensive Study
2.3.1. Market Definition
2.3.2 Countries and Regions Covered
2.3.3 Research Objective
2.3.4 Units, Currency, and Conversions
2.3.5 Industry Value Chain
2.4. Key Market Segments
2.5. Key Companies
2.6. Study Period
Chapter 3. Strategic Analysis Review
3.1. Natural Food Antioxidants Pricing Analysis and Forecast
3.2. Porter’s Five Forces
3.3. Market Ecosystem
3.4. SWOT Analysis
3.5. Regulatory Scenario
3.3. Effects of Inflation, Russia-Ukraine War, moderating economic growth, and other macroeconomic factors
Chapter 4. Competitive Landscape
4.1. Market Share Analysis
4.1.1. Global Natural Food Antioxidants Market Share by Company, 2023
4.1.2. Product Offerings of Leading Natural Food Antioxidants Companies
4.2. Market Entropy
4.2.1. New Product Launches in the Industry
4.2.2. Mergers, Acquisitions, Joint ventures, and Partnerships
4.3. Key Strategies and Best Practices
Chapter 5. Global Market Projections: Best, Reference, and Low Case Scenarios
5.1. Growth Analysis- Case Scenario Definitions
5.2. Low Growth Case Scenario Forecasts
5.3. Reference Growth Case Scenario Forecasts
5.4. High Growth Case Scenario Forecasts
Chapter 6. Market Dynamics
6.1. Natural Food Antioxidants Market Drivers
6.2. Natural Food Antioxidants Market Challenges
6.6. Natural Food Antioxidants Market Opportunities
6.4. Natural Food Antioxidants Market Trends
Chapter 7. Global Natural Food Antioxidants Market Outlook Trends
7.1. Global Natural Food Antioxidants Revenue (USD Million) and CAGR (%) by Type (2021-2032)
7.2. Global Natural Food Antioxidants Revenue (USD Million) and CAGR (%) by Application (2021-2032)
7.3. Global Natural Food Antioxidants Revenue (USD Million) and CAGR (%) by Product (2021-2032)
By Form
Dry
Liquid
By Type
Natural Vitamin E
Pepper Extract
Flavor extracts
Tea Polyphenol
Astaxanthin
Anthocyanin
Others
By Application
Fats & Oils
Prepared Foods
Prepared Meat & Poultry
Beverages
Seafood
Bakery & Confectionery
Plant-Based Alternatives
Nutraceuticals
Others
Chapter 8. Global Natural Food Antioxidants Regional Analysis and Outlook
8.1. Global Natural Food Antioxidants Revenue (USD Million) By Regions (2021- 2032)
8.2. North America Natural Food Antioxidants Revenue (USD Million) by Country (2021-2032)
8.2.1. United States Natural Food Antioxidants Regional Analysis and Outlook
8.2.2. Canada Natural Food Antioxidants Regional Analysis and Outlook
8.2.3. Mexico Natural Food Antioxidants Regional Analysis and Outlook
8.3. Europe Natural Food Antioxidants Revenue (USD Million), by Country (2021-2032)
8.3.1. Germany Natural Food Antioxidants Regional Analysis and Outlook
8.3.2. France Natural Food Antioxidants Regional Analysis and Outlook
8.3.3. United Kingdom Natural Food Antioxidants Regional Analysis and Outlook
8.3.4. Spain Natural Food Antioxidants Regional Analysis and Outlook
8.3.5. Italy Natural Food Antioxidants Regional Analysis and Outlook
8.3.6. Russia Natural Food Antioxidants Regional Analysis and Outlook
8.3.7. Rest of Europe Natural Food Antioxidants Regional Analysis and Outlook
8.4. Asia Pacific Natural Food Antioxidants Revenue (USD Million) by Country (2021-2032)
8.4.1. China Natural Food Antioxidants Regional Analysis and Outlook
8.4.2. Japan Natural Food Antioxidants Regional Analysis and Outlook
8.4.3. India Natural Food Antioxidants Regional Analysis and Outlook
8.4.4. South Korea Natural Food Antioxidants Regional Analysis and Outlook
8.4.5. Australia Natural Food Antioxidants Regional Analysis and Outlook
8.4.6. South East Asia Natural Food Antioxidants Regional Analysis and Outlook
8.4.7. Rest of Asia Pacific Natural Food Antioxidants Regional Analysis and Outlook
8.5. South America Natural Food Antioxidants Revenue (USD Million), by Country (2021-2032)
8.5.1. Brazil Natural Food Antioxidants Regional Analysis and Outlook
8.5.2. Argentina Natural Food Antioxidants Regional Analysis and Outlook
8.5.3. Rest of South America Natural Food Antioxidants Regional Analysis and Outlook
8.6. Middle East and Africa Natural Food Antioxidants Revenue (USD Million) by Country (2021-2032)
8.6.1. Middle East Natural Food Antioxidants Regional Analysis and Outlook
8.6.2. Africa Natural Food Antioxidants Regional Analysis and Outlook
Chapter 9. North America Natural Food Antioxidants Analysis and Outlook
9.1. North America Natural Food Antioxidants Revenue (USD Million) by Segments (2021-2032)
9.1.1. North America Natural Food Antioxidants Revenue (USD Million) by Type (2021-2032)
9.1.2. North America Natural Food Antioxidants Revenue (USD Million) by Application (2021-2032)
9.1.3. North America Natural Food Antioxidants Revenue (USD Million) by Product (2021-2032)
By Form
Dry
Liquid
By Type
Natural Vitamin E
Pepper Extract
Flavor extracts
Tea Polyphenol
Astaxanthin
Anthocyanin
Others
By Application
Fats & Oils
Prepared Foods
Prepared Meat & Poultry
Beverages
Seafood
Bakery & Confectionery
Plant-Based Alternatives
Nutraceuticals
Others
Chapter 10. Europe Natural Food Antioxidants Analysis and Outlook
10.1. Europe Natural Food Antioxidants Revenue (USD Million), by Segments (USD Million) (2021-2032)
10.1.1. Europe Natural Food Antioxidants Revenue (USD Million) by Type (2021-2032)
10.1.2. Europe Natural Food Antioxidants Revenue (USD Million) by Application (2021-2032)
10.1.3. Europe Natural Food Antioxidants Revenue (USD Million) by Product (2021-2032)
By Form
Dry
Liquid
By Type
Natural Vitamin E
Pepper Extract
Flavor extracts
Tea Polyphenol
Astaxanthin
Anthocyanin
Others
By Application
Fats & Oils
Prepared Foods
Prepared Meat & Poultry
Beverages
Seafood
Bakery & Confectionery
Plant-Based Alternatives
Nutraceuticals
Others
Chapter 11. Asia Pacific Natural Food Antioxidants Analysis and Outlook
11.1. Asia Pacific Natural Food Antioxidants Revenue (USD Million), and Revenue (USD Million) by Segments (2021-2032)
11.1.1. Asia Pacific Natural Food Antioxidants Revenue (USD Million) by Type (2021-2032)
11.1.2. Asia Pacific Natural Food Antioxidants Revenue (USD Million) by Application (2021-2032)
11.1.3. Asia Pacific Natural Food Antioxidants Revenue (USD Million) by Product (2021-2032)
By Form
Dry
Liquid
By Type
Natural Vitamin E
Pepper Extract
Flavor extracts
Tea Polyphenol
Astaxanthin
Anthocyanin
Others
By Application
Fats & Oils
Prepared Foods
Prepared Meat & Poultry
Beverages
Seafood
Bakery & Confectionery
Plant-Based Alternatives
Nutraceuticals
Others
Chapter 12. South America Natural Food Antioxidants Analysis and Outlook
12.1. South America Natural Food Antioxidants Revenue (USD Million), by Segments (2021-2032)
12.1.1. South America Natural Food Antioxidants Revenue (USD Million) by Type (2021-2032)
12.1.2. South America Natural Food Antioxidants Revenue (USD Million) by Application (2021-2032)
12.1.3. South America Natural Food Antioxidants Revenue (USD Million) by Product (2021-2032)
By Form
Dry
Liquid
By Type
Natural Vitamin E
Pepper Extract
Flavor extracts
Tea Polyphenol
Astaxanthin
Anthocyanin
Others
By Application
Fats & Oils
Prepared Foods
Prepared Meat & Poultry
Beverages
Seafood
Bakery & Confectionery
Plant-Based Alternatives
Nutraceuticals
Others
Chapter 13. Middle East and Africa Natural Food Antioxidants Analysis and Outlook
13.1. Middle East and Africa Natural Food Antioxidants Revenue (USD Million), by Segments (2021-2032)
13.1.1. Middle East and Africa Natural Food Antioxidants Revenue (USD Million) by Type (2021-2032)
13.1.2. Middle East and Africa Natural Food Antioxidants Revenue (USD Million) by Application (2021-2032)
13.1.3. Middle East and Africa Natural Food Antioxidants Revenue (USD Million) by Product (2021-2032)
By Form
Dry
Liquid
By Type
Natural Vitamin E
Pepper Extract
Flavor extracts
Tea Polyphenol
Astaxanthin
Anthocyanin
Others
By Application
Fats & Oils
Prepared Foods
Prepared Meat & Poultry
Beverages
Seafood
Bakery & Confectionery
Plant-Based Alternatives
Nutraceuticals
Others
Chapter 14. Natural Food Antioxidants Company Profiles
14.1 Business Overview
14.2 Product Profiles
14.3 SWOT Profiles
14.5 Recent Developments
14.6 Financial Profile
List of Companies
Archer Daniels Midland Company (ADM)
Barentz Group
BASF SE
Camlin Fine Sciences Ltd
Dupont
Eastman Chemical Company
Frutarom Ltd
Kalsec Inc
Kemin Industries Inc
Koninklijke DSM N.V.
15. Methodology and Data Sources
15.1 Customization Offerings
15.2 Subscription Services
15.3 Related Reports
15.4 Publisher Expertise
LIST OF TABLES
Table 1 Market Segmentation Analysis
Table 2 Global Natural Food Antioxidants Market Share of Leading Companies, 2023
Table 3 Product Offerings of Leading Companies
Table 4 Low Growth Scenario Forecasts
Table 5 Reference Case Growth Scenario
Table 6 High Growth Case Scenario
Table 7 Global Natural Food Antioxidants Revenue (USD Million) And CAGR (%) By Type (2021-2032)
Table 8 Global Natural Food Antioxidants Revenue (USD Million) And CAGR (%) By Application (2021-2032)
Table 9 Global Natural Food Antioxidants Revenue (USD Million) And CAGR (%) By Product (2021-2032)
Table 10 Global Natural Food Antioxidants Market Revenue (USD Million) By Regions (2021-2032)
Table 11 Global Natural Food Antioxidants Market Share (%) By Regions (2021-2032)
Table 12 North America Natural Food Antioxidants Revenue (USD Million) By Country (2021-2032)
Table 13 Europe Natural Food Antioxidants Revenue (USD Million) By Country (2021-2032)
Table 14 Asia Pacific Natural Food Antioxidants Revenue (USD Million) By Country (2021-2032)
Table 15 South America Natural Food Antioxidants Revenue (USD Million) By Country (2021-2032)
Table 16 Middle East and Africa Natural Food Antioxidants Revenue (USD Million) By Region (2021-2032)
Table 17 North America Natural Food Antioxidants Revenue (USD Million) By Type (2021-2032)
Table 18 North America Natural Food Antioxidants Revenue (USD Million) By Application (2021-2032)
Table 19 North America Natural Food Antioxidants Revenue (USD Million) By Product (2021-2032)
Table 20 Europe Natural Food Antioxidants Revenue (USD Million) By Type (2021-2032)
Table 21 Europe Natural Food Antioxidants Revenue (USD Million) By Application (2021-2032)
Table 22 Europe Natural Food Antioxidants Revenue (USD Million) By Product (2021-2032)
Table 23 Asia Pacific Natural Food Antioxidants Revenue (USD Million) By Type (2021-2032)
Table 24 Asia Pacific Natural Food Antioxidants Revenue (USD Million) By Application (2021-2032)
Table 25 Asia Pacific Natural Food Antioxidants Revenue (USD Million) By Product (2021-2032)
Table 26 South America Natural Food Antioxidants Revenue (USD Million) By Type (2021-2032)
Table 27 South America Natural Food Antioxidants Revenue (USD Million) By Application (2021-2032)
Table 28 South America Natural Food Antioxidants Revenue (USD Million) By Product (2021-2032)
Table 29 Middle East and Africa Natural Food Antioxidants Revenue (USD Million) By Type (2021-2032)
Table 30 Middle East and Africa Natural Food Antioxidants Revenue (USD Million) By Application (2021-2032)
Table 31 Middle East and Africa Natural Food Antioxidants Revenue (USD Million) By Product (2021-2032)
LIST OF FIGURES
Figure 1. Market Scope
Figure 2. Pricing Forecasts Per Unit, 2023- 2032
Figure 3. Porter’s Five Forces
Figure 4. Global Natural Food Antioxidants Market Revenue (USD Million) By Regions (2021-2032)
Figure 5. Global Natural Food Antioxidants Market Share (%) By Regions (2023)
Figure 6. North America Natural Food Antioxidants Revenue (USD Million) By Country (2021-2032)
Figure 7. United States Natural Food Antioxidants Revenue (USD Million) By Country (2021-2032)
Figure 8. Canada Natural Food Antioxidants Revenue (USD Million) By Country (2021-2032)
Figure 9. Mexico Natural Food Antioxidants Revenue (USD Million) By Country (2021-2032)
Figure 10. Europe Natural Food Antioxidants Revenue (USD Million) By Country (2021-2032)
Figure 11. Germany Natural Food Antioxidants Revenue (USD Million) By Country (2021-2032)
Figure 12. France Natural Food Antioxidants Revenue (USD Million) By Country (2021-2032)
Figure 13. United Kingdom Natural Food Antioxidants Revenue (USD Million) By Country (2021-2032)
Figure 14. Spain Natural Food Antioxidants Revenue (USD Million) By Country (2021-2032)
Figure 15. Italy Natural Food Antioxidants Revenue (USD Million) By Country (2021-2032)
Figure 16. Russia Natural Food Antioxidants Revenue (USD Million) By Country (2021-2032)
Figure 17. Rest of Europe Natural Food Antioxidants Revenue (USD Million) By Country (2021-2032)
Figure 11. Asia Pacific Natural Food Antioxidants Revenue (USD Million) By Country (2021-2032)
Figure 12. China Natural Food Antioxidants Revenue (USD Million) By Country (2021-2032)
Figure 13. Japan Natural Food Antioxidants Revenue (USD Million) By Country (2021-2032)
Figure 14. India Natural Food Antioxidants Revenue (USD Million) By Country (2021-2032)
Figure 15. South Korea Natural Food Antioxidants Revenue (USD Million) By Country (2021-2032)
Figure 16. Australia Natural Food Antioxidants Revenue (USD Million) By Country (2021-2032)
Figure 17. South East Asia Natural Food Antioxidants Revenue (USD Million) By Country (2021-2032)
Figure 18. South America Natural Food Antioxidants Revenue (USD Million) By Country (2021-2032)
Figure 19. Brazil Natural Food Antioxidants Revenue (USD Million) By Country (2021-2032)
Figure 20. Argentina Natural Food Antioxidants Revenue (USD Million) By Country (2021-2032)
Figure 21. Rest of Asia Pacific Natural Food Antioxidants Revenue (USD Million) By Country (2021-2032)
Figure 22. Middle East and Africa Natural Food Antioxidants Revenue (USD Million) By Region (2021-2032)
Figure 23. Saudi Arabia Natural Food Antioxidants Revenue (USD Million) By Region (2021-2032)
Figure 24. The UAE Natural Food Antioxidants Revenue (USD Million) By Region (2021-2032)
Figure 25. Rest of Middle East Natural Food Antioxidants Revenue (USD Million) By Region (2021-2032)
Figure 26. South Africa Natural Food Antioxidants Revenue (USD Million) By Region (2021-2032)
Figure 27. Africa Natural Food Antioxidants Revenue (USD Million) By Region (2021-2032)
Figure 28. North America Natural Food Antioxidants Revenue (USD Million) By Type (2021-2032)
Figure 29. North America Natural Food Antioxidants Revenue (USD Million) By Application (2021-2032)
Figure 30. North America Natural Food Antioxidants Revenue (USD Million) By Product (2021-2032)
Figure 31. Europe Natural Food Antioxidants Revenue (USD Million) By Type (2021-2032)
Figure 32. Europe Natural Food Antioxidants Revenue (USD Million) By Application (2021-2032)
Figure 33. Europe Natural Food Antioxidants Revenue (USD Million) By Product (2021-2032)
Figure 34. Asia Pacific Natural Food Antioxidants Revenue (USD Million) By Type (2021-2032)
Figure 35. Asia Pacific Natural Food Antioxidants Revenue (USD Million) By Application (2021-2032)
Figure 36. Asia Pacific Natural Food Antioxidants Revenue (USD Million) By Product (2021-2032)
Figure 37. South America Natural Food Antioxidants Revenue (USD Million) By Type (2021-2032)
Figure 38. South America Natural Food Antioxidants Revenue (USD Million) By Application (2021-2032)
Figure 39. South America Natural Food Antioxidants Revenue (USD Million) By Product (2021-2032)
Figure 40. Middle East and Africa Natural Food Antioxidants Revenue (USD Million) By Type (2021-2032)
Figure 41. Middle East and Africa Natural Food Antioxidants Revenue (USD Million) By Application (2021-2032)
Figure 42. Middle East and Africa Natural Food Antioxidants Revenue (USD Million) By Product (2021-2032)
By Form
Dry
Liquid
By Type
Natural Vitamin E
Pepper Extract
Flavor extracts
Tea Polyphenol
Astaxanthin
Anthocyanin
Others
By Application
Fats & Oils
Prepared Foods
Prepared Meat & Poultry
Beverages
Seafood
Bakery & Confectionery
Plant-Based Alternatives
Nutraceuticals
Others
Countries Analyzed
North America (US, Canada, Mexico)
Europe (Germany, UK, France, Spain, Italy, Russia, Rest of Europe)
Asia Pacific (China, India, Japan, South Korea, Australia, South East Asia, Rest of Asia)
South America (Brazil, Argentina, Rest of South America)
Middle East and Africa (Saudi Arabia, UAE, Rest of Middle East, South Africa, Egypt, Rest of Africa)
