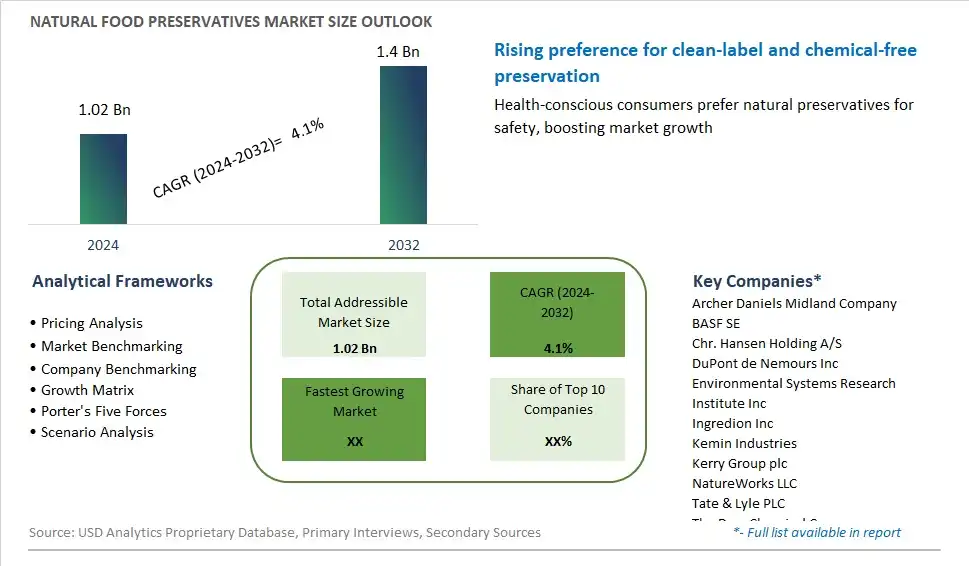
Global Natural Food Preservatives Market Size is valued at $1.02 Billion in 2024 and is forecast to register a growth rate (CAGR) of 4.1% to reach $1.4 Billion by 2032.
The global Natural Food Preservatives Market Comprehensive Study analyzes and forecasts the market size across 6 regions and 24 countries for diverse segments -By Type (Salt, Sugar, Oil, Honey, Citric Acid, Vinegar, Others), By Function (Antimicrobial, Antioxidants, Others), By Application (Sea Food, Meat & Poultry, Bakery, Dairy, Snacks, Beverages, Fruits and Vegetables, Others)
An Introduction to Natural Food Preservatives Market
In 2024, the market for natural food preservatives is witnessing steady growth as consumers seek safer and more sustainable alternatives to synthetic additives. Natural preservatives derived from plant extracts, herbs, spices, and fermentation cultures offer effective microbial control while addressing clean label preferences and health concerns. From rosemary extract and citrus extracts to cultured dextrose and vinegar, natural food preservatives inhibit spoilage and extend shelf life without compromising taste, texture, or nutritional value. Moreover, advancements in extraction technologies and formulation techniques are enhancing the efficacy and versatility of natural preservatives, enabling their application in a wide range of food and beverage products. As regulatory scrutiny intensifies and consumer awareness of food additives increases, the demand for natural food preservatives is expected to escalate, driving innovation and market expansion in the coming years.
Natural Food Preservatives Competitive Landscape
The market report analyses the leading companies in the industry including Archer Daniels Midland Company, BASF SE, Chr. Hansen Holding A/S, DuPont de Nemours Inc, Environmental Systems Research Institute Inc, Ingredion Inc, Kemin Industries, Kerry Group plc, NatureWorks LLC, Tate & Lyle PLC, The Dow Chemical Company, and Others.
Natural Food Preservatives Market Dynamics
Natural Food Preservatives Market Trend: Growing Demand for Clean Label and Shelf-Stable Products
With an increasing focus on health and wellness, consumers are seeking natural food preservatives to replace synthetic additives traditionally used in processed foods. Clean label products, free from artificial preservatives and additives, are gaining popularity as consumers become more conscious of the ingredients in their food. Additionally, there is a rising demand for shelf-stable products that maintain freshness without compromising on taste or nutritional value. This trend is driving food manufacturers to explore natural preservatives derived from plant extracts, essential oils, and other natural sources to meet consumer preferences for healthier and more transparent food options.
Market Driver: Regulatory Restrictions on Synthetic Preservatives
Stringent regulations and consumer awareness regarding the potential health risks associated with synthetic preservatives are driving the adoption of natural alternatives in the food industry. Regulatory bodies are imposing stricter guidelines on the use of synthetic additives, prompting food manufacturers to seek natural alternatives that are safe and effective for preserving food products. This regulatory push is encouraging innovation in the development of natural food preservatives, spurring investment in research and development to identify new sources and methods for preserving food without the use of synthetic chemicals.
Market Opportunity: Expansion into the Clean Label Segment
The natural food preservatives market presents significant opportunities for companies to capitalize on the growing demand for clean label products. As consumers increasingly prioritize transparency and clean ingredients in their food choices, there is a growing market for natural food preservatives that offer effective preservation without compromising on taste or quality. Companies can differentiate themselves by offering clean label solutions that meet consumer expectations for natural, minimally processed foods. By investing in research and development to enhance the efficacy and versatility of natural preservatives, companies can position themselves as leaders in the clean label segment and capture a larger share of the market.
Natural Food Preservatives Market Share Analysis: Salt held the dominant market share in 2024
The "Salt" segment is the largest within the Natural Food Preservatives market, driven by its long-established history as a potent preservative and its wide-ranging applications across diverse food products. Salt, specifically sodium chloride, has been used for centuries to preserve food by inhibiting the growth of microorganisms and preventing spoilage. Its effectiveness, affordability, and versatility make it a preferred choice for food preservation in various forms, including curing meats, pickling vegetables, and brining fish. Further, salt's ability to enhance flavor and texture further contributes to its widespread use in food preservation. Additionally, as consumers increasingly seek natural and clean label products, salt stands out as a natural preservative that aligns with these preferences. With the food industry's ongoing focus on extending shelf life and ensuring food safety, the salt segment is expected to maintain its leading position in the Natural Food Preservatives market.
Natural Food Preservatives Market Share Analysis: Antioxidants market is poised to register the fastest growth rae over the forecast period to 2032
The "Antioxidants" segment is the fastest-growing within the Natural Food Preservatives market, propelled by increasing consumer awareness of the health benefits associated with antioxidant-rich foods and beverages. Antioxidants play a crucial role in preserving the freshness and quality of food products by inhibiting oxidative deterioration, which can lead to flavor degradation, color changes, and nutrient loss. As consumers prioritize natural and minimally processed foods, demand for natural antioxidants derived from plant sources such as herbs, spices, and fruits has surged. Further, the multifunctional properties of antioxidants, including their ability to extend shelf life, enhance food safety, and contribute to overall health and wellness, further drive their adoption in food preservation applications. Additionally, as food manufacturers seek clean label solutions to meet consumer preferences for transparency and authenticity, natural antioxidants emerge as a preferred choice for preserving product integrity while aligning with clean label requirements. With the growing emphasis on natural preservation methods and the expanding market for clean label products, the antioxidants segment is poised to sustain its rapid growth trajectory, reshaping the landscape of the Natural Food Preservatives market.
Natural Food Preservatives Market Share Analysis: Meat & Poultry held the dominant market share in 2024
The "Meat & Poultry" segment is the largest within the Natural Food Preservatives market, driven by the perishable nature of meat and poultry products and the critical need to extend their shelf life while maintaining freshness and safety. Natural preservatives play a crucial role in inhibiting bacterial growth, preventing spoilage, and preserving the quality of meat and poultry products during storage, transportation, and retail. Additionally, as consumers increasingly seek minimally processed and clean label meat products, manufacturers rely on natural preservatives derived from sources like salt, spices, and plant extracts to meet these preferences. Further, the versatility of natural preservatives in enhancing flavor profiles and enhancing product characteristics further contributes to their widespread use in meat and poultry applications. With the continuous growth of the meat and poultry industry and ongoing consumer demand for natural and healthier food options, the meat & poultry segment is expected to maintain its leading position in the Natural Food Preservatives market.
Natural Food Preservatives Market Segmentation
By Type
Salt
Sugar
Oil
Honey
Citric Acid
Vinegar
Others
By Function
Antimicrobial
Antioxidants
Others
By Application
Sea Food
Meat & Poultry
Bakery
Dairy
Snacks
Beverages
Fruits and Vegetables
Others
Countries Analyzed
North America (US, Canada, Mexico)
Europe (Germany, UK, France, Spain, Italy, Russia, Rest of Europe)
Asia Pacific (China, India, Japan, South Korea, Australia, South East Asia, Rest of Asia)
South America (Brazil, Argentina, Rest of South America)
Middle East and Africa (Saudi Arabia, UAE, Rest of Middle East, South Africa, Egypt, Rest of Africa)
Natural Food Preservatives Companies Profiled in the Study
Archer Daniels Midland Company
BASF SE
Chr. Hansen Holding A/S
DuPont de Nemours Inc
Environmental Systems Research Institute Inc
Ingredion Inc
Kemin Industries
Kerry Group plc
NatureWorks LLC
Tate & Lyle PLC
The Dow Chemical Company
*- List Not Exhaustive
Chapter 1. TABLE OF CONTENTS
Chapter 2. Introduction to Natural Food Preservatives Market
2.1. Market Overview
2.2. Key Statistics and Report Highlights
2.3. Scope of the Comprehensive Study
2.3.1. Market Definition
2.3.2 Countries and Regions Covered
2.3.3 Research Objective
2.3.4 Units, Currency, and Conversions
2.3.5 Industry Value Chain
2.4. Key Market Segments
2.5. Key Companies
2.6. Study Period
Chapter 3. Strategic Analysis Review
3.1. Natural Food Preservatives Pricing Analysis and Forecast
3.2. Porter’s Five Forces
3.3. Market Ecosystem
3.4. SWOT Analysis
3.5. Regulatory Scenario
3.3. Effects of Inflation, Russia-Ukraine War, moderating economic growth, and other macroeconomic factors
Chapter 4. Competitive Landscape
4.1. Market Share Analysis
4.1.1. Global Natural Food Preservatives Market Share by Company, 2023
4.1.2. Product Offerings of Leading Natural Food Preservatives Companies
4.2. Market Entropy
4.2.1. New Product Launches in the Industry
4.2.2. Mergers, Acquisitions, Joint ventures, and Partnerships
4.3. Key Strategies and Best Practices
Chapter 5. Global Market Projections: Best, Reference, and Low Case Scenarios
5.1. Growth Analysis- Case Scenario Definitions
5.2. Low Growth Case Scenario Forecasts
5.3. Reference Growth Case Scenario Forecasts
5.4. High Growth Case Scenario Forecasts
Chapter 6. Market Dynamics
6.1. Natural Food Preservatives Market Drivers
6.2. Natural Food Preservatives Market Challenges
6.6. Natural Food Preservatives Market Opportunities
6.4. Natural Food Preservatives Market Trends
Chapter 7. Global Natural Food Preservatives Market Outlook Trends
7.1. Global Natural Food Preservatives Revenue (USD Million) and CAGR (%) by Type (2021-2032)
7.2. Global Natural Food Preservatives Revenue (USD Million) and CAGR (%) by Application (2021-2032)
7.3. Global Natural Food Preservatives Revenue (USD Million) and CAGR (%) by Product (2021-2032)
By Type
Salt
Sugar
Oil
Honey
Citric Acid
Vinegar
Others
By Function
Antimicrobial
Antioxidants
Others
By Application
Sea Food
Meat & Poultry
Bakery
Dairy
Snacks
Beverages
Fruits and Vegetables
Others
Chapter 8. Global Natural Food Preservatives Regional Analysis and Outlook
8.1. Global Natural Food Preservatives Revenue (USD Million) By Regions (2021- 2032)
8.2. North America Natural Food Preservatives Revenue (USD Million) by Country (2021-2032)
8.2.1. United States Natural Food Preservatives Regional Analysis and Outlook
8.2.2. Canada Natural Food Preservatives Regional Analysis and Outlook
8.2.3. Mexico Natural Food Preservatives Regional Analysis and Outlook
8.3. Europe Natural Food Preservatives Revenue (USD Million), by Country (2021-2032)
8.3.1. Germany Natural Food Preservatives Regional Analysis and Outlook
8.3.2. France Natural Food Preservatives Regional Analysis and Outlook
8.3.3. United Kingdom Natural Food Preservatives Regional Analysis and Outlook
8.3.4. Spain Natural Food Preservatives Regional Analysis and Outlook
8.3.5. Italy Natural Food Preservatives Regional Analysis and Outlook
8.3.6. Russia Natural Food Preservatives Regional Analysis and Outlook
8.3.7. Rest of Europe Natural Food Preservatives Regional Analysis and Outlook
8.4. Asia Pacific Natural Food Preservatives Revenue (USD Million) by Country (2021-2032)
8.4.1. China Natural Food Preservatives Regional Analysis and Outlook
8.4.2. Japan Natural Food Preservatives Regional Analysis and Outlook
8.4.3. India Natural Food Preservatives Regional Analysis and Outlook
8.4.4. South Korea Natural Food Preservatives Regional Analysis and Outlook
8.4.5. Australia Natural Food Preservatives Regional Analysis and Outlook
8.4.6. South East Asia Natural Food Preservatives Regional Analysis and Outlook
8.4.7. Rest of Asia Pacific Natural Food Preservatives Regional Analysis and Outlook
8.5. South America Natural Food Preservatives Revenue (USD Million), by Country (2021-2032)
8.5.1. Brazil Natural Food Preservatives Regional Analysis and Outlook
8.5.2. Argentina Natural Food Preservatives Regional Analysis and Outlook
8.5.3. Rest of South America Natural Food Preservatives Regional Analysis and Outlook
8.6. Middle East and Africa Natural Food Preservatives Revenue (USD Million) by Country (2021-2032)
8.6.1. Middle East Natural Food Preservatives Regional Analysis and Outlook
8.6.2. Africa Natural Food Preservatives Regional Analysis and Outlook
Chapter 9. North America Natural Food Preservatives Analysis and Outlook
9.1. North America Natural Food Preservatives Revenue (USD Million) by Segments (2021-2032)
9.1.1. North America Natural Food Preservatives Revenue (USD Million) by Type (2021-2032)
9.1.2. North America Natural Food Preservatives Revenue (USD Million) by Application (2021-2032)
9.1.3. North America Natural Food Preservatives Revenue (USD Million) by Product (2021-2032)
By Type
Salt
Sugar
Oil
Honey
Citric Acid
Vinegar
Others
By Function
Antimicrobial
Antioxidants
Others
By Application
Sea Food
Meat & Poultry
Bakery
Dairy
Snacks
Beverages
Fruits and Vegetables
Others
Chapter 10. Europe Natural Food Preservatives Analysis and Outlook
10.1. Europe Natural Food Preservatives Revenue (USD Million), by Segments (USD Million) (2021-2032)
10.1.1. Europe Natural Food Preservatives Revenue (USD Million) by Type (2021-2032)
10.1.2. Europe Natural Food Preservatives Revenue (USD Million) by Application (2021-2032)
10.1.3. Europe Natural Food Preservatives Revenue (USD Million) by Product (2021-2032)
By Type
Salt
Sugar
Oil
Honey
Citric Acid
Vinegar
Others
By Function
Antimicrobial
Antioxidants
Others
By Application
Sea Food
Meat & Poultry
Bakery
Dairy
Snacks
Beverages
Fruits and Vegetables
Others
Chapter 11. Asia Pacific Natural Food Preservatives Analysis and Outlook
11.1. Asia Pacific Natural Food Preservatives Revenue (USD Million), and Revenue (USD Million) by Segments (2021-2032)
11.1.1. Asia Pacific Natural Food Preservatives Revenue (USD Million) by Type (2021-2032)
11.1.2. Asia Pacific Natural Food Preservatives Revenue (USD Million) by Application (2021-2032)
11.1.3. Asia Pacific Natural Food Preservatives Revenue (USD Million) by Product (2021-2032)
By Type
Salt
Sugar
Oil
Honey
Citric Acid
Vinegar
Others
By Function
Antimicrobial
Antioxidants
Others
By Application
Sea Food
Meat & Poultry
Bakery
Dairy
Snacks
Beverages
Fruits and Vegetables
Others
Chapter 12. South America Natural Food Preservatives Analysis and Outlook
12.1. South America Natural Food Preservatives Revenue (USD Million), by Segments (2021-2032)
12.1.1. South America Natural Food Preservatives Revenue (USD Million) by Type (2021-2032)
12.1.2. South America Natural Food Preservatives Revenue (USD Million) by Application (2021-2032)
12.1.3. South America Natural Food Preservatives Revenue (USD Million) by Product (2021-2032)
By Type
Salt
Sugar
Oil
Honey
Citric Acid
Vinegar
Others
By Function
Antimicrobial
Antioxidants
Others
By Application
Sea Food
Meat & Poultry
Bakery
Dairy
Snacks
Beverages
Fruits and Vegetables
Others
Chapter 13. Middle East and Africa Natural Food Preservatives Analysis and Outlook
13.1. Middle East and Africa Natural Food Preservatives Revenue (USD Million), by Segments (2021-2032)
13.1.1. Middle East and Africa Natural Food Preservatives Revenue (USD Million) by Type (2021-2032)
13.1.2. Middle East and Africa Natural Food Preservatives Revenue (USD Million) by Application (2021-2032)
13.1.3. Middle East and Africa Natural Food Preservatives Revenue (USD Million) by Product (2021-2032)
By Type
Salt
Sugar
Oil
Honey
Citric Acid
Vinegar
Others
By Function
Antimicrobial
Antioxidants
Others
By Application
Sea Food
Meat & Poultry
Bakery
Dairy
Snacks
Beverages
Fruits and Vegetables
Others
Chapter 14. Natural Food Preservatives Company Profiles
14.1 Business Overview
14.2 Product Profiles
14.3 SWOT Profiles
14.5 Recent Developments
14.6 Financial Profile
List of Companies
Archer Daniels Midland Company
BASF SE
Chr. Hansen Holding A/S
DuPont de Nemours Inc
Environmental Systems Research Institute Inc
Ingredion Inc
Kemin Industries
Kerry Group plc
NatureWorks LLC
Tate & Lyle PLC
The Dow Chemical Company
15. Methodology and Data Sources
15.1 Customization Offerings
15.2 Subscription Services
15.3 Related Reports
15.4 Publisher Expertise
LIST OF TABLES
Table 1 Market Segmentation Analysis
Table 2 Global Natural Food Preservatives Market Share of Leading Companies, 2023
Table 3 Product Offerings of Leading Companies
Table 4 Low Growth Scenario Forecasts
Table 5 Reference Case Growth Scenario
Table 6 High Growth Case Scenario
Table 7 Global Natural Food Preservatives Revenue (USD Million) And CAGR (%) By Type (2021-2032)
Table 8 Global Natural Food Preservatives Revenue (USD Million) And CAGR (%) By Application (2021-2032)
Table 9 Global Natural Food Preservatives Revenue (USD Million) And CAGR (%) By Product (2021-2032)
Table 10 Global Natural Food Preservatives Market Revenue (USD Million) By Regions (2021-2032)
Table 11 Global Natural Food Preservatives Market Share (%) By Regions (2021-2032)
Table 12 North America Natural Food Preservatives Revenue (USD Million) By Country (2021-2032)
Table 13 Europe Natural Food Preservatives Revenue (USD Million) By Country (2021-2032)
Table 14 Asia Pacific Natural Food Preservatives Revenue (USD Million) By Country (2021-2032)
Table 15 South America Natural Food Preservatives Revenue (USD Million) By Country (2021-2032)
Table 16 Middle East and Africa Natural Food Preservatives Revenue (USD Million) By Region (2021-2032)
Table 17 North America Natural Food Preservatives Revenue (USD Million) By Type (2021-2032)
Table 18 North America Natural Food Preservatives Revenue (USD Million) By Application (2021-2032)
Table 19 North America Natural Food Preservatives Revenue (USD Million) By Product (2021-2032)
Table 20 Europe Natural Food Preservatives Revenue (USD Million) By Type (2021-2032)
Table 21 Europe Natural Food Preservatives Revenue (USD Million) By Application (2021-2032)
Table 22 Europe Natural Food Preservatives Revenue (USD Million) By Product (2021-2032)
Table 23 Asia Pacific Natural Food Preservatives Revenue (USD Million) By Type (2021-2032)
Table 24 Asia Pacific Natural Food Preservatives Revenue (USD Million) By Application (2021-2032)
Table 25 Asia Pacific Natural Food Preservatives Revenue (USD Million) By Product (2021-2032)
Table 26 South America Natural Food Preservatives Revenue (USD Million) By Type (2021-2032)
Table 27 South America Natural Food Preservatives Revenue (USD Million) By Application (2021-2032)
Table 28 South America Natural Food Preservatives Revenue (USD Million) By Product (2021-2032)
Table 29 Middle East and Africa Natural Food Preservatives Revenue (USD Million) By Type (2021-2032)
Table 30 Middle East and Africa Natural Food Preservatives Revenue (USD Million) By Application (2021-2032)
Table 31 Middle East and Africa Natural Food Preservatives Revenue (USD Million) By Product (2021-2032)
LIST OF FIGURES
Figure 1. Market Scope
Figure 2. Pricing Forecasts Per Unit, 2023- 2032
Figure 3. Porter’s Five Forces
Figure 4. Global Natural Food Preservatives Market Revenue (USD Million) By Regions (2021-2032)
Figure 5. Global Natural Food Preservatives Market Share (%) By Regions (2023)
Figure 6. North America Natural Food Preservatives Revenue (USD Million) By Country (2021-2032)
Figure 7. United States Natural Food Preservatives Revenue (USD Million) By Country (2021-2032)
Figure 8. Canada Natural Food Preservatives Revenue (USD Million) By Country (2021-2032)
Figure 9. Mexico Natural Food Preservatives Revenue (USD Million) By Country (2021-2032)
Figure 10. Europe Natural Food Preservatives Revenue (USD Million) By Country (2021-2032)
Figure 11. Germany Natural Food Preservatives Revenue (USD Million) By Country (2021-2032)
Figure 12. France Natural Food Preservatives Revenue (USD Million) By Country (2021-2032)
Figure 13. United Kingdom Natural Food Preservatives Revenue (USD Million) By Country (2021-2032)
Figure 14. Spain Natural Food Preservatives Revenue (USD Million) By Country (2021-2032)
Figure 15. Italy Natural Food Preservatives Revenue (USD Million) By Country (2021-2032)
Figure 16. Russia Natural Food Preservatives Revenue (USD Million) By Country (2021-2032)
Figure 17. Rest of Europe Natural Food Preservatives Revenue (USD Million) By Country (2021-2032)
Figure 11. Asia Pacific Natural Food Preservatives Revenue (USD Million) By Country (2021-2032)
Figure 12. China Natural Food Preservatives Revenue (USD Million) By Country (2021-2032)
Figure 13. Japan Natural Food Preservatives Revenue (USD Million) By Country (2021-2032)
Figure 14. India Natural Food Preservatives Revenue (USD Million) By Country (2021-2032)
Figure 15. South Korea Natural Food Preservatives Revenue (USD Million) By Country (2021-2032)
Figure 16. Australia Natural Food Preservatives Revenue (USD Million) By Country (2021-2032)
Figure 17. South East Asia Natural Food Preservatives Revenue (USD Million) By Country (2021-2032)
Figure 18. South America Natural Food Preservatives Revenue (USD Million) By Country (2021-2032)
Figure 19. Brazil Natural Food Preservatives Revenue (USD Million) By Country (2021-2032)
Figure 20. Argentina Natural Food Preservatives Revenue (USD Million) By Country (2021-2032)
Figure 21. Rest of Asia Pacific Natural Food Preservatives Revenue (USD Million) By Country (2021-2032)
Figure 22. Middle East and Africa Natural Food Preservatives Revenue (USD Million) By Region (2021-2032)
Figure 23. Saudi Arabia Natural Food Preservatives Revenue (USD Million) By Region (2021-2032)
Figure 24. The UAE Natural Food Preservatives Revenue (USD Million) By Region (2021-2032)
Figure 25. Rest of Middle East Natural Food Preservatives Revenue (USD Million) By Region (2021-2032)
Figure 26. South Africa Natural Food Preservatives Revenue (USD Million) By Region (2021-2032)
Figure 27. Africa Natural Food Preservatives Revenue (USD Million) By Region (2021-2032)
Figure 28. North America Natural Food Preservatives Revenue (USD Million) By Type (2021-2032)
Figure 29. North America Natural Food Preservatives Revenue (USD Million) By Application (2021-2032)
Figure 30. North America Natural Food Preservatives Revenue (USD Million) By Product (2021-2032)
Figure 31. Europe Natural Food Preservatives Revenue (USD Million) By Type (2021-2032)
Figure 32. Europe Natural Food Preservatives Revenue (USD Million) By Application (2021-2032)
Figure 33. Europe Natural Food Preservatives Revenue (USD Million) By Product (2021-2032)
Figure 34. Asia Pacific Natural Food Preservatives Revenue (USD Million) By Type (2021-2032)
Figure 35. Asia Pacific Natural Food Preservatives Revenue (USD Million) By Application (2021-2032)
Figure 36. Asia Pacific Natural Food Preservatives Revenue (USD Million) By Product (2021-2032)
Figure 37. South America Natural Food Preservatives Revenue (USD Million) By Type (2021-2032)
Figure 38. South America Natural Food Preservatives Revenue (USD Million) By Application (2021-2032)
Figure 39. South America Natural Food Preservatives Revenue (USD Million) By Product (2021-2032)
Figure 40. Middle East and Africa Natural Food Preservatives Revenue (USD Million) By Type (2021-2032)
Figure 41. Middle East and Africa Natural Food Preservatives Revenue (USD Million) By Application (2021-2032)
Figure 42. Middle East and Africa Natural Food Preservatives Revenue (USD Million) By Product (2021-2032)
By Type
Salt
Sugar
Oil
Honey
Citric Acid
Vinegar
Others
By Function
Antimicrobial
Antioxidants
Others
By Application
Sea Food
Meat & Poultry
Bakery
Dairy
Snacks
Beverages
Fruits and Vegetables
Others
Countries Analyzed
North America (US, Canada, Mexico)
Europe (Germany, UK, France, Spain, Italy, Russia, Rest of Europe)
Asia Pacific (China, India, Japan, South Korea, Australia, South East Asia, Rest of Asia)
South America (Brazil, Argentina, Rest of South America)
Middle East and Africa (Saudi Arabia, UAE, Rest of Middle East, South Africa, Egypt, Rest of Africa)
