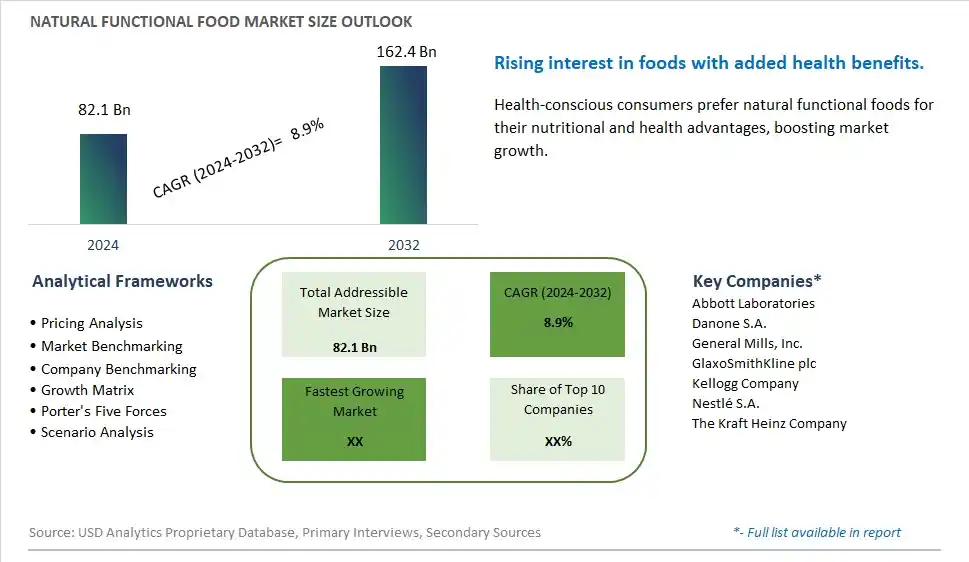
Global Natural Functional Food Market Size is valued at $82.1 Billion in 2024 and is forecast to register a growth rate (CAGR) of 8.9% to reach $162.4 Billion by 2032.
The global Natural Functional Food Market Comprehensive Study analyzes and forecasts the market size across 6 regions and 24 countries for diverse segments -By Type (Dietary Fibers, Minerals, Fatty Acids, Vitamins, Prebiotics & Probiotics), By Application (Bakery & Cereals, Dairy Products, Soy Products, Others)
An Introduction to Natural Functional Food Market
The natural functional food market in 2024 is expanding rapidly, driven by the demand for foods that offer health benefits beyond basic nutrition. Natural functional foods, enriched with ingredients like probiotics, prebiotics, vitamins, and minerals, support various health aspects such as digestion, immunity, and cardiovascular health. The market benefits from innovations in food formulation and ingredient sourcing that enhance efficacy and appeal. The trend towards clean label and natural ingredients is influencing product development. Increasing consumer interest in preventive health and wellness, supported by the popularity of functional foods, is further propelling market growth.
Natural Functional Food Competitive Landscape
The market report analyses the leading companies in the industry including Abbott Laboratories, Danone S.A., General Mills, Inc., GlaxoSmithKline plc, Kellogg Company, Nestlé S.A., The Kraft Heinz Company, and Others.
Natural Functional Food Market Dynamics
Natural Functional Food Market Trend: Increasing Demand for Functional Foods with Natural Ingredients
The most prominent trend in the Natural Functional Food Market is the increasing demand for functional foods with natural ingredients. Consumers are seeking products that provide health benefits such as immune support, digestive health, and energy enhancement, driven by the desire for natural and effective nutritional solutions.
Natural Functional Food Market Driver: Health Consciousness and Preference for Natural Products
A key driver in the Natural Functional Food Market is health consciousness and the preference for natural products. As more individuals focus on improving their diet and overall well-being, there is a rising demand for functional foods made with natural ingredients that offer specific health benefits, supporting market growth.
Natural Functional Food Market Opportunity: Innovation in Product Development
One significant opportunity in the Natural Functional Food Market lies in innovation in product development. Companies can create new functional food products that incorporate natural ingredients, such as superfoods, herbal extracts, and probiotics, offering consumers diverse and health-focused options that cater to their dietary needs and preferences, driving market growth.
Natural Functional Food Market Share Analysis- Largest Segment by Type
In the Natural Functional Food Market, Dietary Fibers is the largest segment. Dietary fibers are essential for digestive health and are widely incorporated into a range of functional foods due to their well-established health benefits, including improving bowel regularity and reducing the risk of chronic diseases. The increasing consumer awareness of gut health and the rising demand for high-fiber diets drive the prominence of dietary fibers in the market. Additionally, the versatility of dietary fibers in various food products, such as cereals, snacks, and baked goods, further solidifies their leading position.
Natural Functional Food Market Share Analysis- Fastest Growing Segment by Application
The Bakery & Cereals segment is poised to grow fastest in the Natural Functional Food Market over the next five years. This growth is fueled by the rising demand for functional bakery products and cereals that offer added health benefits, such as enhanced fiber content, added vitamins, and minerals. As consumers increasingly seek convenient yet health-promoting food options, manufacturers are focusing on incorporating natural functional ingredients into bakery and cereal products. The trend towards healthier eating habits and the innovation in functional bakery formulations contribute to the rapid expansion of this segment.
Natural Functional Food Market Segmentation
By Type
Dietary Fibers
Minerals
Fatty Acids
Vitamins
Prebiotics & Probiotics
By Application
Bakery & Cereals
Dairy Products
Soy Products
Others
Countries Analyzed
North America (US, Canada, Mexico)
Europe (Germany, UK, France, Spain, Italy, Russia, Rest of Europe)
Asia Pacific (China, India, Japan, South Korea, Australia, South East Asia, Rest of Asia)
South America (Brazil, Argentina, Rest of South America)
Middle East and Africa (Saudi Arabia, UAE, Rest of Middle East, South Africa, Egypt, Rest of Africa)
Natural Functional Food Companies Profiled in the Study
Abbott Laboratories
Danone S.A.
General Mills, Inc.
GlaxoSmithKline plc
Kellogg Company
Nestlé S.A.
The Kraft Heinz Company
*- List Not Exhaustive
Chapter 1. TABLE OF CONTENTS
Chapter 2. Introduction to Natural Functional Food Market
2.1. Market Overview
2.2. Key Statistics and Report Highlights
2.3. Scope of the Comprehensive Study
2.3.1. Market Definition
2.3.2 Countries and Regions Covered
2.3.3 Research Objective
2.3.4 Units, Currency, and Conversions
2.3.5 Industry Value Chain
2.4. Key Market Segments
2.5. Key Companies
2.6. Study Period
Chapter 3. Strategic Analysis Review
3.1. Natural Functional Food Pricing Analysis and Forecast
3.2. Porter’s Five Forces
3.3. Market Ecosystem
3.4. SWOT Analysis
3.5. Regulatory Scenario
3.3. Effects of Inflation, Russia-Ukraine War, moderating economic growth, and other macroeconomic factors
Chapter 4. Competitive Landscape
4.1. Market Share Analysis
4.1.1. Global Natural Functional Food Market Share by Company, 2023
4.1.2. Product Offerings of Leading Natural Functional Food Companies
4.2. Market Entropy
4.2.1. New Product Launches in the Industry
4.2.2. Mergers, Acquisitions, Joint ventures, and Partnerships
4.3. Key Strategies and Best Practices
Chapter 5. Global Market Projections: Best, Reference, and Low Case Scenarios
5.1. Growth Analysis- Case Scenario Definitions
5.2. Low Growth Case Scenario Forecasts
5.3. Reference Growth Case Scenario Forecasts
5.4. High Growth Case Scenario Forecasts
Chapter 6. Market Dynamics
6.1. Natural Functional Food Market Drivers
6.2. Natural Functional Food Market Challenges
6.6. Natural Functional Food Market Opportunities
6.4. Natural Functional Food Market Trends
Chapter 7. Global Natural Functional Food Market Outlook Trends
7.1. Global Natural Functional Food Revenue (USD Million) and CAGR (%) by Type (2021-2032)
7.2. Global Natural Functional Food Revenue (USD Million) and CAGR (%) by Application (2021-2032)
7.3. Global Natural Functional Food Revenue (USD Million) and CAGR (%) by Product (2021-2032)
By Type
Dietary Fibers
Minerals
Fatty Acids
Vitamins
Prebiotics & Probiotics
By Application
Bakery & Cereals
Dairy Products
Soy Products
Others
Chapter 8. Global Natural Functional Food Regional Analysis and Outlook
8.1. Global Natural Functional Food Revenue (USD Million) By Regions (2021- 2032)
8.2. North America Natural Functional Food Revenue (USD Million) by Country (2021-2032)
8.2.1. United States Natural Functional Food Regional Analysis and Outlook
8.2.2. Canada Natural Functional Food Regional Analysis and Outlook
8.2.3. Mexico Natural Functional Food Regional Analysis and Outlook
8.3. Europe Natural Functional Food Revenue (USD Million), by Country (2021-2032)
8.3.1. Germany Natural Functional Food Regional Analysis and Outlook
8.3.2. France Natural Functional Food Regional Analysis and Outlook
8.3.3. United Kingdom Natural Functional Food Regional Analysis and Outlook
8.3.4. Spain Natural Functional Food Regional Analysis and Outlook
8.3.5. Italy Natural Functional Food Regional Analysis and Outlook
8.3.6. Russia Natural Functional Food Regional Analysis and Outlook
8.3.7. Rest of Europe Natural Functional Food Regional Analysis and Outlook
8.4. Asia Pacific Natural Functional Food Revenue (USD Million) by Country (2021-2032)
8.4.1. China Natural Functional Food Regional Analysis and Outlook
8.4.2. Japan Natural Functional Food Regional Analysis and Outlook
8.4.3. India Natural Functional Food Regional Analysis and Outlook
8.4.4. South Korea Natural Functional Food Regional Analysis and Outlook
8.4.5. Australia Natural Functional Food Regional Analysis and Outlook
8.4.6. South East Asia Natural Functional Food Regional Analysis and Outlook
8.4.7. Rest of Asia Pacific Natural Functional Food Regional Analysis and Outlook
8.5. South America Natural Functional Food Revenue (USD Million), by Country (2021-2032)
8.5.1. Brazil Natural Functional Food Regional Analysis and Outlook
8.5.2. Argentina Natural Functional Food Regional Analysis and Outlook
8.5.3. Rest of South America Natural Functional Food Regional Analysis and Outlook
8.6. Middle East and Africa Natural Functional Food Revenue (USD Million) by Country (2021-2032)
8.6.1. Middle East Natural Functional Food Regional Analysis and Outlook
8.6.2. Africa Natural Functional Food Regional Analysis and Outlook
Chapter 9. North America Natural Functional Food Analysis and Outlook
9.1. North America Natural Functional Food Revenue (USD Million) by Segments (2021-2032)
9.1.1. North America Natural Functional Food Revenue (USD Million) by Type (2021-2032)
9.1.2. North America Natural Functional Food Revenue (USD Million) by Application (2021-2032)
9.1.3. North America Natural Functional Food Revenue (USD Million) by Product (2021-2032)
By Type
Dietary Fibers
Minerals
Fatty Acids
Vitamins
Prebiotics & Probiotics
By Application
Bakery & Cereals
Dairy Products
Soy Products
Others
Chapter 10. Europe Natural Functional Food Analysis and Outlook
10.1. Europe Natural Functional Food Revenue (USD Million), by Segments (USD Million) (2021-2032)
10.1.1. Europe Natural Functional Food Revenue (USD Million) by Type (2021-2032)
10.1.2. Europe Natural Functional Food Revenue (USD Million) by Application (2021-2032)
10.1.3. Europe Natural Functional Food Revenue (USD Million) by Product (2021-2032)
By Type
Dietary Fibers
Minerals
Fatty Acids
Vitamins
Prebiotics & Probiotics
By Application
Bakery & Cereals
Dairy Products
Soy Products
Others
Chapter 11. Asia Pacific Natural Functional Food Analysis and Outlook
11.1. Asia Pacific Natural Functional Food Revenue (USD Million), and Revenue (USD Million) by Segments (2021-2032)
11.1.1. Asia Pacific Natural Functional Food Revenue (USD Million) by Type (2021-2032)
11.1.2. Asia Pacific Natural Functional Food Revenue (USD Million) by Application (2021-2032)
11.1.3. Asia Pacific Natural Functional Food Revenue (USD Million) by Product (2021-2032)
By Type
Dietary Fibers
Minerals
Fatty Acids
Vitamins
Prebiotics & Probiotics
By Application
Bakery & Cereals
Dairy Products
Soy Products
Others
Chapter 12. South America Natural Functional Food Analysis and Outlook
12.1. South America Natural Functional Food Revenue (USD Million), by Segments (2021-2032)
12.1.1. South America Natural Functional Food Revenue (USD Million) by Type (2021-2032)
12.1.2. South America Natural Functional Food Revenue (USD Million) by Application (2021-2032)
12.1.3. South America Natural Functional Food Revenue (USD Million) by Product (2021-2032)
By Type
Dietary Fibers
Minerals
Fatty Acids
Vitamins
Prebiotics & Probiotics
By Application
Bakery & Cereals
Dairy Products
Soy Products
Others
Chapter 13. Middle East and Africa Natural Functional Food Analysis and Outlook
13.1. Middle East and Africa Natural Functional Food Revenue (USD Million), by Segments (2021-2032)
13.1.1. Middle East and Africa Natural Functional Food Revenue (USD Million) by Type (2021-2032)
13.1.2. Middle East and Africa Natural Functional Food Revenue (USD Million) by Application (2021-2032)
13.1.3. Middle East and Africa Natural Functional Food Revenue (USD Million) by Product (2021-2032)
By Type
Dietary Fibers
Minerals
Fatty Acids
Vitamins
Prebiotics & Probiotics
By Application
Bakery & Cereals
Dairy Products
Soy Products
Others
Chapter 14. Natural Functional Food Company Profiles
14.1 Business Overview
14.2 Product Profiles
14.3 SWOT Profiles
14.5 Recent Developments
14.6 Financial Profile
List of Companies
Abbott Laboratories
Danone S.A.
General Mills, Inc.
GlaxoSmithKline plc
Kellogg Company
Nestlé S.A.
The Kraft Heinz Company
15. Methodology and Data Sources
15.1 Customization Offerings
15.2 Subscription Services
15.3 Related Reports
15.4 Publisher Expertise
LIST OF TABLES
Table 1 Market Segmentation Analysis
Table 2 Global Natural Functional Food Market Share of Leading Companies, 2023
Table 3 Product Offerings of Leading Companies
Table 4 Low Growth Scenario Forecasts
Table 5 Reference Case Growth Scenario
Table 6 High Growth Case Scenario
Table 7 Global Natural Functional Food Revenue (USD Million) And CAGR (%) By Type (2021-2032)
Table 8 Global Natural Functional Food Revenue (USD Million) And CAGR (%) By Application (2021-2032)
Table 9 Global Natural Functional Food Revenue (USD Million) And CAGR (%) By Product (2021-2032)
Table 10 Global Natural Functional Food Market Revenue (USD Million) By Regions (2021-2032)
Table 11 Global Natural Functional Food Market Share (%) By Regions (2021-2032)
Table 12 North America Natural Functional Food Revenue (USD Million) By Country (2021-2032)
Table 13 Europe Natural Functional Food Revenue (USD Million) By Country (2021-2032)
Table 14 Asia Pacific Natural Functional Food Revenue (USD Million) By Country (2021-2032)
Table 15 South America Natural Functional Food Revenue (USD Million) By Country (2021-2032)
Table 16 Middle East and Africa Natural Functional Food Revenue (USD Million) By Region (2021-2032)
Table 17 North America Natural Functional Food Revenue (USD Million) By Type (2021-2032)
Table 18 North America Natural Functional Food Revenue (USD Million) By Application (2021-2032)
Table 19 North America Natural Functional Food Revenue (USD Million) By Product (2021-2032)
Table 20 Europe Natural Functional Food Revenue (USD Million) By Type (2021-2032)
Table 21 Europe Natural Functional Food Revenue (USD Million) By Application (2021-2032)
Table 22 Europe Natural Functional Food Revenue (USD Million) By Product (2021-2032)
Table 23 Asia Pacific Natural Functional Food Revenue (USD Million) By Type (2021-2032)
Table 24 Asia Pacific Natural Functional Food Revenue (USD Million) By Application (2021-2032)
Table 25 Asia Pacific Natural Functional Food Revenue (USD Million) By Product (2021-2032)
Table 26 South America Natural Functional Food Revenue (USD Million) By Type (2021-2032)
Table 27 South America Natural Functional Food Revenue (USD Million) By Application (2021-2032)
Table 28 South America Natural Functional Food Revenue (USD Million) By Product (2021-2032)
Table 29 Middle East and Africa Natural Functional Food Revenue (USD Million) By Type (2021-2032)
Table 30 Middle East and Africa Natural Functional Food Revenue (USD Million) By Application (2021-2032)
Table 31 Middle East and Africa Natural Functional Food Revenue (USD Million) By Product (2021-2032)
LIST OF FIGURES
Figure 1. Market Scope
Figure 2. Pricing Forecasts Per Unit, 2023- 2032
Figure 3. Porter’s Five Forces
Figure 4. Global Natural Functional Food Market Revenue (USD Million) By Regions (2021-2032)
Figure 5. Global Natural Functional Food Market Share (%) By Regions (2023)
Figure 6. North America Natural Functional Food Revenue (USD Million) By Country (2021-2032)
Figure 7. United States Natural Functional Food Revenue (USD Million) By Country (2021-2032)
Figure 8. Canada Natural Functional Food Revenue (USD Million) By Country (2021-2032)
Figure 9. Mexico Natural Functional Food Revenue (USD Million) By Country (2021-2032)
Figure 10. Europe Natural Functional Food Revenue (USD Million) By Country (2021-2032)
Figure 11. Germany Natural Functional Food Revenue (USD Million) By Country (2021-2032)
Figure 12. France Natural Functional Food Revenue (USD Million) By Country (2021-2032)
Figure 13. United Kingdom Natural Functional Food Revenue (USD Million) By Country (2021-2032)
Figure 14. Spain Natural Functional Food Revenue (USD Million) By Country (2021-2032)
Figure 15. Italy Natural Functional Food Revenue (USD Million) By Country (2021-2032)
Figure 16. Russia Natural Functional Food Revenue (USD Million) By Country (2021-2032)
Figure 17. Rest of Europe Natural Functional Food Revenue (USD Million) By Country (2021-2032)
Figure 11. Asia Pacific Natural Functional Food Revenue (USD Million) By Country (2021-2032)
Figure 12. China Natural Functional Food Revenue (USD Million) By Country (2021-2032)
Figure 13. Japan Natural Functional Food Revenue (USD Million) By Country (2021-2032)
Figure 14. India Natural Functional Food Revenue (USD Million) By Country (2021-2032)
Figure 15. South Korea Natural Functional Food Revenue (USD Million) By Country (2021-2032)
Figure 16. Australia Natural Functional Food Revenue (USD Million) By Country (2021-2032)
Figure 17. South East Asia Natural Functional Food Revenue (USD Million) By Country (2021-2032)
Figure 18. South America Natural Functional Food Revenue (USD Million) By Country (2021-2032)
Figure 19. Brazil Natural Functional Food Revenue (USD Million) By Country (2021-2032)
Figure 20. Argentina Natural Functional Food Revenue (USD Million) By Country (2021-2032)
Figure 21. Rest of Asia Pacific Natural Functional Food Revenue (USD Million) By Country (2021-2032)
Figure 22. Middle East and Africa Natural Functional Food Revenue (USD Million) By Region (2021-2032)
Figure 23. Saudi Arabia Natural Functional Food Revenue (USD Million) By Region (2021-2032)
Figure 24. The UAE Natural Functional Food Revenue (USD Million) By Region (2021-2032)
Figure 25. Rest of Middle East Natural Functional Food Revenue (USD Million) By Region (2021-2032)
Figure 26. South Africa Natural Functional Food Revenue (USD Million) By Region (2021-2032)
Figure 27. Africa Natural Functional Food Revenue (USD Million) By Region (2021-2032)
Figure 28. North America Natural Functional Food Revenue (USD Million) By Type (2021-2032)
Figure 29. North America Natural Functional Food Revenue (USD Million) By Application (2021-2032)
Figure 30. North America Natural Functional Food Revenue (USD Million) By Product (2021-2032)
Figure 31. Europe Natural Functional Food Revenue (USD Million) By Type (2021-2032)
Figure 32. Europe Natural Functional Food Revenue (USD Million) By Application (2021-2032)
Figure 33. Europe Natural Functional Food Revenue (USD Million) By Product (2021-2032)
Figure 34. Asia Pacific Natural Functional Food Revenue (USD Million) By Type (2021-2032)
Figure 35. Asia Pacific Natural Functional Food Revenue (USD Million) By Application (2021-2032)
Figure 36. Asia Pacific Natural Functional Food Revenue (USD Million) By Product (2021-2032)
Figure 37. South America Natural Functional Food Revenue (USD Million) By Type (2021-2032)
Figure 38. South America Natural Functional Food Revenue (USD Million) By Application (2021-2032)
Figure 39. South America Natural Functional Food Revenue (USD Million) By Product (2021-2032)
Figure 40. Middle East and Africa Natural Functional Food Revenue (USD Million) By Type (2021-2032)
Figure 41. Middle East and Africa Natural Functional Food Revenue (USD Million) By Application (2021-2032)
Figure 42. Middle East and Africa Natural Functional Food Revenue (USD Million) By Product (2021-2032)
By Type
Dietary Fibers
Minerals
Fatty Acids
Vitamins
Prebiotics & Probiotics
By Application
Bakery & Cereals
Dairy Products
Soy Products
Others
Countries Analyzed
North America (US, Canada, Mexico)
Europe (Germany, UK, France, Spain, Italy, Russia, Rest of Europe)
Asia Pacific (China, India, Japan, South Korea, Australia, South East Asia, Rest of Asia)
South America (Brazil, Argentina, Rest of South America)
Middle East and Africa (Saudi Arabia, UAE, Rest of Middle East, South Africa, Egypt, Rest of Africa)
