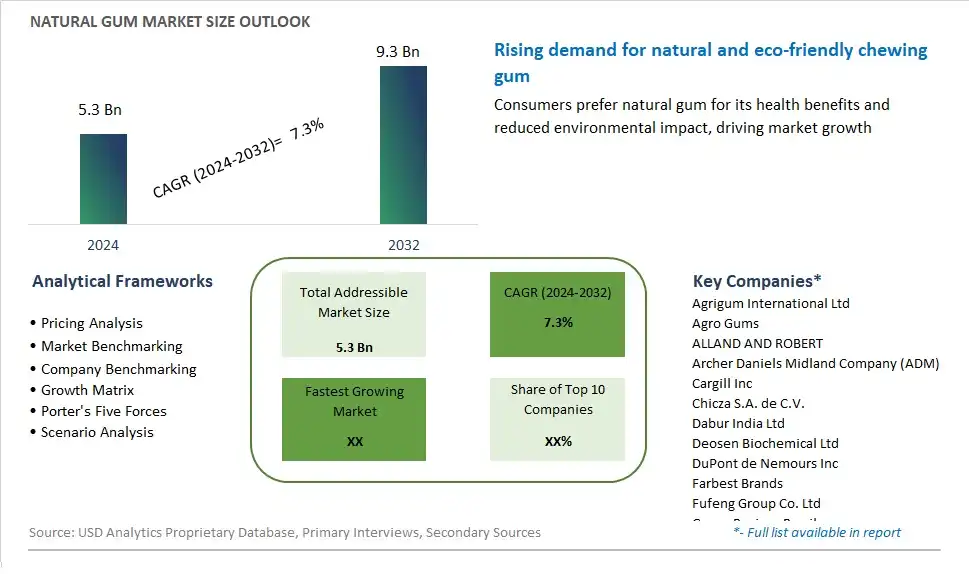
Global Natural Gum Market Size is valued at $5.3 Billion in 2024 and is forecast to register a growth rate (CAGR) of 7.3% to reach $9.3 Billion by 2032.
The global Natural Gum Market Comprehensive Study analyzes and forecasts the market size across 6 regions and 24 countries for diverse segments -By End-User (Food and beverage, Pharmaceutical, Oil and gas, Others), By Type (Food grade, Industry grade)
An Introduction to Natural Gum Market
In 2024, the market for natural gum is experiencing steady growth as consumers seek healthier alternatives to conventional chewing gum that offer clean ingredients, sustainable sourcing, and eco-friendly packaging. Natural gum is made from plant-based ingredients such as chicle, a natural latex harvested from the sapodilla tree, or other tree resins, offering a biodegradable and environmentally friendly alternative to synthetic gum bases derived from petroleum. With increasing concerns about plastic pollution and synthetic additives in food products, consumers are opting for natural gum options that are free from artificial colors, flavors, sweeteners, and preservatives. Moreover, natural gum is valued for its potential oral health benefits, including stimulating saliva production, freshening breath, and reducing plaque buildup, making it a popular choice for oral hygiene and freshening breath on-the-go. As the market for natural gum expands, expect to see further innovation in flavors, textures, and functional ingredients that cater to diverse taste preferences and dietary needs, reflecting a growing demand for sustainable and natural alternatives to conventional chewing gum.
Natural Gum Competitive Landscape
The market report analyses the leading companies in the industry including Agrigum International Ltd, Agro Gums, ALLAND AND ROBERT, Archer Daniels Midland Company (ADM), Cargill Inc, Chicza S.A. de C.V., Dabur India Ltd, Deosen Biochemical Ltd, DuPont de Nemours Inc, Farbest Brands, Fufeng Group Co. Ltd, Grupo Resinas Brasil, Hebei Xinhe Biochemical Co. Ltd, India Glycols Ltd, Ingredion Inc, J M Huber Corp, Jungbunzlauer Suisse AG, Meihua Holdings Group Co. Ltd, Qingdao ECHEMI Digital Technology Co. Ltd , Vasundhara Gums and Chemicals, and Others.
Natural Gum Market Dynamics
Natural Gum Market Trend: Growing Demand for Natural and Plant-Based Ingredients
A significant trend in the natural gum market is the growing demand for natural and plant-based ingredients among consumers. With increasing awareness of health and wellness, there's a shift towards cleaner and more wholesome food options, including natural gums derived from plant sources such as acacia, guar, xanthan, and locust bean gum. Consumers are seeking gums that are free from synthetic additives, artificial colors, and preservatives, opting instead for products that offer natural flavors and textures. This trend is driven by a desire for transparency in food labeling, concerns about the potential health risks associated with artificial ingredients, and a preference for clean label products that align with dietary preferences such as vegetarian, vegan, and gluten-free.
Market Driver: Rise of Clean Label and Functional Foods
A key driver for the natural gum market is the rise of clean label and functional foods, where natural gums play a crucial role as stabilizers, thickeners, and emulsifiers in a wide range of food and beverage applications. As consumers become more discerning about the ingredients in their food and seek products with recognizable and minimalistic ingredient lists, there's a growing demand for natural gums as clean label alternatives to synthetic additives and stabilizers. This driver is reinforced by the increasing popularity of functional foods and beverages formulated with added health benefits such as fiber enrichment, gut health promotion, and texture improvement, where natural gums contribute to product formulation and functionality.
Market Opportunity: Expansion into Health and Wellness Segments
An opportunity for the natural gum market lies in expansion into health and wellness segments to meet the growing demand for functional ingredients and dietary supplements. Natural gums offer various health benefits such as digestive support, satiety enhancement, and cholesterol reduction, making them suitable for incorporation into nutritional supplements, wellness beverages, and functional snacks. Companies can capitalize on this opportunity by developing natural gum-based products targeted towards specific health concerns such as digestive health, weight management, and blood sugar control. Moreover, there's potential to innovate with gum formulations that address emerging health trends such as immunity support, cognitive function enhancement, and stress relief, tapping into the growing market for holistic and preventive health solutions. By leveraging the functional properties of natural gums and positioning them as value-added ingredients in health-promoting products, companies can diversify their product offerings, capture new market segments, and drive growth in the natural gum market.
Natural Gum Market Share Analysis: Food and Beverage held the dominant market share in 2024
Within the natural gum market, the segment catering to Food and Beverage is the largest, driven by the widespread usage of natural gums as stabilizers, thickeners, and emulsifiers in various food and beverage products. Natural gums, derived from plant sources such as acacia, guar, and xanthan, are prized for their functional properties and clean label appeal, aligning with the growing consumer preference for natural and organic ingredients. In the food and beverage industry, natural gums find extensive applications in a wide range of products, including dairy, bakery, confectionery, sauces, dressings, and beverages, where they contribute to texture enhancement, viscosity control, and shelf-life extension. Further, the rising demand for plant-based and vegan food products further accentuates the significance of natural gums as essential ingredients, driving their dominance in the Food and Beverage segment of the natural gum market.
Natural Gum Market Share Analysis: Food Grade market is poised to register the fastest growth rae over the forecast period to 2032
In the natural gum market, the segment dedicated to Food Grade gums is the fastest-growing, fueled by the escalating demand for clean label and natural ingredients in the food industry. Food Grade gums, derived from plant sources such as guar, xanthan, and acacia, are prized for their multifunctional properties, including thickening, gelling, and stabilizing capabilities, making them essential ingredients in a wide array of food products. As consumers increasingly prioritize health and wellness, there is a growing aversion towards synthetic additives and preservatives, driving the preference for natural alternatives. Food Grade gums not only offer clean label solutions but also contribute to texture enhancement and mouthfeel, enhancing the overall sensory experience of food products. Furthermore, the expanding market for natural and organic food products further accelerates the demand for Food Grade gums, propelling its status as the fastest-growing segment in the natural gum market.
Natural Gum Market Segmentation
By End-User
Food and beverage
Pharmaceutical
Oil and gas
Others
By Type
Food grade
Industry grade
Countries Analyzed
North America (US, Canada, Mexico)
Europe (Germany, UK, France, Spain, Italy, Russia, Rest of Europe)
Asia Pacific (China, India, Japan, South Korea, Australia, South East Asia, Rest of Asia)
South America (Brazil, Argentina, Rest of South America)
Middle East and Africa (Saudi Arabia, UAE, Rest of Middle East, South Africa, Egypt, Rest of Africa)
Natural Gum Companies Profiled in the Study
Agrigum International Ltd
Agro Gums
ALLAND AND ROBERT
Archer Daniels Midland Company (ADM)
Cargill Inc
Chicza S.A. de C.V.
Dabur India Ltd
Deosen Biochemical Ltd
DuPont de Nemours Inc
Farbest Brands
Fufeng Group Co. Ltd
Grupo Resinas Brasil
Hebei Xinhe Biochemical Co. Ltd
India Glycols Ltd
Ingredion Inc
J M Huber Corp
Jungbunzlauer Suisse AG
Meihua Holdings Group Co. Ltd
Qingdao ECHEMI Digital Technology Co. Ltd
Vasundhara Gums and Chemicals
*- List Not Exhaustive
Chapter 1. TABLE OF CONTENTS
Chapter 2. Introduction to Natural Gum Market
2.1. Market Overview
2.2. Key Statistics and Report Highlights
2.3. Scope of the Comprehensive Study
2.3.1. Market Definition
2.3.2 Countries and Regions Covered
2.3.3 Research Objective
2.3.4 Units, Currency, and Conversions
2.3.5 Industry Value Chain
2.4. Key Market Segments
2.5. Key Companies
2.6. Study Period
Chapter 3. Strategic Analysis Review
3.1. Natural Gum Pricing Analysis and Forecast
3.2. Porter’s Five Forces
3.3. Market Ecosystem
3.4. SWOT Analysis
3.5. Regulatory Scenario
3.3. Effects of Inflation, Russia-Ukraine War, moderating economic growth, and other macroeconomic factors
Chapter 4. Competitive Landscape
4.1. Market Share Analysis
4.1.1. Global Natural Gum Market Share by Company, 2023
4.1.2. Product Offerings of Leading Natural Gum Companies
4.2. Market Entropy
4.2.1. New Product Launches in the Industry
4.2.2. Mergers, Acquisitions, Joint ventures, and Partnerships
4.3. Key Strategies and Best Practices
Chapter 5. Global Market Projections: Best, Reference, and Low Case Scenarios
5.1. Growth Analysis- Case Scenario Definitions
5.2. Low Growth Case Scenario Forecasts
5.3. Reference Growth Case Scenario Forecasts
5.4. High Growth Case Scenario Forecasts
Chapter 6. Market Dynamics
6.1. Natural Gum Market Drivers
6.2. Natural Gum Market Challenges
6.6. Natural Gum Market Opportunities
6.4. Natural Gum Market Trends
Chapter 7. Global Natural Gum Market Outlook Trends
7.1. Global Natural Gum Revenue (USD Million) and CAGR (%) by Type (2021-2032)
7.2. Global Natural Gum Revenue (USD Million) and CAGR (%) by Application (2021-2032)
7.3. Global Natural Gum Revenue (USD Million) and CAGR (%) by Product (2021-2032)
By End-User
Food and beverage
Pharmaceutical
Oil and gas
Others
By Type
Food grade
Industry grade
Chapter 8. Global Natural Gum Regional Analysis and Outlook
8.1. Global Natural Gum Revenue (USD Million) By Regions (2021- 2032)
8.2. North America Natural Gum Revenue (USD Million) by Country (2021-2032)
8.2.1. United States Natural Gum Regional Analysis and Outlook
8.2.2. Canada Natural Gum Regional Analysis and Outlook
8.2.3. Mexico Natural Gum Regional Analysis and Outlook
8.3. Europe Natural Gum Revenue (USD Million), by Country (2021-2032)
8.3.1. Germany Natural Gum Regional Analysis and Outlook
8.3.2. France Natural Gum Regional Analysis and Outlook
8.3.3. United Kingdom Natural Gum Regional Analysis and Outlook
8.3.4. Spain Natural Gum Regional Analysis and Outlook
8.3.5. Italy Natural Gum Regional Analysis and Outlook
8.3.6. Russia Natural Gum Regional Analysis and Outlook
8.3.7. Rest of Europe Natural Gum Regional Analysis and Outlook
8.4. Asia Pacific Natural Gum Revenue (USD Million) by Country (2021-2032)
8.4.1. China Natural Gum Regional Analysis and Outlook
8.4.2. Japan Natural Gum Regional Analysis and Outlook
8.4.3. India Natural Gum Regional Analysis and Outlook
8.4.4. South Korea Natural Gum Regional Analysis and Outlook
8.4.5. Australia Natural Gum Regional Analysis and Outlook
8.4.6. South East Asia Natural Gum Regional Analysis and Outlook
8.4.7. Rest of Asia Pacific Natural Gum Regional Analysis and Outlook
8.5. South America Natural Gum Revenue (USD Million), by Country (2021-2032)
8.5.1. Brazil Natural Gum Regional Analysis and Outlook
8.5.2. Argentina Natural Gum Regional Analysis and Outlook
8.5.3. Rest of South America Natural Gum Regional Analysis and Outlook
8.6. Middle East and Africa Natural Gum Revenue (USD Million) by Country (2021-2032)
8.6.1. Middle East Natural Gum Regional Analysis and Outlook
8.6.2. Africa Natural Gum Regional Analysis and Outlook
Chapter 9. North America Natural Gum Analysis and Outlook
9.1. North America Natural Gum Revenue (USD Million) by Segments (2021-2032)
9.1.1. North America Natural Gum Revenue (USD Million) by Type (2021-2032)
9.1.2. North America Natural Gum Revenue (USD Million) by Application (2021-2032)
9.1.3. North America Natural Gum Revenue (USD Million) by Product (2021-2032)
By End-User
Food and beverage
Pharmaceutical
Oil and gas
Others
By Type
Food grade
Industry grade
Chapter 10. Europe Natural Gum Analysis and Outlook
10.1. Europe Natural Gum Revenue (USD Million), by Segments (USD Million) (2021-2032)
10.1.1. Europe Natural Gum Revenue (USD Million) by Type (2021-2032)
10.1.2. Europe Natural Gum Revenue (USD Million) by Application (2021-2032)
10.1.3. Europe Natural Gum Revenue (USD Million) by Product (2021-2032)
By End-User
Food and beverage
Pharmaceutical
Oil and gas
Others
By Type
Food grade
Industry grade
Chapter 11. Asia Pacific Natural Gum Analysis and Outlook
11.1. Asia Pacific Natural Gum Revenue (USD Million), and Revenue (USD Million) by Segments (2021-2032)
11.1.1. Asia Pacific Natural Gum Revenue (USD Million) by Type (2021-2032)
11.1.2. Asia Pacific Natural Gum Revenue (USD Million) by Application (2021-2032)
11.1.3. Asia Pacific Natural Gum Revenue (USD Million) by Product (2021-2032)
By End-User
Food and beverage
Pharmaceutical
Oil and gas
Others
By Type
Food grade
Industry grade
Chapter 12. South America Natural Gum Analysis and Outlook
12.1. South America Natural Gum Revenue (USD Million), by Segments (2021-2032)
12.1.1. South America Natural Gum Revenue (USD Million) by Type (2021-2032)
12.1.2. South America Natural Gum Revenue (USD Million) by Application (2021-2032)
12.1.3. South America Natural Gum Revenue (USD Million) by Product (2021-2032)
By End-User
Food and beverage
Pharmaceutical
Oil and gas
Others
By Type
Food grade
Industry grade
Chapter 13. Middle East and Africa Natural Gum Analysis and Outlook
13.1. Middle East and Africa Natural Gum Revenue (USD Million), by Segments (2021-2032)
13.1.1. Middle East and Africa Natural Gum Revenue (USD Million) by Type (2021-2032)
13.1.2. Middle East and Africa Natural Gum Revenue (USD Million) by Application (2021-2032)
13.1.3. Middle East and Africa Natural Gum Revenue (USD Million) by Product (2021-2032)
By End-User
Food and beverage
Pharmaceutical
Oil and gas
Others
By Type
Food grade
Industry grade
Chapter 14. Natural Gum Company Profiles
14.1 Business Overview
14.2 Product Profiles
14.3 SWOT Profiles
14.5 Recent Developments
14.6 Financial Profile
List of Companies
Agrigum International Ltd
Agro Gums
ALLAND AND ROBERT
Archer Daniels Midland Company (ADM)
Cargill Inc
Chicza S.A. de C.V.
Dabur India Ltd
Deosen Biochemical Ltd
DuPont de Nemours Inc
Farbest Brands
Fufeng Group Co. Ltd
Grupo Resinas Brasil
Hebei Xinhe Biochemical Co. Ltd
India Glycols Ltd
Ingredion Inc
J M Huber Corp
Jungbunzlauer Suisse AG
Meihua Holdings Group Co. Ltd
Qingdao ECHEMI Digital Technology Co. Ltd
Vasundhara Gums and Chemicals
15. Methodology and Data Sources
15.1 Customization Offerings
15.2 Subscription Services
15.3 Related Reports
15.4 Publisher Expertise
LIST OF TABLES
Table 1 Market Segmentation Analysis
Table 2 Global Natural Gum Market Share of Leading Companies, 2023
Table 3 Product Offerings of Leading Companies
Table 4 Low Growth Scenario Forecasts
Table 5 Reference Case Growth Scenario
Table 6 High Growth Case Scenario
Table 7 Global Natural Gum Revenue (USD Million) And CAGR (%) By Type (2021-2032)
Table 8 Global Natural Gum Revenue (USD Million) And CAGR (%) By Application (2021-2032)
Table 9 Global Natural Gum Revenue (USD Million) And CAGR (%) By Product (2021-2032)
Table 10 Global Natural Gum Market Revenue (USD Million) By Regions (2021-2032)
Table 11 Global Natural Gum Market Share (%) By Regions (2021-2032)
Table 12 North America Natural Gum Revenue (USD Million) By Country (2021-2032)
Table 13 Europe Natural Gum Revenue (USD Million) By Country (2021-2032)
Table 14 Asia Pacific Natural Gum Revenue (USD Million) By Country (2021-2032)
Table 15 South America Natural Gum Revenue (USD Million) By Country (2021-2032)
Table 16 Middle East and Africa Natural Gum Revenue (USD Million) By Region (2021-2032)
Table 17 North America Natural Gum Revenue (USD Million) By Type (2021-2032)
Table 18 North America Natural Gum Revenue (USD Million) By Application (2021-2032)
Table 19 North America Natural Gum Revenue (USD Million) By Product (2021-2032)
Table 20 Europe Natural Gum Revenue (USD Million) By Type (2021-2032)
Table 21 Europe Natural Gum Revenue (USD Million) By Application (2021-2032)
Table 22 Europe Natural Gum Revenue (USD Million) By Product (2021-2032)
Table 23 Asia Pacific Natural Gum Revenue (USD Million) By Type (2021-2032)
Table 24 Asia Pacific Natural Gum Revenue (USD Million) By Application (2021-2032)
Table 25 Asia Pacific Natural Gum Revenue (USD Million) By Product (2021-2032)
Table 26 South America Natural Gum Revenue (USD Million) By Type (2021-2032)
Table 27 South America Natural Gum Revenue (USD Million) By Application (2021-2032)
Table 28 South America Natural Gum Revenue (USD Million) By Product (2021-2032)
Table 29 Middle East and Africa Natural Gum Revenue (USD Million) By Type (2021-2032)
Table 30 Middle East and Africa Natural Gum Revenue (USD Million) By Application (2021-2032)
Table 31 Middle East and Africa Natural Gum Revenue (USD Million) By Product (2021-2032)
LIST OF FIGURES
Figure 1. Market Scope
Figure 2. Pricing Forecasts Per Unit, 2023- 2032
Figure 3. Porter’s Five Forces
Figure 4. Global Natural Gum Market Revenue (USD Million) By Regions (2021-2032)
Figure 5. Global Natural Gum Market Share (%) By Regions (2023)
Figure 6. North America Natural Gum Revenue (USD Million) By Country (2021-2032)
Figure 7. United States Natural Gum Revenue (USD Million) By Country (2021-2032)
Figure 8. Canada Natural Gum Revenue (USD Million) By Country (2021-2032)
Figure 9. Mexico Natural Gum Revenue (USD Million) By Country (2021-2032)
Figure 10. Europe Natural Gum Revenue (USD Million) By Country (2021-2032)
Figure 11. Germany Natural Gum Revenue (USD Million) By Country (2021-2032)
Figure 12. France Natural Gum Revenue (USD Million) By Country (2021-2032)
Figure 13. United Kingdom Natural Gum Revenue (USD Million) By Country (2021-2032)
Figure 14. Spain Natural Gum Revenue (USD Million) By Country (2021-2032)
Figure 15. Italy Natural Gum Revenue (USD Million) By Country (2021-2032)
Figure 16. Russia Natural Gum Revenue (USD Million) By Country (2021-2032)
Figure 17. Rest of Europe Natural Gum Revenue (USD Million) By Country (2021-2032)
Figure 11. Asia Pacific Natural Gum Revenue (USD Million) By Country (2021-2032)
Figure 12. China Natural Gum Revenue (USD Million) By Country (2021-2032)
Figure 13. Japan Natural Gum Revenue (USD Million) By Country (2021-2032)
Figure 14. India Natural Gum Revenue (USD Million) By Country (2021-2032)
Figure 15. South Korea Natural Gum Revenue (USD Million) By Country (2021-2032)
Figure 16. Australia Natural Gum Revenue (USD Million) By Country (2021-2032)
Figure 17. South East Asia Natural Gum Revenue (USD Million) By Country (2021-2032)
Figure 18. South America Natural Gum Revenue (USD Million) By Country (2021-2032)
Figure 19. Brazil Natural Gum Revenue (USD Million) By Country (2021-2032)
Figure 20. Argentina Natural Gum Revenue (USD Million) By Country (2021-2032)
Figure 21. Rest of Asia Pacific Natural Gum Revenue (USD Million) By Country (2021-2032)
Figure 22. Middle East and Africa Natural Gum Revenue (USD Million) By Region (2021-2032)
Figure 23. Saudi Arabia Natural Gum Revenue (USD Million) By Region (2021-2032)
Figure 24. The UAE Natural Gum Revenue (USD Million) By Region (2021-2032)
Figure 25. Rest of Middle East Natural Gum Revenue (USD Million) By Region (2021-2032)
Figure 26. South Africa Natural Gum Revenue (USD Million) By Region (2021-2032)
Figure 27. Africa Natural Gum Revenue (USD Million) By Region (2021-2032)
Figure 28. North America Natural Gum Revenue (USD Million) By Type (2021-2032)
Figure 29. North America Natural Gum Revenue (USD Million) By Application (2021-2032)
Figure 30. North America Natural Gum Revenue (USD Million) By Product (2021-2032)
Figure 31. Europe Natural Gum Revenue (USD Million) By Type (2021-2032)
Figure 32. Europe Natural Gum Revenue (USD Million) By Application (2021-2032)
Figure 33. Europe Natural Gum Revenue (USD Million) By Product (2021-2032)
Figure 34. Asia Pacific Natural Gum Revenue (USD Million) By Type (2021-2032)
Figure 35. Asia Pacific Natural Gum Revenue (USD Million) By Application (2021-2032)
Figure 36. Asia Pacific Natural Gum Revenue (USD Million) By Product (2021-2032)
Figure 37. South America Natural Gum Revenue (USD Million) By Type (2021-2032)
Figure 38. South America Natural Gum Revenue (USD Million) By Application (2021-2032)
Figure 39. South America Natural Gum Revenue (USD Million) By Product (2021-2032)
Figure 40. Middle East and Africa Natural Gum Revenue (USD Million) By Type (2021-2032)
Figure 41. Middle East and Africa Natural Gum Revenue (USD Million) By Application (2021-2032)
Figure 42. Middle East and Africa Natural Gum Revenue (USD Million) By Product (2021-2032)
By End-User
Food and beverage
Pharmaceutical
Oil and gas
Others
By Type
Food grade
Industry grade
Countries Analyzed
North America (US, Canada, Mexico)
Europe (Germany, UK, France, Spain, Italy, Russia, Rest of Europe)
Asia Pacific (China, India, Japan, South Korea, Australia, South East Asia, Rest of Asia)
South America (Brazil, Argentina, Rest of South America)
Middle East and Africa (Saudi Arabia, UAE, Rest of Middle East, South Africa, Egypt, Rest of Africa)
