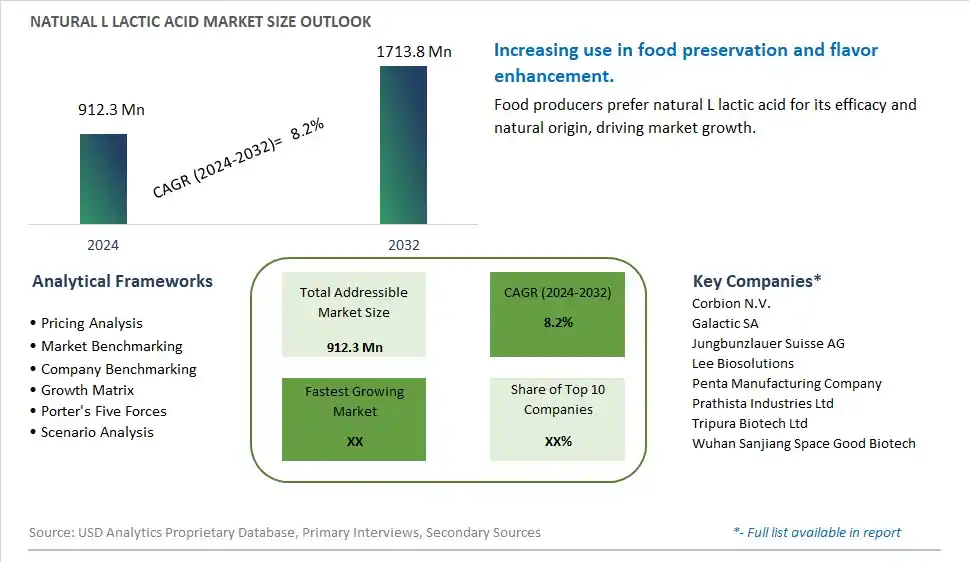
Global Natural L Lactic Acid Market Size is valued at $912.3 Million in 2024 and is forecast to register a growth rate (CAGR) of 8.2% to reach $1713.8 Million by 2032.
The global Natural L Lactic Acid Market Comprehensive Study analyzes and forecasts the market size across 6 regions and 24 countries for diverse segments -By Type (Powdered, Liquid), By Application (Food and Beverage Processing, Cosmetics, Pharmaceuticals, Others)
An Introduction to Natural L Lactic Acid Market
The Natural L-Lactic Acid Market focuses on the production and sale of L-lactic acid, a naturally occurring organic acid used in food, pharmaceuticals, and cosmetics. This acid provides acidity, flavor, and preservative properties. The market is driven by increasing demand for natural and clean label ingredients, rising awareness about the benefits of lactic acid, and growing applications in various industries. Additionally, advancements in lactic acid production technologies and the expansion of product applications support market growth.
Natural L Lactic Acid Competitive Landscape
The market report analyses the leading companies in the industry including Corbion N.V., Galactic SA, Jungbunzlauer Suisse AG, Lee Biosolutions, Penta Manufacturing Company, Prathista Industries Ltd, Tripura Biotech Ltd, Wuhan Sanjiang Space Good Biotech, and Others.
Natural L Lactic Acid Market Dynamics
Natural L Lactic Acid Market Trend: Increasing Use in Food Preservation and Fermentation
The most prominent trend in the Natural L Lactic Acid Market is the increasing use in food preservation and fermentation. Natural L lactic acid, known for its antimicrobial properties, is widely used to extend the shelf life of food products and improve their safety and quality, driven by the demand for natural preservation methods.
Natural L Lactic Acid Market Driver: Growth of the Clean Label Food Movement
A key driver in the Natural L Lactic Acid Market is the growth of the clean label food movement. As more consumers seek foods made with natural and recognizable ingredients, there is a rising demand for natural L lactic acid that aligns with clean label standards, supporting market expansion.
Natural L Lactic Acid Market Opportunity: Expansion into Health and Wellness Products
One significant opportunity in the Natural L Lactic Acid Market lies in the expansion into health and wellness products. Companies can innovate by incorporating natural L lactic acid into products such as dietary supplements, probiotics, and functional foods, leveraging its health benefits and natural origins to attract health-conscious consumers, driving market growth.
Natural L-Lactic Acid Market Share Analysis- Largest Segment by Type
In the Natural L-Lactic Acid Market, the Liquid form is the largest segment. Liquid L-Lactic Acid is preferred due to its versatility and ease of use in various industrial applications. It is widely utilized in food and beverage processing, cosmetics, and pharmaceuticals due to its effectiveness as a preservative, pH regulator, and stabilizer. The liquid form facilitates easier integration into formulations and manufacturing processes, providing uniformity and consistency. Additionally, its broader applicability across diverse industries, coupled with existing infrastructure and manufacturing practices, further cements its position as the dominant segment.
Natural L-Lactic Acid Market Share Analysis- Fastest Growing Segment by Application
The Food and Beverage Processing application segment is poised to grow fastest in the Natural L-Lactic Acid Market over the next five years. This rapid growth is driven by the increasing demand for natural preservatives and acidulants in food and beverage products. Natural L-Lactic Acid is favored for its role in enhancing product stability, flavor, and shelf life while meeting consumer preferences for clean label and naturally derived ingredients. Additionally, the expansion of the food and beverage industry, along with the rising trend towards healthier and more natural food options, supports the accelerated adoption of natural L-Lactic Acid in this sector.
Natural L Lactic Acid Market Segmentation
By Type
Powdered
Liquid
By Application
Food and Beverage Processing
Cosmetics
Pharmaceuticals
Others
Countries Analyzed
North America (US, Canada, Mexico)
Europe (Germany, UK, France, Spain, Italy, Russia, Rest of Europe)
Asia Pacific (China, India, Japan, South Korea, Australia, South East Asia, Rest of Asia)
South America (Brazil, Argentina, Rest of South America)
Middle East and Africa (Saudi Arabia, UAE, Rest of Middle East, South Africa, Egypt, Rest of Africa)
Natural L Lactic Acid Companies Profiled in the Study
Corbion N.V.
Galactic SA
Jungbunzlauer Suisse AG
Lee Biosolutions
Penta Manufacturing Company
Prathista Industries Ltd
Tripura Biotech Ltd
Wuhan Sanjiang Space Good Biotech
*- List Not Exhaustive
Chapter 1. TABLE OF CONTENTS
Chapter 2. Introduction to Natural L Lactic Acid Market
2.1. Market Overview
2.2. Key Statistics and Report Highlights
2.3. Scope of the Comprehensive Study
2.3.1. Market Definition
2.3.2 Countries and Regions Covered
2.3.3 Research Objective
2.3.4 Units, Currency, and Conversions
2.3.5 Industry Value Chain
2.4. Key Market Segments
2.5. Key Companies
2.6. Study Period
Chapter 3. Strategic Analysis Review
3.1. Natural L Lactic Acid Pricing Analysis and Forecast
3.2. Porter’s Five Forces
3.3. Market Ecosystem
3.4. SWOT Analysis
3.5. Regulatory Scenario
3.3. Effects of Inflation, Russia-Ukraine War, moderating economic growth, and other macroeconomic factors
Chapter 4. Competitive Landscape
4.1. Market Share Analysis
4.1.1. Global Natural L Lactic Acid Market Share by Company, 2023
4.1.2. Product Offerings of Leading Natural L Lactic Acid Companies
4.2. Market Entropy
4.2.1. New Product Launches in the Industry
4.2.2. Mergers, Acquisitions, Joint ventures, and Partnerships
4.3. Key Strategies and Best Practices
Chapter 5. Global Market Projections: Best, Reference, and Low Case Scenarios
5.1. Growth Analysis- Case Scenario Definitions
5.2. Low Growth Case Scenario Forecasts
5.3. Reference Growth Case Scenario Forecasts
5.4. High Growth Case Scenario Forecasts
Chapter 6. Market Dynamics
6.1. Natural L Lactic Acid Market Drivers
6.2. Natural L Lactic Acid Market Challenges
6.6. Natural L Lactic Acid Market Opportunities
6.4. Natural L Lactic Acid Market Trends
Chapter 7. Global Natural L Lactic Acid Market Outlook Trends
7.1. Global Natural L Lactic Acid Revenue (USD Million) and CAGR (%) by Type (2021-2032)
7.2. Global Natural L Lactic Acid Revenue (USD Million) and CAGR (%) by Application (2021-2032)
7.3. Global Natural L Lactic Acid Revenue (USD Million) and CAGR (%) by Product (2021-2032)
By Type
Powdered
Liquid
By Application
Food and Beverage Processing
Cosmetics
Pharmaceuticals
Others
Chapter 8. Global Natural L Lactic Acid Regional Analysis and Outlook
8.1. Global Natural L Lactic Acid Revenue (USD Million) By Regions (2021- 2032)
8.2. North America Natural L Lactic Acid Revenue (USD Million) by Country (2021-2032)
8.2.1. United States Natural L Lactic Acid Regional Analysis and Outlook
8.2.2. Canada Natural L Lactic Acid Regional Analysis and Outlook
8.2.3. Mexico Natural L Lactic Acid Regional Analysis and Outlook
8.3. Europe Natural L Lactic Acid Revenue (USD Million), by Country (2021-2032)
8.3.1. Germany Natural L Lactic Acid Regional Analysis and Outlook
8.3.2. France Natural L Lactic Acid Regional Analysis and Outlook
8.3.3. United Kingdom Natural L Lactic Acid Regional Analysis and Outlook
8.3.4. Spain Natural L Lactic Acid Regional Analysis and Outlook
8.3.5. Italy Natural L Lactic Acid Regional Analysis and Outlook
8.3.6. Russia Natural L Lactic Acid Regional Analysis and Outlook
8.3.7. Rest of Europe Natural L Lactic Acid Regional Analysis and Outlook
8.4. Asia Pacific Natural L Lactic Acid Revenue (USD Million) by Country (2021-2032)
8.4.1. China Natural L Lactic Acid Regional Analysis and Outlook
8.4.2. Japan Natural L Lactic Acid Regional Analysis and Outlook
8.4.3. India Natural L Lactic Acid Regional Analysis and Outlook
8.4.4. South Korea Natural L Lactic Acid Regional Analysis and Outlook
8.4.5. Australia Natural L Lactic Acid Regional Analysis and Outlook
8.4.6. South East Asia Natural L Lactic Acid Regional Analysis and Outlook
8.4.7. Rest of Asia Pacific Natural L Lactic Acid Regional Analysis and Outlook
8.5. South America Natural L Lactic Acid Revenue (USD Million), by Country (2021-2032)
8.5.1. Brazil Natural L Lactic Acid Regional Analysis and Outlook
8.5.2. Argentina Natural L Lactic Acid Regional Analysis and Outlook
8.5.3. Rest of South America Natural L Lactic Acid Regional Analysis and Outlook
8.6. Middle East and Africa Natural L Lactic Acid Revenue (USD Million) by Country (2021-2032)
8.6.1. Middle East Natural L Lactic Acid Regional Analysis and Outlook
8.6.2. Africa Natural L Lactic Acid Regional Analysis and Outlook
Chapter 9. North America Natural L Lactic Acid Analysis and Outlook
9.1. North America Natural L Lactic Acid Revenue (USD Million) by Segments (2021-2032)
9.1.1. North America Natural L Lactic Acid Revenue (USD Million) by Type (2021-2032)
9.1.2. North America Natural L Lactic Acid Revenue (USD Million) by Application (2021-2032)
9.1.3. North America Natural L Lactic Acid Revenue (USD Million) by Product (2021-2032)
By Type
Powdered
Liquid
By Application
Food and Beverage Processing
Cosmetics
Pharmaceuticals
Others
Chapter 10. Europe Natural L Lactic Acid Analysis and Outlook
10.1. Europe Natural L Lactic Acid Revenue (USD Million), by Segments (USD Million) (2021-2032)
10.1.1. Europe Natural L Lactic Acid Revenue (USD Million) by Type (2021-2032)
10.1.2. Europe Natural L Lactic Acid Revenue (USD Million) by Application (2021-2032)
10.1.3. Europe Natural L Lactic Acid Revenue (USD Million) by Product (2021-2032)
By Type
Powdered
Liquid
By Application
Food and Beverage Processing
Cosmetics
Pharmaceuticals
Others
Chapter 11. Asia Pacific Natural L Lactic Acid Analysis and Outlook
11.1. Asia Pacific Natural L Lactic Acid Revenue (USD Million), and Revenue (USD Million) by Segments (2021-2032)
11.1.1. Asia Pacific Natural L Lactic Acid Revenue (USD Million) by Type (2021-2032)
11.1.2. Asia Pacific Natural L Lactic Acid Revenue (USD Million) by Application (2021-2032)
11.1.3. Asia Pacific Natural L Lactic Acid Revenue (USD Million) by Product (2021-2032)
By Type
Powdered
Liquid
By Application
Food and Beverage Processing
Cosmetics
Pharmaceuticals
Others
Chapter 12. South America Natural L Lactic Acid Analysis and Outlook
12.1. South America Natural L Lactic Acid Revenue (USD Million), by Segments (2021-2032)
12.1.1. South America Natural L Lactic Acid Revenue (USD Million) by Type (2021-2032)
12.1.2. South America Natural L Lactic Acid Revenue (USD Million) by Application (2021-2032)
12.1.3. South America Natural L Lactic Acid Revenue (USD Million) by Product (2021-2032)
By Type
Powdered
Liquid
By Application
Food and Beverage Processing
Cosmetics
Pharmaceuticals
Others
Chapter 13. Middle East and Africa Natural L Lactic Acid Analysis and Outlook
13.1. Middle East and Africa Natural L Lactic Acid Revenue (USD Million), by Segments (2021-2032)
13.1.1. Middle East and Africa Natural L Lactic Acid Revenue (USD Million) by Type (2021-2032)
13.1.2. Middle East and Africa Natural L Lactic Acid Revenue (USD Million) by Application (2021-2032)
13.1.3. Middle East and Africa Natural L Lactic Acid Revenue (USD Million) by Product (2021-2032)
By Type
Powdered
Liquid
By Application
Food and Beverage Processing
Cosmetics
Pharmaceuticals
Others
Chapter 14. Natural L Lactic Acid Company Profiles
14.1 Business Overview
14.2 Product Profiles
14.3 SWOT Profiles
14.5 Recent Developments
14.6 Financial Profile
List of Companies
Corbion N.V.
Galactic SA
Jungbunzlauer Suisse AG
Lee Biosolutions
Penta Manufacturing Company
Prathista Industries Ltd
Tripura Biotech Ltd
Wuhan Sanjiang Space Good Biotech
15. Methodology and Data Sources
15.1 Customization Offerings
15.2 Subscription Services
15.3 Related Reports
15.4 Publisher Expertise
LIST OF TABLES
Table 1 Market Segmentation Analysis
Table 2 Global Natural L Lactic Acid Market Share of Leading Companies, 2023
Table 3 Product Offerings of Leading Companies
Table 4 Low Growth Scenario Forecasts
Table 5 Reference Case Growth Scenario
Table 6 High Growth Case Scenario
Table 7 Global Natural L Lactic Acid Revenue (USD Million) And CAGR (%) By Type (2021-2032)
Table 8 Global Natural L Lactic Acid Revenue (USD Million) And CAGR (%) By Application (2021-2032)
Table 9 Global Natural L Lactic Acid Revenue (USD Million) And CAGR (%) By Product (2021-2032)
Table 10 Global Natural L Lactic Acid Market Revenue (USD Million) By Regions (2021-2032)
Table 11 Global Natural L Lactic Acid Market Share (%) By Regions (2021-2032)
Table 12 North America Natural L Lactic Acid Revenue (USD Million) By Country (2021-2032)
Table 13 Europe Natural L Lactic Acid Revenue (USD Million) By Country (2021-2032)
Table 14 Asia Pacific Natural L Lactic Acid Revenue (USD Million) By Country (2021-2032)
Table 15 South America Natural L Lactic Acid Revenue (USD Million) By Country (2021-2032)
Table 16 Middle East and Africa Natural L Lactic Acid Revenue (USD Million) By Region (2021-2032)
Table 17 North America Natural L Lactic Acid Revenue (USD Million) By Type (2021-2032)
Table 18 North America Natural L Lactic Acid Revenue (USD Million) By Application (2021-2032)
Table 19 North America Natural L Lactic Acid Revenue (USD Million) By Product (2021-2032)
Table 20 Europe Natural L Lactic Acid Revenue (USD Million) By Type (2021-2032)
Table 21 Europe Natural L Lactic Acid Revenue (USD Million) By Application (2021-2032)
Table 22 Europe Natural L Lactic Acid Revenue (USD Million) By Product (2021-2032)
Table 23 Asia Pacific Natural L Lactic Acid Revenue (USD Million) By Type (2021-2032)
Table 24 Asia Pacific Natural L Lactic Acid Revenue (USD Million) By Application (2021-2032)
Table 25 Asia Pacific Natural L Lactic Acid Revenue (USD Million) By Product (2021-2032)
Table 26 South America Natural L Lactic Acid Revenue (USD Million) By Type (2021-2032)
Table 27 South America Natural L Lactic Acid Revenue (USD Million) By Application (2021-2032)
Table 28 South America Natural L Lactic Acid Revenue (USD Million) By Product (2021-2032)
Table 29 Middle East and Africa Natural L Lactic Acid Revenue (USD Million) By Type (2021-2032)
Table 30 Middle East and Africa Natural L Lactic Acid Revenue (USD Million) By Application (2021-2032)
Table 31 Middle East and Africa Natural L Lactic Acid Revenue (USD Million) By Product (2021-2032)
LIST OF FIGURES
Figure 1. Market Scope
Figure 2. Pricing Forecasts Per Unit, 2023- 2032
Figure 3. Porter’s Five Forces
Figure 4. Global Natural L Lactic Acid Market Revenue (USD Million) By Regions (2021-2032)
Figure 5. Global Natural L Lactic Acid Market Share (%) By Regions (2023)
Figure 6. North America Natural L Lactic Acid Revenue (USD Million) By Country (2021-2032)
Figure 7. United States Natural L Lactic Acid Revenue (USD Million) By Country (2021-2032)
Figure 8. Canada Natural L Lactic Acid Revenue (USD Million) By Country (2021-2032)
Figure 9. Mexico Natural L Lactic Acid Revenue (USD Million) By Country (2021-2032)
Figure 10. Europe Natural L Lactic Acid Revenue (USD Million) By Country (2021-2032)
Figure 11. Germany Natural L Lactic Acid Revenue (USD Million) By Country (2021-2032)
Figure 12. France Natural L Lactic Acid Revenue (USD Million) By Country (2021-2032)
Figure 13. United Kingdom Natural L Lactic Acid Revenue (USD Million) By Country (2021-2032)
Figure 14. Spain Natural L Lactic Acid Revenue (USD Million) By Country (2021-2032)
Figure 15. Italy Natural L Lactic Acid Revenue (USD Million) By Country (2021-2032)
Figure 16. Russia Natural L Lactic Acid Revenue (USD Million) By Country (2021-2032)
Figure 17. Rest of Europe Natural L Lactic Acid Revenue (USD Million) By Country (2021-2032)
Figure 11. Asia Pacific Natural L Lactic Acid Revenue (USD Million) By Country (2021-2032)
Figure 12. China Natural L Lactic Acid Revenue (USD Million) By Country (2021-2032)
Figure 13. Japan Natural L Lactic Acid Revenue (USD Million) By Country (2021-2032)
Figure 14. India Natural L Lactic Acid Revenue (USD Million) By Country (2021-2032)
Figure 15. South Korea Natural L Lactic Acid Revenue (USD Million) By Country (2021-2032)
Figure 16. Australia Natural L Lactic Acid Revenue (USD Million) By Country (2021-2032)
Figure 17. South East Asia Natural L Lactic Acid Revenue (USD Million) By Country (2021-2032)
Figure 18. South America Natural L Lactic Acid Revenue (USD Million) By Country (2021-2032)
Figure 19. Brazil Natural L Lactic Acid Revenue (USD Million) By Country (2021-2032)
Figure 20. Argentina Natural L Lactic Acid Revenue (USD Million) By Country (2021-2032)
Figure 21. Rest of Asia Pacific Natural L Lactic Acid Revenue (USD Million) By Country (2021-2032)
Figure 22. Middle East and Africa Natural L Lactic Acid Revenue (USD Million) By Region (2021-2032)
Figure 23. Saudi Arabia Natural L Lactic Acid Revenue (USD Million) By Region (2021-2032)
Figure 24. The UAE Natural L Lactic Acid Revenue (USD Million) By Region (2021-2032)
Figure 25. Rest of Middle East Natural L Lactic Acid Revenue (USD Million) By Region (2021-2032)
Figure 26. South Africa Natural L Lactic Acid Revenue (USD Million) By Region (2021-2032)
Figure 27. Africa Natural L Lactic Acid Revenue (USD Million) By Region (2021-2032)
Figure 28. North America Natural L Lactic Acid Revenue (USD Million) By Type (2021-2032)
Figure 29. North America Natural L Lactic Acid Revenue (USD Million) By Application (2021-2032)
Figure 30. North America Natural L Lactic Acid Revenue (USD Million) By Product (2021-2032)
Figure 31. Europe Natural L Lactic Acid Revenue (USD Million) By Type (2021-2032)
Figure 32. Europe Natural L Lactic Acid Revenue (USD Million) By Application (2021-2032)
Figure 33. Europe Natural L Lactic Acid Revenue (USD Million) By Product (2021-2032)
Figure 34. Asia Pacific Natural L Lactic Acid Revenue (USD Million) By Type (2021-2032)
Figure 35. Asia Pacific Natural L Lactic Acid Revenue (USD Million) By Application (2021-2032)
Figure 36. Asia Pacific Natural L Lactic Acid Revenue (USD Million) By Product (2021-2032)
Figure 37. South America Natural L Lactic Acid Revenue (USD Million) By Type (2021-2032)
Figure 38. South America Natural L Lactic Acid Revenue (USD Million) By Application (2021-2032)
Figure 39. South America Natural L Lactic Acid Revenue (USD Million) By Product (2021-2032)
Figure 40. Middle East and Africa Natural L Lactic Acid Revenue (USD Million) By Type (2021-2032)
Figure 41. Middle East and Africa Natural L Lactic Acid Revenue (USD Million) By Application (2021-2032)
Figure 42. Middle East and Africa Natural L Lactic Acid Revenue (USD Million) By Product (2021-2032)
By Type
Powdered
Liquid
By Application
Food and Beverage Processing
Cosmetics
Pharmaceuticals
Others
Countries Analyzed
North America (US, Canada, Mexico)
Europe (Germany, UK, France, Spain, Italy, Russia, Rest of Europe)
Asia Pacific (China, India, Japan, South Korea, Australia, South East Asia, Rest of Asia)
South America (Brazil, Argentina, Rest of South America)
Middle East and Africa (Saudi Arabia, UAE, Rest of Middle East, South Africa, Egypt, Rest of Africa)
