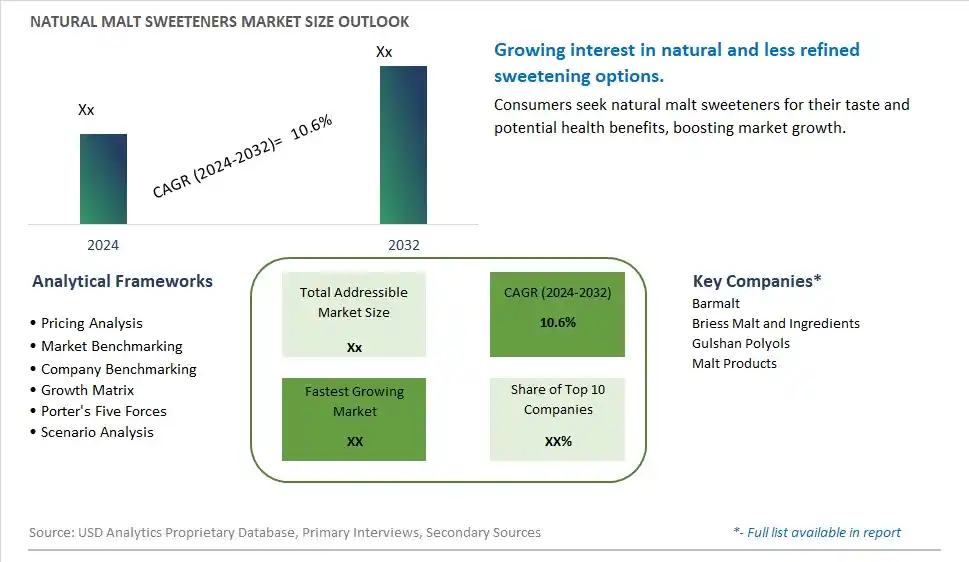
Global Natural Malt Sweeteners Market Size is valued at $XX Million in 2024 and is forecast to register a growth rate (CAGR) of 10.6% to reach $XX Million by 2032.
The global Natural Malt Sweeteners Market Comprehensive Study analyzes and forecasts the market size across 6 regions and 24 countries for diverse segments -By Type (Liquid, Powder), By Application (Food Processing, Beverage Processing, Others)
An Introduction to Natural Malt Sweeteners Market
The natural malt sweeteners market in 2024 is expanding rapidly, driven by the demand for natural, minimally processed sweeteners with rich flavor profiles. Natural malt sweeteners, derived from malted grains like barley and rice, are used in baking, brewing, and confectionery. The market benefits from innovations in malt extraction and processing that enhance product quality and flavor. The trend towards clean label and natural ingredients is influencing product development. Increasing consumer interest in traditional and artisanal foods, supported by the popularity of natural and organic sweeteners, is further propelling market growth.
Natural Malt Sweeteners Competitive Landscape
The market report analyses the leading companies in the industry including Barmalt, Briess Malt and Ingredients, Gulshan Polyols, Malt Products, and Others.
Natural Malt Sweeteners Market Dynamics
Natural Malt Sweeteners Market Trend: Increasing Demand for Natural Sweeteners
The most prominent trend in the Natural Malt Sweeteners Market is the increasing demand for natural sweeteners. As consumers seek healthier alternatives to refined sugars, natural malt sweeteners, derived from grains like barley and corn, are gaining popularity for their natural sweetness and nutritional benefits.
Natural Malt Sweeteners Market Driver: Health Consciousness and Clean Label Preferences
A key driver in the Natural Malt Sweeteners Market is health consciousness and clean label preferences. As more individuals focus on improving their diet and avoiding artificial additives, there is a rising demand for natural malt sweeteners that align with clean label standards and offer better nutrition, supporting market growth.
Natural Malt Sweeteners Market Opportunity: Innovation in Sweetener Blends and Applications
One significant opportunity in the Natural Malt Sweeteners Market lies in innovation in sweetener blends and applications. Companies can develop new products that combine natural malt sweeteners with other natural sweeteners, such as honey and maple syrup, offering unique and health-focused options that cater to diverse taste and dietary preferences, driving market growth.
Natural Malt Sweeteners Market Share Analysis- Largest Segment by Type
In the Natural Malt Sweeteners Market, the Liquid form is the largest segment. Liquid malt sweeteners are preferred due to their ease of use in various food and beverage formulations, where they provide smooth texture and consistent sweetness. Their liquid state allows for quick dissolution and uniform distribution, which is critical in large-scale food processing operations. Additionally, liquid malt sweeteners are versatile and can be easily integrated into beverages, sauces, and baked goods, which drives their dominance in the market.
Natural Malt Sweeteners Market Share Analysis- Fastest Growing Segment by Application
The Beverage Processing application segment is expected to grow fastest in the Natural Malt Sweeteners Market over the next five years. This growth is driven by the increasing consumer demand for natural and healthier sweeteners in beverages. Natural malt sweeteners offer a more nuanced flavor profile compared to artificial sweeteners and are preferred for their natural origin and functional benefits. The booming beverage industry, particularly in categories such as energy drinks, craft sodas, and functional beverages, is propelling the adoption of natural malt sweeteners, contributing to their rapid growth in this application area.
Natural Malt Sweeteners Market Segmentation
By Type
Liquid
Powder
By Application
Food Processing
Beverage Processing
Others
Countries Analyzed
North America (US, Canada, Mexico)
Europe (Germany, UK, France, Spain, Italy, Russia, Rest of Europe)
Asia Pacific (China, India, Japan, South Korea, Australia, South East Asia, Rest of Asia)
South America (Brazil, Argentina, Rest of South America)
Middle East and Africa (Saudi Arabia, UAE, Rest of Middle East, South Africa, Egypt, Rest of Africa)
Natural Malt Sweeteners Companies Profiled in the Study
Barmalt
Briess Malt and Ingredients
Gulshan Polyols
Malt Products
*- List Not Exhaustive
Chapter 1. TABLE OF CONTENTS
Chapter 2. Introduction to Natural Malt Sweeteners Market
2.1. Market Overview
2.2. Key Statistics and Report Highlights
2.3. Scope of the Comprehensive Study
2.3.1. Market Definition
2.3.2 Countries and Regions Covered
2.3.3 Research Objective
2.3.4 Units, Currency, and Conversions
2.3.5 Industry Value Chain
2.4. Key Market Segments
2.5. Key Companies
2.6. Study Period
Chapter 3. Strategic Analysis Review
3.1. Natural Malt Sweeteners Pricing Analysis and Forecast
3.2. Porter’s Five Forces
3.3. Market Ecosystem
3.4. SWOT Analysis
3.5. Regulatory Scenario
3.3. Effects of Inflation, Russia-Ukraine War, moderating economic growth, and other macroeconomic factors
Chapter 4. Competitive Landscape
4.1. Market Share Analysis
4.1.1. Global Natural Malt Sweeteners Market Share by Company, 2023
4.1.2. Product Offerings of Leading Natural Malt Sweeteners Companies
4.2. Market Entropy
4.2.1. New Product Launches in the Industry
4.2.2. Mergers, Acquisitions, Joint ventures, and Partnerships
4.3. Key Strategies and Best Practices
Chapter 5. Global Market Projections: Best, Reference, and Low Case Scenarios
5.1. Growth Analysis- Case Scenario Definitions
5.2. Low Growth Case Scenario Forecasts
5.3. Reference Growth Case Scenario Forecasts
5.4. High Growth Case Scenario Forecasts
Chapter 6. Market Dynamics
6.1. Natural Malt Sweeteners Market Drivers
6.2. Natural Malt Sweeteners Market Challenges
6.6. Natural Malt Sweeteners Market Opportunities
6.4. Natural Malt Sweeteners Market Trends
Chapter 7. Global Natural Malt Sweeteners Market Outlook Trends
7.1. Global Natural Malt Sweeteners Revenue (USD Million) and CAGR (%) by Type (2021-2032)
7.2. Global Natural Malt Sweeteners Revenue (USD Million) and CAGR (%) by Application (2021-2032)
7.3. Global Natural Malt Sweeteners Revenue (USD Million) and CAGR (%) by Product (2021-2032)
By Type
Liquid
Powder
By Application
Food Processing
Beverage Processing
Others
Chapter 8. Global Natural Malt Sweeteners Regional Analysis and Outlook
8.1. Global Natural Malt Sweeteners Revenue (USD Million) By Regions (2021- 2032)
8.2. North America Natural Malt Sweeteners Revenue (USD Million) by Country (2021-2032)
8.2.1. United States Natural Malt Sweeteners Regional Analysis and Outlook
8.2.2. Canada Natural Malt Sweeteners Regional Analysis and Outlook
8.2.3. Mexico Natural Malt Sweeteners Regional Analysis and Outlook
8.3. Europe Natural Malt Sweeteners Revenue (USD Million), by Country (2021-2032)
8.3.1. Germany Natural Malt Sweeteners Regional Analysis and Outlook
8.3.2. France Natural Malt Sweeteners Regional Analysis and Outlook
8.3.3. United Kingdom Natural Malt Sweeteners Regional Analysis and Outlook
8.3.4. Spain Natural Malt Sweeteners Regional Analysis and Outlook
8.3.5. Italy Natural Malt Sweeteners Regional Analysis and Outlook
8.3.6. Russia Natural Malt Sweeteners Regional Analysis and Outlook
8.3.7. Rest of Europe Natural Malt Sweeteners Regional Analysis and Outlook
8.4. Asia Pacific Natural Malt Sweeteners Revenue (USD Million) by Country (2021-2032)
8.4.1. China Natural Malt Sweeteners Regional Analysis and Outlook
8.4.2. Japan Natural Malt Sweeteners Regional Analysis and Outlook
8.4.3. India Natural Malt Sweeteners Regional Analysis and Outlook
8.4.4. South Korea Natural Malt Sweeteners Regional Analysis and Outlook
8.4.5. Australia Natural Malt Sweeteners Regional Analysis and Outlook
8.4.6. South East Asia Natural Malt Sweeteners Regional Analysis and Outlook
8.4.7. Rest of Asia Pacific Natural Malt Sweeteners Regional Analysis and Outlook
8.5. South America Natural Malt Sweeteners Revenue (USD Million), by Country (2021-2032)
8.5.1. Brazil Natural Malt Sweeteners Regional Analysis and Outlook
8.5.2. Argentina Natural Malt Sweeteners Regional Analysis and Outlook
8.5.3. Rest of South America Natural Malt Sweeteners Regional Analysis and Outlook
8.6. Middle East and Africa Natural Malt Sweeteners Revenue (USD Million) by Country (2021-2032)
8.6.1. Middle East Natural Malt Sweeteners Regional Analysis and Outlook
8.6.2. Africa Natural Malt Sweeteners Regional Analysis and Outlook
Chapter 9. North America Natural Malt Sweeteners Analysis and Outlook
9.1. North America Natural Malt Sweeteners Revenue (USD Million) by Segments (2021-2032)
9.1.1. North America Natural Malt Sweeteners Revenue (USD Million) by Type (2021-2032)
9.1.2. North America Natural Malt Sweeteners Revenue (USD Million) by Application (2021-2032)
9.1.3. North America Natural Malt Sweeteners Revenue (USD Million) by Product (2021-2032)
By Type
Liquid
Powder
By Application
Food Processing
Beverage Processing
Others
Chapter 10. Europe Natural Malt Sweeteners Analysis and Outlook
10.1. Europe Natural Malt Sweeteners Revenue (USD Million), by Segments (USD Million) (2021-2032)
10.1.1. Europe Natural Malt Sweeteners Revenue (USD Million) by Type (2021-2032)
10.1.2. Europe Natural Malt Sweeteners Revenue (USD Million) by Application (2021-2032)
10.1.3. Europe Natural Malt Sweeteners Revenue (USD Million) by Product (2021-2032)
By Type
Liquid
Powder
By Application
Food Processing
Beverage Processing
Others
Chapter 11. Asia Pacific Natural Malt Sweeteners Analysis and Outlook
11.1. Asia Pacific Natural Malt Sweeteners Revenue (USD Million), and Revenue (USD Million) by Segments (2021-2032)
11.1.1. Asia Pacific Natural Malt Sweeteners Revenue (USD Million) by Type (2021-2032)
11.1.2. Asia Pacific Natural Malt Sweeteners Revenue (USD Million) by Application (2021-2032)
11.1.3. Asia Pacific Natural Malt Sweeteners Revenue (USD Million) by Product (2021-2032)
By Type
Liquid
Powder
By Application
Food Processing
Beverage Processing
Others
Chapter 12. South America Natural Malt Sweeteners Analysis and Outlook
12.1. South America Natural Malt Sweeteners Revenue (USD Million), by Segments (2021-2032)
12.1.1. South America Natural Malt Sweeteners Revenue (USD Million) by Type (2021-2032)
12.1.2. South America Natural Malt Sweeteners Revenue (USD Million) by Application (2021-2032)
12.1.3. South America Natural Malt Sweeteners Revenue (USD Million) by Product (2021-2032)
By Type
Liquid
Powder
By Application
Food Processing
Beverage Processing
Others
Chapter 13. Middle East and Africa Natural Malt Sweeteners Analysis and Outlook
13.1. Middle East and Africa Natural Malt Sweeteners Revenue (USD Million), by Segments (2021-2032)
13.1.1. Middle East and Africa Natural Malt Sweeteners Revenue (USD Million) by Type (2021-2032)
13.1.2. Middle East and Africa Natural Malt Sweeteners Revenue (USD Million) by Application (2021-2032)
13.1.3. Middle East and Africa Natural Malt Sweeteners Revenue (USD Million) by Product (2021-2032)
By Type
Liquid
Powder
By Application
Food Processing
Beverage Processing
Others
Chapter 14. Natural Malt Sweeteners Company Profiles
14.1 Business Overview
14.2 Product Profiles
14.3 SWOT Profiles
14.5 Recent Developments
14.6 Financial Profile
List of Companies
Barmalt
Briess Malt and Ingredients
Gulshan Polyols
Malt Products
15. Methodology and Data Sources
15.1 Customization Offerings
15.2 Subscription Services
15.3 Related Reports
15.4 Publisher Expertise
LIST OF TABLES
Table 1 Market Segmentation Analysis
Table 2 Global Natural Malt Sweeteners Market Share of Leading Companies, 2023
Table 3 Product Offerings of Leading Companies
Table 4 Low Growth Scenario Forecasts
Table 5 Reference Case Growth Scenario
Table 6 High Growth Case Scenario
Table 7 Global Natural Malt Sweeteners Revenue (USD Million) And CAGR (%) By Type (2021-2032)
Table 8 Global Natural Malt Sweeteners Revenue (USD Million) And CAGR (%) By Application (2021-2032)
Table 9 Global Natural Malt Sweeteners Revenue (USD Million) And CAGR (%) By Product (2021-2032)
Table 10 Global Natural Malt Sweeteners Market Revenue (USD Million) By Regions (2021-2032)
Table 11 Global Natural Malt Sweeteners Market Share (%) By Regions (2021-2032)
Table 12 North America Natural Malt Sweeteners Revenue (USD Million) By Country (2021-2032)
Table 13 Europe Natural Malt Sweeteners Revenue (USD Million) By Country (2021-2032)
Table 14 Asia Pacific Natural Malt Sweeteners Revenue (USD Million) By Country (2021-2032)
Table 15 South America Natural Malt Sweeteners Revenue (USD Million) By Country (2021-2032)
Table 16 Middle East and Africa Natural Malt Sweeteners Revenue (USD Million) By Region (2021-2032)
Table 17 North America Natural Malt Sweeteners Revenue (USD Million) By Type (2021-2032)
Table 18 North America Natural Malt Sweeteners Revenue (USD Million) By Application (2021-2032)
Table 19 North America Natural Malt Sweeteners Revenue (USD Million) By Product (2021-2032)
Table 20 Europe Natural Malt Sweeteners Revenue (USD Million) By Type (2021-2032)
Table 21 Europe Natural Malt Sweeteners Revenue (USD Million) By Application (2021-2032)
Table 22 Europe Natural Malt Sweeteners Revenue (USD Million) By Product (2021-2032)
Table 23 Asia Pacific Natural Malt Sweeteners Revenue (USD Million) By Type (2021-2032)
Table 24 Asia Pacific Natural Malt Sweeteners Revenue (USD Million) By Application (2021-2032)
Table 25 Asia Pacific Natural Malt Sweeteners Revenue (USD Million) By Product (2021-2032)
Table 26 South America Natural Malt Sweeteners Revenue (USD Million) By Type (2021-2032)
Table 27 South America Natural Malt Sweeteners Revenue (USD Million) By Application (2021-2032)
Table 28 South America Natural Malt Sweeteners Revenue (USD Million) By Product (2021-2032)
Table 29 Middle East and Africa Natural Malt Sweeteners Revenue (USD Million) By Type (2021-2032)
Table 30 Middle East and Africa Natural Malt Sweeteners Revenue (USD Million) By Application (2021-2032)
Table 31 Middle East and Africa Natural Malt Sweeteners Revenue (USD Million) By Product (2021-2032)
LIST OF FIGURES
Figure 1. Market Scope
Figure 2. Pricing Forecasts Per Unit, 2023- 2032
Figure 3. Porter’s Five Forces
Figure 4. Global Natural Malt Sweeteners Market Revenue (USD Million) By Regions (2021-2032)
Figure 5. Global Natural Malt Sweeteners Market Share (%) By Regions (2023)
Figure 6. North America Natural Malt Sweeteners Revenue (USD Million) By Country (2021-2032)
Figure 7. United States Natural Malt Sweeteners Revenue (USD Million) By Country (2021-2032)
Figure 8. Canada Natural Malt Sweeteners Revenue (USD Million) By Country (2021-2032)
Figure 9. Mexico Natural Malt Sweeteners Revenue (USD Million) By Country (2021-2032)
Figure 10. Europe Natural Malt Sweeteners Revenue (USD Million) By Country (2021-2032)
Figure 11. Germany Natural Malt Sweeteners Revenue (USD Million) By Country (2021-2032)
Figure 12. France Natural Malt Sweeteners Revenue (USD Million) By Country (2021-2032)
Figure 13. United Kingdom Natural Malt Sweeteners Revenue (USD Million) By Country (2021-2032)
Figure 14. Spain Natural Malt Sweeteners Revenue (USD Million) By Country (2021-2032)
Figure 15. Italy Natural Malt Sweeteners Revenue (USD Million) By Country (2021-2032)
Figure 16. Russia Natural Malt Sweeteners Revenue (USD Million) By Country (2021-2032)
Figure 17. Rest of Europe Natural Malt Sweeteners Revenue (USD Million) By Country (2021-2032)
Figure 11. Asia Pacific Natural Malt Sweeteners Revenue (USD Million) By Country (2021-2032)
Figure 12. China Natural Malt Sweeteners Revenue (USD Million) By Country (2021-2032)
Figure 13. Japan Natural Malt Sweeteners Revenue (USD Million) By Country (2021-2032)
Figure 14. India Natural Malt Sweeteners Revenue (USD Million) By Country (2021-2032)
Figure 15. South Korea Natural Malt Sweeteners Revenue (USD Million) By Country (2021-2032)
Figure 16. Australia Natural Malt Sweeteners Revenue (USD Million) By Country (2021-2032)
Figure 17. South East Asia Natural Malt Sweeteners Revenue (USD Million) By Country (2021-2032)
Figure 18. South America Natural Malt Sweeteners Revenue (USD Million) By Country (2021-2032)
Figure 19. Brazil Natural Malt Sweeteners Revenue (USD Million) By Country (2021-2032)
Figure 20. Argentina Natural Malt Sweeteners Revenue (USD Million) By Country (2021-2032)
Figure 21. Rest of Asia Pacific Natural Malt Sweeteners Revenue (USD Million) By Country (2021-2032)
Figure 22. Middle East and Africa Natural Malt Sweeteners Revenue (USD Million) By Region (2021-2032)
Figure 23. Saudi Arabia Natural Malt Sweeteners Revenue (USD Million) By Region (2021-2032)
Figure 24. The UAE Natural Malt Sweeteners Revenue (USD Million) By Region (2021-2032)
Figure 25. Rest of Middle East Natural Malt Sweeteners Revenue (USD Million) By Region (2021-2032)
Figure 26. South Africa Natural Malt Sweeteners Revenue (USD Million) By Region (2021-2032)
Figure 27. Africa Natural Malt Sweeteners Revenue (USD Million) By Region (2021-2032)
Figure 28. North America Natural Malt Sweeteners Revenue (USD Million) By Type (2021-2032)
Figure 29. North America Natural Malt Sweeteners Revenue (USD Million) By Application (2021-2032)
Figure 30. North America Natural Malt Sweeteners Revenue (USD Million) By Product (2021-2032)
Figure 31. Europe Natural Malt Sweeteners Revenue (USD Million) By Type (2021-2032)
Figure 32. Europe Natural Malt Sweeteners Revenue (USD Million) By Application (2021-2032)
Figure 33. Europe Natural Malt Sweeteners Revenue (USD Million) By Product (2021-2032)
Figure 34. Asia Pacific Natural Malt Sweeteners Revenue (USD Million) By Type (2021-2032)
Figure 35. Asia Pacific Natural Malt Sweeteners Revenue (USD Million) By Application (2021-2032)
Figure 36. Asia Pacific Natural Malt Sweeteners Revenue (USD Million) By Product (2021-2032)
Figure 37. South America Natural Malt Sweeteners Revenue (USD Million) By Type (2021-2032)
Figure 38. South America Natural Malt Sweeteners Revenue (USD Million) By Application (2021-2032)
Figure 39. South America Natural Malt Sweeteners Revenue (USD Million) By Product (2021-2032)
Figure 40. Middle East and Africa Natural Malt Sweeteners Revenue (USD Million) By Type (2021-2032)
Figure 41. Middle East and Africa Natural Malt Sweeteners Revenue (USD Million) By Application (2021-2032)
Figure 42. Middle East and Africa Natural Malt Sweeteners Revenue (USD Million) By Product (2021-2032)
By Type
Liquid
Powder
By Application
Food Processing
Beverage Processing
Others
Countries Analyzed
North America (US, Canada, Mexico)
Europe (Germany, UK, France, Spain, Italy, Russia, Rest of Europe)
Asia Pacific (China, India, Japan, South Korea, Australia, South East Asia, Rest of Asia)
South America (Brazil, Argentina, Rest of South America)
Middle East and Africa (Saudi Arabia, UAE, Rest of Middle East, South Africa, Egypt, Rest of Africa)
