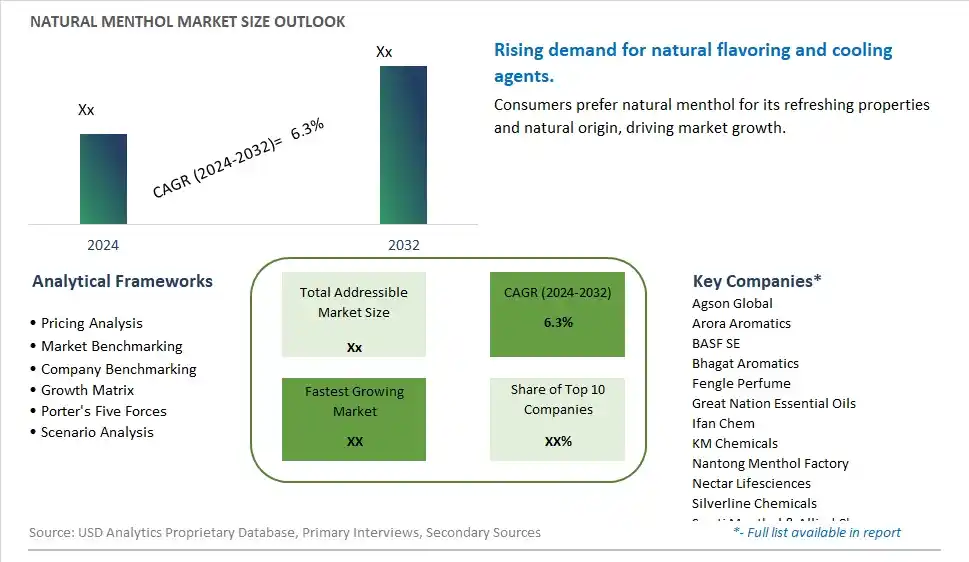
Global Natural Menthol Market Size is valued at $XX Million in 2024 and is forecast to register a growth rate (CAGR) of 6.3% to reach $XX Million by 2032.
The global Natural Menthol Market Comprehensive Study analyzes and forecasts the market size across 6 regions and 24 countries for diverse segments -By Type (Food Grade, Pharmaceutical Grade), By Application (Oral Hygiene, Pharmaceuticals, Tobacco, Confectionaries, Others)
An Introduction to Natural Menthol Market
In 2024, the natural menthol market is thriving, fueled by the demand for natural cooling agents in food, beverages, personal care, and pharmaceuticals. Natural menthol, derived from mint oils, is valued for its refreshing and cooling properties. The market benefits from advancements in extraction and purification technologies that enhance the quality and potency of natural menthol. The trend towards clean label and natural ingredients is influencing product development. Increasing consumer interest in natural and functional ingredients, supported by the popularity of mint-flavored and cooling products, is further supporting market growth.
Natural Menthol Competitive Landscape
The market report analyses the leading companies in the industry including Agson Global, Arora Aromatics, BASF SE, Bhagat Aromatics, Fengle Perfume, Great Nation Essential Oils, Ifan Chem, KM Chemicals, Nantong Menthol Factory, Nectar Lifesciences, Silverline Chemicals, Swati Menthol & Allied Chem, Symrise AG, Takasago, Tienyuan Chem, Yinfeng Pharma, and Others.
Natural Menthol Market Dynamics
Natural Menthol Market Trend: Increasing Use in Health and Wellness Products
The most prominent trend in the Natural Menthol Market is the increasing use in health and wellness products. Natural menthol, known for its cooling and soothing properties, is widely used in products such as oral care items, pharmaceuticals, and personal care products, driven by consumer demand for natural and effective ingredients.
Natural Menthol Market Driver: Growth of the Natural and Organic Products Market
Natural Menthol Market Share Analysis- Largest Segment by Type
The Pharmaceutical Grade segment is the largest in the Natural Menthol Market. This dominance is due to the high purity and specific regulatory requirements associated with pharmaceutical applications. Natural menthol is widely used in medicinal products for its soothing properties and efficacy in treating ailments such as coughs, colds, and respiratory issues. Its extensive use in over-the-counter medications and therapeutic products, coupled with stringent quality standards, makes the pharmaceutical grade menthol segment the leading market segment.
Natural Menthol Market Share Analysis- Fastest Growing Segment by Application
The Oral Hygiene application segment is poised to grow fastest in the Natural Menthol Market over the next five years. The growth is driven by the increasing consumer preference for natural ingredients in oral care products such as toothpaste, mouthwash, and breath fresheners. Natural menthol is valued for its refreshing and soothing properties, which align with the rising demand for natural and effective oral hygiene solutions. The expanding market for premium oral care products and heightened awareness of oral health are contributing to the rapid growth of natural menthol in this application area.
Natural Menthol Market Segmentation
By Type
Food Grade
Pharmaceutical Grade
By Application
Oral Hygiene
Pharmaceuticals
Tobacco
Confectionaries
Others
Countries Analyzed
North America (US, Canada, Mexico)
Europe (Germany, UK, France, Spain, Italy, Russia, Rest of Europe)
Asia Pacific (China, India, Japan, South Korea, Australia, South East Asia, Rest of Asia)
South America (Brazil, Argentina, Rest of South America)
Middle East and Africa (Saudi Arabia, UAE, Rest of Middle East, South Africa, Egypt, Rest of Africa)
Natural Menthol Companies Profiled in the Study
Agson Global
Arora Aromatics
BASF SE
Bhagat Aromatics
Fengle Perfume
Great Nation Essential Oils
Ifan Chem
KM Chemicals
Nantong Menthol Factory
Nectar Lifesciences
Silverline Chemicals
Swati Menthol & Allied Chem
Symrise AG
Takasago
Tienyuan Chem
Yinfeng Pharma
*- List Not Exhaustive
Chapter 1. TABLE OF CONTENTS
Chapter 2. Introduction to Natural Menthol Market
2.1. Market Overview
2.2. Key Statistics and Report Highlights
2.3. Scope of the Comprehensive Study
2.3.1. Market Definition
2.3.2 Countries and Regions Covered
2.3.3 Research Objective
2.3.4 Units, Currency, and Conversions
2.3.5 Industry Value Chain
2.4. Key Market Segments
2.5. Key Companies
2.6. Study Period
Chapter 3. Strategic Analysis Review
3.1. Natural Menthol Pricing Analysis and Forecast
3.2. Porter’s Five Forces
3.3. Market Ecosystem
3.4. SWOT Analysis
3.5. Regulatory Scenario
3.3. Effects of Inflation, Russia-Ukraine War, moderating economic growth, and other macroeconomic factors
Chapter 4. Competitive Landscape
4.1. Market Share Analysis
4.1.1. Global Natural Menthol Market Share by Company, 2023
4.1.2. Product Offerings of Leading Natural Menthol Companies
4.2. Market Entropy
4.2.1. New Product Launches in the Industry
4.2.2. Mergers, Acquisitions, Joint ventures, and Partnerships
4.3. Key Strategies and Best Practices
Chapter 5. Global Market Projections: Best, Reference, and Low Case Scenarios
5.1. Growth Analysis- Case Scenario Definitions
5.2. Low Growth Case Scenario Forecasts
5.3. Reference Growth Case Scenario Forecasts
5.4. High Growth Case Scenario Forecasts
Chapter 6. Market Dynamics
6.1. Natural Menthol Market Drivers
6.2. Natural Menthol Market Challenges
6.6. Natural Menthol Market Opportunities
6.4. Natural Menthol Market Trends
Chapter 7. Global Natural Menthol Market Outlook Trends
7.1. Global Natural Menthol Revenue (USD Million) and CAGR (%) by Type (2021-2032)
7.2. Global Natural Menthol Revenue (USD Million) and CAGR (%) by Application (2021-2032)
7.3. Global Natural Menthol Revenue (USD Million) and CAGR (%) by Product (2021-2032)
By Type
Food Grade
Pharmaceutical Grade
By Application
Oral Hygiene
Pharmaceuticals
Tobacco
Confectionaries
Others
Chapter 8. Global Natural Menthol Regional Analysis and Outlook
8.1. Global Natural Menthol Revenue (USD Million) By Regions (2021- 2032)
8.2. North America Natural Menthol Revenue (USD Million) by Country (2021-2032)
8.2.1. United States Natural Menthol Regional Analysis and Outlook
8.2.2. Canada Natural Menthol Regional Analysis and Outlook
8.2.3. Mexico Natural Menthol Regional Analysis and Outlook
8.3. Europe Natural Menthol Revenue (USD Million), by Country (2021-2032)
8.3.1. Germany Natural Menthol Regional Analysis and Outlook
8.3.2. France Natural Menthol Regional Analysis and Outlook
8.3.3. United Kingdom Natural Menthol Regional Analysis and Outlook
8.3.4. Spain Natural Menthol Regional Analysis and Outlook
8.3.5. Italy Natural Menthol Regional Analysis and Outlook
8.3.6. Russia Natural Menthol Regional Analysis and Outlook
8.3.7. Rest of Europe Natural Menthol Regional Analysis and Outlook
8.4. Asia Pacific Natural Menthol Revenue (USD Million) by Country (2021-2032)
8.4.1. China Natural Menthol Regional Analysis and Outlook
8.4.2. Japan Natural Menthol Regional Analysis and Outlook
8.4.3. India Natural Menthol Regional Analysis and Outlook
8.4.4. South Korea Natural Menthol Regional Analysis and Outlook
8.4.5. Australia Natural Menthol Regional Analysis and Outlook
8.4.6. South East Asia Natural Menthol Regional Analysis and Outlook
8.4.7. Rest of Asia Pacific Natural Menthol Regional Analysis and Outlook
8.5. South America Natural Menthol Revenue (USD Million), by Country (2021-2032)
8.5.1. Brazil Natural Menthol Regional Analysis and Outlook
8.5.2. Argentina Natural Menthol Regional Analysis and Outlook
8.5.3. Rest of South America Natural Menthol Regional Analysis and Outlook
8.6. Middle East and Africa Natural Menthol Revenue (USD Million) by Country (2021-2032)
8.6.1. Middle East Natural Menthol Regional Analysis and Outlook
8.6.2. Africa Natural Menthol Regional Analysis and Outlook
Chapter 9. North America Natural Menthol Analysis and Outlook
9.1. North America Natural Menthol Revenue (USD Million) by Segments (2021-2032)
9.1.1. North America Natural Menthol Revenue (USD Million) by Type (2021-2032)
9.1.2. North America Natural Menthol Revenue (USD Million) by Application (2021-2032)
9.1.3. North America Natural Menthol Revenue (USD Million) by Product (2021-2032)
By Type
Food Grade
Pharmaceutical Grade
By Application
Oral Hygiene
Pharmaceuticals
Tobacco
Confectionaries
Others
Chapter 10. Europe Natural Menthol Analysis and Outlook
10.1. Europe Natural Menthol Revenue (USD Million), by Segments (USD Million) (2021-2032)
10.1.1. Europe Natural Menthol Revenue (USD Million) by Type (2021-2032)
10.1.2. Europe Natural Menthol Revenue (USD Million) by Application (2021-2032)
10.1.3. Europe Natural Menthol Revenue (USD Million) by Product (2021-2032)
By Type
Food Grade
Pharmaceutical Grade
By Application
Oral Hygiene
Pharmaceuticals
Tobacco
Confectionaries
Others
Chapter 11. Asia Pacific Natural Menthol Analysis and Outlook
11.1. Asia Pacific Natural Menthol Revenue (USD Million), and Revenue (USD Million) by Segments (2021-2032)
11.1.1. Asia Pacific Natural Menthol Revenue (USD Million) by Type (2021-2032)
11.1.2. Asia Pacific Natural Menthol Revenue (USD Million) by Application (2021-2032)
11.1.3. Asia Pacific Natural Menthol Revenue (USD Million) by Product (2021-2032)
By Type
Food Grade
Pharmaceutical Grade
By Application
Oral Hygiene
Pharmaceuticals
Tobacco
Confectionaries
Others
Chapter 12. South America Natural Menthol Analysis and Outlook
12.1. South America Natural Menthol Revenue (USD Million), by Segments (2021-2032)
12.1.1. South America Natural Menthol Revenue (USD Million) by Type (2021-2032)
12.1.2. South America Natural Menthol Revenue (USD Million) by Application (2021-2032)
12.1.3. South America Natural Menthol Revenue (USD Million) by Product (2021-2032)
By Type
Food Grade
Pharmaceutical Grade
By Application
Oral Hygiene
Pharmaceuticals
Tobacco
Confectionaries
Others
Chapter 13. Middle East and Africa Natural Menthol Analysis and Outlook
13.1. Middle East and Africa Natural Menthol Revenue (USD Million), by Segments (2021-2032)
13.1.1. Middle East and Africa Natural Menthol Revenue (USD Million) by Type (2021-2032)
13.1.2. Middle East and Africa Natural Menthol Revenue (USD Million) by Application (2021-2032)
13.1.3. Middle East and Africa Natural Menthol Revenue (USD Million) by Product (2021-2032)
By Type
Food Grade
Pharmaceutical Grade
By Application
Oral Hygiene
Pharmaceuticals
Tobacco
Confectionaries
Others
Chapter 14. Natural Menthol Company Profiles
14.1 Business Overview
14.2 Product Profiles
14.3 SWOT Profiles
14.5 Recent Developments
14.6 Financial Profile
List of Companies
Agson Global
Arora Aromatics
BASF SE
Bhagat Aromatics
Fengle Perfume
Great Nation Essential Oils
Ifan Chem
KM Chemicals
Nantong Menthol Factory
Nectar Lifesciences
Silverline Chemicals
Swati Menthol & Allied Chem
Symrise AG
Takasago
Tienyuan Chem
Yinfeng Pharma
15. Methodology and Data Sources
15.1 Customization Offerings
15.2 Subscription Services
15.3 Related Reports
15.4 Publisher Expertise
LIST OF TABLES
Table 1 Market Segmentation Analysis
Table 2 Global Natural Menthol Market Share of Leading Companies, 2023
Table 3 Product Offerings of Leading Companies
Table 4 Low Growth Scenario Forecasts
Table 5 Reference Case Growth Scenario
Table 6 High Growth Case Scenario
Table 7 Global Natural Menthol Revenue (USD Million) And CAGR (%) By Type (2021-2032)
Table 8 Global Natural Menthol Revenue (USD Million) And CAGR (%) By Application (2021-2032)
Table 9 Global Natural Menthol Revenue (USD Million) And CAGR (%) By Product (2021-2032)
Table 10 Global Natural Menthol Market Revenue (USD Million) By Regions (2021-2032)
Table 11 Global Natural Menthol Market Share (%) By Regions (2021-2032)
Table 12 North America Natural Menthol Revenue (USD Million) By Country (2021-2032)
Table 13 Europe Natural Menthol Revenue (USD Million) By Country (2021-2032)
Table 14 Asia Pacific Natural Menthol Revenue (USD Million) By Country (2021-2032)
Table 15 South America Natural Menthol Revenue (USD Million) By Country (2021-2032)
Table 16 Middle East and Africa Natural Menthol Revenue (USD Million) By Region (2021-2032)
Table 17 North America Natural Menthol Revenue (USD Million) By Type (2021-2032)
Table 18 North America Natural Menthol Revenue (USD Million) By Application (2021-2032)
Table 19 North America Natural Menthol Revenue (USD Million) By Product (2021-2032)
Table 20 Europe Natural Menthol Revenue (USD Million) By Type (2021-2032)
Table 21 Europe Natural Menthol Revenue (USD Million) By Application (2021-2032)
Table 22 Europe Natural Menthol Revenue (USD Million) By Product (2021-2032)
Table 23 Asia Pacific Natural Menthol Revenue (USD Million) By Type (2021-2032)
Table 24 Asia Pacific Natural Menthol Revenue (USD Million) By Application (2021-2032)
Table 25 Asia Pacific Natural Menthol Revenue (USD Million) By Product (2021-2032)
Table 26 South America Natural Menthol Revenue (USD Million) By Type (2021-2032)
Table 27 South America Natural Menthol Revenue (USD Million) By Application (2021-2032)
Table 28 South America Natural Menthol Revenue (USD Million) By Product (2021-2032)
Table 29 Middle East and Africa Natural Menthol Revenue (USD Million) By Type (2021-2032)
Table 30 Middle East and Africa Natural Menthol Revenue (USD Million) By Application (2021-2032)
Table 31 Middle East and Africa Natural Menthol Revenue (USD Million) By Product (2021-2032)
LIST OF FIGURES
Figure 1. Market Scope
Figure 2. Pricing Forecasts Per Unit, 2023- 2032
Figure 3. Porter’s Five Forces
Figure 4. Global Natural Menthol Market Revenue (USD Million) By Regions (2021-2032)
Figure 5. Global Natural Menthol Market Share (%) By Regions (2023)
Figure 6. North America Natural Menthol Revenue (USD Million) By Country (2021-2032)
Figure 7. United States Natural Menthol Revenue (USD Million) By Country (2021-2032)
Figure 8. Canada Natural Menthol Revenue (USD Million) By Country (2021-2032)
Figure 9. Mexico Natural Menthol Revenue (USD Million) By Country (2021-2032)
Figure 10. Europe Natural Menthol Revenue (USD Million) By Country (2021-2032)
Figure 11. Germany Natural Menthol Revenue (USD Million) By Country (2021-2032)
Figure 12. France Natural Menthol Revenue (USD Million) By Country (2021-2032)
Figure 13. United Kingdom Natural Menthol Revenue (USD Million) By Country (2021-2032)
Figure 14. Spain Natural Menthol Revenue (USD Million) By Country (2021-2032)
Figure 15. Italy Natural Menthol Revenue (USD Million) By Country (2021-2032)
Figure 16. Russia Natural Menthol Revenue (USD Million) By Country (2021-2032)
Figure 17. Rest of Europe Natural Menthol Revenue (USD Million) By Country (2021-2032)
Figure 11. Asia Pacific Natural Menthol Revenue (USD Million) By Country (2021-2032)
Figure 12. China Natural Menthol Revenue (USD Million) By Country (2021-2032)
Figure 13. Japan Natural Menthol Revenue (USD Million) By Country (2021-2032)
Figure 14. India Natural Menthol Revenue (USD Million) By Country (2021-2032)
Figure 15. South Korea Natural Menthol Revenue (USD Million) By Country (2021-2032)
Figure 16. Australia Natural Menthol Revenue (USD Million) By Country (2021-2032)
Figure 17. South East Asia Natural Menthol Revenue (USD Million) By Country (2021-2032)
Figure 18. South America Natural Menthol Revenue (USD Million) By Country (2021-2032)
Figure 19. Brazil Natural Menthol Revenue (USD Million) By Country (2021-2032)
Figure 20. Argentina Natural Menthol Revenue (USD Million) By Country (2021-2032)
Figure 21. Rest of Asia Pacific Natural Menthol Revenue (USD Million) By Country (2021-2032)
Figure 22. Middle East and Africa Natural Menthol Revenue (USD Million) By Region (2021-2032)
Figure 23. Saudi Arabia Natural Menthol Revenue (USD Million) By Region (2021-2032)
Figure 24. The UAE Natural Menthol Revenue (USD Million) By Region (2021-2032)
Figure 25. Rest of Middle East Natural Menthol Revenue (USD Million) By Region (2021-2032)
Figure 26. South Africa Natural Menthol Revenue (USD Million) By Region (2021-2032)
Figure 27. Africa Natural Menthol Revenue (USD Million) By Region (2021-2032)
Figure 28. North America Natural Menthol Revenue (USD Million) By Type (2021-2032)
Figure 29. North America Natural Menthol Revenue (USD Million) By Application (2021-2032)
Figure 30. North America Natural Menthol Revenue (USD Million) By Product (2021-2032)
Figure 31. Europe Natural Menthol Revenue (USD Million) By Type (2021-2032)
Figure 32. Europe Natural Menthol Revenue (USD Million) By Application (2021-2032)
Figure 33. Europe Natural Menthol Revenue (USD Million) By Product (2021-2032)
Figure 34. Asia Pacific Natural Menthol Revenue (USD Million) By Type (2021-2032)
Figure 35. Asia Pacific Natural Menthol Revenue (USD Million) By Application (2021-2032)
Figure 36. Asia Pacific Natural Menthol Revenue (USD Million) By Product (2021-2032)
Figure 37. South America Natural Menthol Revenue (USD Million) By Type (2021-2032)
Figure 38. South America Natural Menthol Revenue (USD Million) By Application (2021-2032)
Figure 39. South America Natural Menthol Revenue (USD Million) By Product (2021-2032)
Figure 40. Middle East and Africa Natural Menthol Revenue (USD Million) By Type (2021-2032)
Figure 41. Middle East and Africa Natural Menthol Revenue (USD Million) By Application (2021-2032)
Figure 42. Middle East and Africa Natural Menthol Revenue (USD Million) By Product (2021-2032)
By Type
Food Grade
Pharmaceutical Grade
By Application
Oral Hygiene
Pharmaceuticals
Tobacco
Confectionaries
Others
Countries Analyzed
North America (US, Canada, Mexico)
Europe (Germany, UK, France, Spain, Italy, Russia, Rest of Europe)
Asia Pacific (China, India, Japan, South Korea, Australia, South East Asia, Rest of Asia)
South America (Brazil, Argentina, Rest of South America)
Middle East and Africa (Saudi Arabia, UAE, Rest of Middle East, South Africa, Egypt, Rest of Africa)
