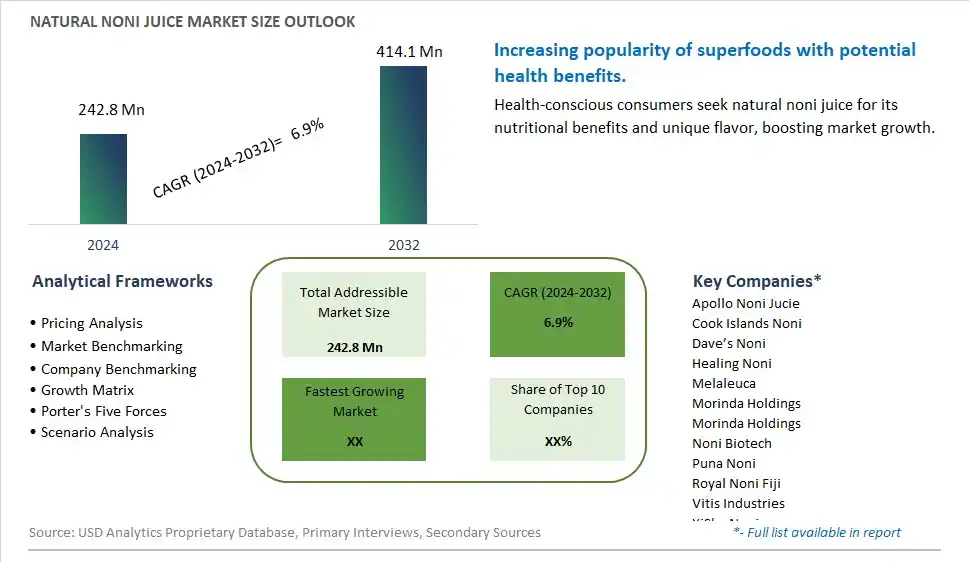
Global Natural Noni Juice Market Size is valued at $242.8 Million in 2024 and is forecast to register a growth rate (CAGR) of 6.9% to reach $414.1 Million by 2032.
The global Natural Noni Juice Market Comprehensive Study analyzes and forecasts the market size across 6 regions and 24 countries for diverse segments -By Type (Bottle Juice, Barrel Juice), By Application (Food & Beverage, Health Care Products, Others)
An Introduction to Natural Noni Juice Market
The natural noni juice market in 2024 is expanding rapidly, driven by the demand for exotic and health-promoting beverages. Noni juice, derived from the fruit of the Morinda citrifolia tree, is known for its potential health benefits, including immune support and antioxidant properties. The market benefits from advancements in juice extraction and preservation technologies that enhance product quality and shelf life. The trend towards clean label and natural ingredients is influencing product development. Increasing consumer interest in functional beverages and the popularity of superfoods are further propelling market growth.
Natural Noni Juice Competitive Landscape
The market report analyses the leading companies in the industry including Apollo Noni Jucie, Cook Islands Noni, Dave’s Noni, Healing Noni, Melaleuca, Morinda Holdings, Morinda Holdings, Noni Biotech, Puna Noni, Royal Noni Fiji, Vitis Industries, XiSha Noni, and Others.
Natural Noni Juice Market Dynamics
Natural Noni Juice Market Trend: Growing Popularity of Superfruit Juices
The most prominent trend in the Natural Noni Juice Market is the growing popularity of superfruit juices. Natural noni juice, known for its high antioxidant content and potential health benefits, is increasingly used in health and wellness beverages, driven by consumer demand for nutritious and exotic fruit juices.
Natural Noni Juice Market Driver: Health Consciousness and Demand for Functional Beverages
A key driver in the Natural Noni Juice Market is health consciousness and the demand for functional beverages. As more individuals seek beverages that offer health benefits beyond basic hydration, there is a rising demand for natural noni juice that provides immune support, digestive health, and overall wellness, supporting market growth.
Natural Noni Juice Market Opportunity: Expansion into Health and Wellness Products
One significant opportunity in the Natural Noni Juice Market lies in the expansion into health and wellness products. Companies can innovate by incorporating noni juice into a variety of products, such as dietary supplements, energy shots, and functional foods, offering consumers convenient and effective ways to enhance their health and well-being, driving market growth.
Natural Noni Juice Market Share Analysis- Largest Segment by Type
The Bottle Juice segment is the largest in the Natural Noni Juice Market. Bottled noni juice is favored for its convenience, extended shelf life, and ease of distribution. It is widely available in retail outlets and is preferred by consumers for its ready-to-drink format, which aligns with busy lifestyles and the growing demand for health beverages. Additionally, the established infrastructure for bottling and packaging supports the dominance of bottle juice in the market.
Natural Noni Juice Market Share Analysis- Fastest Growing Segment by Application
The Health Care Products application segment is expected to grow fastest in the Natural Noni Juice Market over the next five years. This growth is driven by the increasing recognition of noni juice's health benefits, including its antioxidant properties and immune-boosting effects. The rising consumer awareness of natural health supplements and the growing trend towards functional foods are propelling the demand for noni juice in health care products. As consumers seek natural and holistic solutions for wellness, the health care application of noni juice is experiencing accelerated growth.
Natural Noni Juice Market Segmentation
By Type
Bottle Juice
Barrel Juice
By Application
Food & Beverage
Health Care Products
Others
Countries Analyzed
North America (US, Canada, Mexico)
Europe (Germany, UK, France, Spain, Italy, Russia, Rest of Europe)
Asia Pacific (China, India, Japan, South Korea, Australia, South East Asia, Rest of Asia)
South America (Brazil, Argentina, Rest of South America)
Middle East and Africa (Saudi Arabia, UAE, Rest of Middle East, South Africa, Egypt, Rest of Africa)
Natural Noni Juice Companies Profiled in the Study
Apollo Noni Jucie
Cook Islands Noni
Dave’s Noni
Healing Noni
Melaleuca
Morinda Holdings
Morinda Holdings
Noni Biotech
Puna Noni
Royal Noni Fiji
Vitis Industries
XiSha Noni
*- List Not Exhaustive
Chapter 1. TABLE OF CONTENTS
Chapter 2. Introduction to Natural Noni Juice Market
2.1. Market Overview
2.2. Key Statistics and Report Highlights
2.3. Scope of the Comprehensive Study
2.3.1. Market Definition
2.3.2 Countries and Regions Covered
2.3.3 Research Objective
2.3.4 Units, Currency, and Conversions
2.3.5 Industry Value Chain
2.4. Key Market Segments
2.5. Key Companies
2.6. Study Period
Chapter 3. Strategic Analysis Review
3.1. Natural Noni Juice Pricing Analysis and Forecast
3.2. Porter’s Five Forces
3.3. Market Ecosystem
3.4. SWOT Analysis
3.5. Regulatory Scenario
3.3. Effects of Inflation, Russia-Ukraine War, moderating economic growth, and other macroeconomic factors
Chapter 4. Competitive Landscape
4.1. Market Share Analysis
4.1.1. Global Natural Noni Juice Market Share by Company, 2023
4.1.2. Product Offerings of Leading Natural Noni Juice Companies
4.2. Market Entropy
4.2.1. New Product Launches in the Industry
4.2.2. Mergers, Acquisitions, Joint ventures, and Partnerships
4.3. Key Strategies and Best Practices
Chapter 5. Global Market Projections: Best, Reference, and Low Case Scenarios
5.1. Growth Analysis- Case Scenario Definitions
5.2. Low Growth Case Scenario Forecasts
5.3. Reference Growth Case Scenario Forecasts
5.4. High Growth Case Scenario Forecasts
Chapter 6. Market Dynamics
6.1. Natural Noni Juice Market Drivers
6.2. Natural Noni Juice Market Challenges
6.6. Natural Noni Juice Market Opportunities
6.4. Natural Noni Juice Market Trends
Chapter 7. Global Natural Noni Juice Market Outlook Trends
7.1. Global Natural Noni Juice Revenue (USD Million) and CAGR (%) by Type (2021-2032)
7.2. Global Natural Noni Juice Revenue (USD Million) and CAGR (%) by Application (2021-2032)
7.3. Global Natural Noni Juice Revenue (USD Million) and CAGR (%) by Product (2021-2032)
By Type
Bottle Juice
Barrel Juice
By Application
Food & Beverage
Health Care Products
Others
Chapter 8. Global Natural Noni Juice Regional Analysis and Outlook
8.1. Global Natural Noni Juice Revenue (USD Million) By Regions (2021- 2032)
8.2. North America Natural Noni Juice Revenue (USD Million) by Country (2021-2032)
8.2.1. United States Natural Noni Juice Regional Analysis and Outlook
8.2.2. Canada Natural Noni Juice Regional Analysis and Outlook
8.2.3. Mexico Natural Noni Juice Regional Analysis and Outlook
8.3. Europe Natural Noni Juice Revenue (USD Million), by Country (2021-2032)
8.3.1. Germany Natural Noni Juice Regional Analysis and Outlook
8.3.2. France Natural Noni Juice Regional Analysis and Outlook
8.3.3. United Kingdom Natural Noni Juice Regional Analysis and Outlook
8.3.4. Spain Natural Noni Juice Regional Analysis and Outlook
8.3.5. Italy Natural Noni Juice Regional Analysis and Outlook
8.3.6. Russia Natural Noni Juice Regional Analysis and Outlook
8.3.7. Rest of Europe Natural Noni Juice Regional Analysis and Outlook
8.4. Asia Pacific Natural Noni Juice Revenue (USD Million) by Country (2021-2032)
8.4.1. China Natural Noni Juice Regional Analysis and Outlook
8.4.2. Japan Natural Noni Juice Regional Analysis and Outlook
8.4.3. India Natural Noni Juice Regional Analysis and Outlook
8.4.4. South Korea Natural Noni Juice Regional Analysis and Outlook
8.4.5. Australia Natural Noni Juice Regional Analysis and Outlook
8.4.6. South East Asia Natural Noni Juice Regional Analysis and Outlook
8.4.7. Rest of Asia Pacific Natural Noni Juice Regional Analysis and Outlook
8.5. South America Natural Noni Juice Revenue (USD Million), by Country (2021-2032)
8.5.1. Brazil Natural Noni Juice Regional Analysis and Outlook
8.5.2. Argentina Natural Noni Juice Regional Analysis and Outlook
8.5.3. Rest of South America Natural Noni Juice Regional Analysis and Outlook
8.6. Middle East and Africa Natural Noni Juice Revenue (USD Million) by Country (2021-2032)
8.6.1. Middle East Natural Noni Juice Regional Analysis and Outlook
8.6.2. Africa Natural Noni Juice Regional Analysis and Outlook
Chapter 9. North America Natural Noni Juice Analysis and Outlook
9.1. North America Natural Noni Juice Revenue (USD Million) by Segments (2021-2032)
9.1.1. North America Natural Noni Juice Revenue (USD Million) by Type (2021-2032)
9.1.2. North America Natural Noni Juice Revenue (USD Million) by Application (2021-2032)
9.1.3. North America Natural Noni Juice Revenue (USD Million) by Product (2021-2032)
By Type
Bottle Juice
Barrel Juice
By Application
Food & Beverage
Health Care Products
Others
Chapter 10. Europe Natural Noni Juice Analysis and Outlook
10.1. Europe Natural Noni Juice Revenue (USD Million), by Segments (USD Million) (2021-2032)
10.1.1. Europe Natural Noni Juice Revenue (USD Million) by Type (2021-2032)
10.1.2. Europe Natural Noni Juice Revenue (USD Million) by Application (2021-2032)
10.1.3. Europe Natural Noni Juice Revenue (USD Million) by Product (2021-2032)
By Type
Bottle Juice
Barrel Juice
By Application
Food & Beverage
Health Care Products
Others
Chapter 11. Asia Pacific Natural Noni Juice Analysis and Outlook
11.1. Asia Pacific Natural Noni Juice Revenue (USD Million), and Revenue (USD Million) by Segments (2021-2032)
11.1.1. Asia Pacific Natural Noni Juice Revenue (USD Million) by Type (2021-2032)
11.1.2. Asia Pacific Natural Noni Juice Revenue (USD Million) by Application (2021-2032)
11.1.3. Asia Pacific Natural Noni Juice Revenue (USD Million) by Product (2021-2032)
By Type
Bottle Juice
Barrel Juice
By Application
Food & Beverage
Health Care Products
Others
Chapter 12. South America Natural Noni Juice Analysis and Outlook
12.1. South America Natural Noni Juice Revenue (USD Million), by Segments (2021-2032)
12.1.1. South America Natural Noni Juice Revenue (USD Million) by Type (2021-2032)
12.1.2. South America Natural Noni Juice Revenue (USD Million) by Application (2021-2032)
12.1.3. South America Natural Noni Juice Revenue (USD Million) by Product (2021-2032)
By Type
Bottle Juice
Barrel Juice
By Application
Food & Beverage
Health Care Products
Others
Chapter 13. Middle East and Africa Natural Noni Juice Analysis and Outlook
13.1. Middle East and Africa Natural Noni Juice Revenue (USD Million), by Segments (2021-2032)
13.1.1. Middle East and Africa Natural Noni Juice Revenue (USD Million) by Type (2021-2032)
13.1.2. Middle East and Africa Natural Noni Juice Revenue (USD Million) by Application (2021-2032)
13.1.3. Middle East and Africa Natural Noni Juice Revenue (USD Million) by Product (2021-2032)
By Type
Bottle Juice
Barrel Juice
By Application
Food & Beverage
Health Care Products
Others
Chapter 14. Natural Noni Juice Company Profiles
14.1 Business Overview
14.2 Product Profiles
14.3 SWOT Profiles
14.5 Recent Developments
14.6 Financial Profile
List of Companies
Apollo Noni Jucie
Cook Islands Noni
Dave’s Noni
Healing Noni
Melaleuca
Morinda Holdings
Morinda Holdings
Noni Biotech
Puna Noni
Royal Noni Fiji
Vitis Industries
XiSha Noni
15. Methodology and Data Sources
15.1 Customization Offerings
15.2 Subscription Services
15.3 Related Reports
15.4 Publisher Expertise
LIST OF TABLES
Table 1 Market Segmentation Analysis
Table 2 Global Natural Noni Juice Market Share of Leading Companies, 2023
Table 3 Product Offerings of Leading Companies
Table 4 Low Growth Scenario Forecasts
Table 5 Reference Case Growth Scenario
Table 6 High Growth Case Scenario
Table 7 Global Natural Noni Juice Revenue (USD Million) And CAGR (%) By Type (2021-2032)
Table 8 Global Natural Noni Juice Revenue (USD Million) And CAGR (%) By Application (2021-2032)
Table 9 Global Natural Noni Juice Revenue (USD Million) And CAGR (%) By Product (2021-2032)
Table 10 Global Natural Noni Juice Market Revenue (USD Million) By Regions (2021-2032)
Table 11 Global Natural Noni Juice Market Share (%) By Regions (2021-2032)
Table 12 North America Natural Noni Juice Revenue (USD Million) By Country (2021-2032)
Table 13 Europe Natural Noni Juice Revenue (USD Million) By Country (2021-2032)
Table 14 Asia Pacific Natural Noni Juice Revenue (USD Million) By Country (2021-2032)
Table 15 South America Natural Noni Juice Revenue (USD Million) By Country (2021-2032)
Table 16 Middle East and Africa Natural Noni Juice Revenue (USD Million) By Region (2021-2032)
Table 17 North America Natural Noni Juice Revenue (USD Million) By Type (2021-2032)
Table 18 North America Natural Noni Juice Revenue (USD Million) By Application (2021-2032)
Table 19 North America Natural Noni Juice Revenue (USD Million) By Product (2021-2032)
Table 20 Europe Natural Noni Juice Revenue (USD Million) By Type (2021-2032)
Table 21 Europe Natural Noni Juice Revenue (USD Million) By Application (2021-2032)
Table 22 Europe Natural Noni Juice Revenue (USD Million) By Product (2021-2032)
Table 23 Asia Pacific Natural Noni Juice Revenue (USD Million) By Type (2021-2032)
Table 24 Asia Pacific Natural Noni Juice Revenue (USD Million) By Application (2021-2032)
Table 25 Asia Pacific Natural Noni Juice Revenue (USD Million) By Product (2021-2032)
Table 26 South America Natural Noni Juice Revenue (USD Million) By Type (2021-2032)
Table 27 South America Natural Noni Juice Revenue (USD Million) By Application (2021-2032)
Table 28 South America Natural Noni Juice Revenue (USD Million) By Product (2021-2032)
Table 29 Middle East and Africa Natural Noni Juice Revenue (USD Million) By Type (2021-2032)
Table 30 Middle East and Africa Natural Noni Juice Revenue (USD Million) By Application (2021-2032)
Table 31 Middle East and Africa Natural Noni Juice Revenue (USD Million) By Product (2021-2032)
LIST OF FIGURES
Figure 1. Market Scope
Figure 2. Pricing Forecasts Per Unit, 2023- 2032
Figure 3. Porter’s Five Forces
Figure 4. Global Natural Noni Juice Market Revenue (USD Million) By Regions (2021-2032)
Figure 5. Global Natural Noni Juice Market Share (%) By Regions (2023)
Figure 6. North America Natural Noni Juice Revenue (USD Million) By Country (2021-2032)
Figure 7. United States Natural Noni Juice Revenue (USD Million) By Country (2021-2032)
Figure 8. Canada Natural Noni Juice Revenue (USD Million) By Country (2021-2032)
Figure 9. Mexico Natural Noni Juice Revenue (USD Million) By Country (2021-2032)
Figure 10. Europe Natural Noni Juice Revenue (USD Million) By Country (2021-2032)
Figure 11. Germany Natural Noni Juice Revenue (USD Million) By Country (2021-2032)
Figure 12. France Natural Noni Juice Revenue (USD Million) By Country (2021-2032)
Figure 13. United Kingdom Natural Noni Juice Revenue (USD Million) By Country (2021-2032)
Figure 14. Spain Natural Noni Juice Revenue (USD Million) By Country (2021-2032)
Figure 15. Italy Natural Noni Juice Revenue (USD Million) By Country (2021-2032)
Figure 16. Russia Natural Noni Juice Revenue (USD Million) By Country (2021-2032)
Figure 17. Rest of Europe Natural Noni Juice Revenue (USD Million) By Country (2021-2032)
Figure 11. Asia Pacific Natural Noni Juice Revenue (USD Million) By Country (2021-2032)
Figure 12. China Natural Noni Juice Revenue (USD Million) By Country (2021-2032)
Figure 13. Japan Natural Noni Juice Revenue (USD Million) By Country (2021-2032)
Figure 14. India Natural Noni Juice Revenue (USD Million) By Country (2021-2032)
Figure 15. South Korea Natural Noni Juice Revenue (USD Million) By Country (2021-2032)
Figure 16. Australia Natural Noni Juice Revenue (USD Million) By Country (2021-2032)
Figure 17. South East Asia Natural Noni Juice Revenue (USD Million) By Country (2021-2032)
Figure 18. South America Natural Noni Juice Revenue (USD Million) By Country (2021-2032)
Figure 19. Brazil Natural Noni Juice Revenue (USD Million) By Country (2021-2032)
Figure 20. Argentina Natural Noni Juice Revenue (USD Million) By Country (2021-2032)
Figure 21. Rest of Asia Pacific Natural Noni Juice Revenue (USD Million) By Country (2021-2032)
Figure 22. Middle East and Africa Natural Noni Juice Revenue (USD Million) By Region (2021-2032)
Figure 23. Saudi Arabia Natural Noni Juice Revenue (USD Million) By Region (2021-2032)
Figure 24. The UAE Natural Noni Juice Revenue (USD Million) By Region (2021-2032)
Figure 25. Rest of Middle East Natural Noni Juice Revenue (USD Million) By Region (2021-2032)
Figure 26. South Africa Natural Noni Juice Revenue (USD Million) By Region (2021-2032)
Figure 27. Africa Natural Noni Juice Revenue (USD Million) By Region (2021-2032)
Figure 28. North America Natural Noni Juice Revenue (USD Million) By Type (2021-2032)
Figure 29. North America Natural Noni Juice Revenue (USD Million) By Application (2021-2032)
Figure 30. North America Natural Noni Juice Revenue (USD Million) By Product (2021-2032)
Figure 31. Europe Natural Noni Juice Revenue (USD Million) By Type (2021-2032)
Figure 32. Europe Natural Noni Juice Revenue (USD Million) By Application (2021-2032)
Figure 33. Europe Natural Noni Juice Revenue (USD Million) By Product (2021-2032)
Figure 34. Asia Pacific Natural Noni Juice Revenue (USD Million) By Type (2021-2032)
Figure 35. Asia Pacific Natural Noni Juice Revenue (USD Million) By Application (2021-2032)
Figure 36. Asia Pacific Natural Noni Juice Revenue (USD Million) By Product (2021-2032)
Figure 37. South America Natural Noni Juice Revenue (USD Million) By Type (2021-2032)
Figure 38. South America Natural Noni Juice Revenue (USD Million) By Application (2021-2032)
Figure 39. South America Natural Noni Juice Revenue (USD Million) By Product (2021-2032)
Figure 40. Middle East and Africa Natural Noni Juice Revenue (USD Million) By Type (2021-2032)
Figure 41. Middle East and Africa Natural Noni Juice Revenue (USD Million) By Application (2021-2032)
Figure 42. Middle East and Africa Natural Noni Juice Revenue (USD Million) By Product (2021-2032)
By Type
Bottle Juice
Barrel Juice
By Application
Food & Beverage
Health Care Products
Others
Countries Analyzed
North America (US, Canada, Mexico)
Europe (Germany, UK, France, Spain, Italy, Russia, Rest of Europe)
Asia Pacific (China, India, Japan, South Korea, Australia, South East Asia, Rest of Asia)
South America (Brazil, Argentina, Rest of South America)
Middle East and Africa (Saudi Arabia, UAE, Rest of Middle East, South Africa, Egypt, Rest of Africa)
