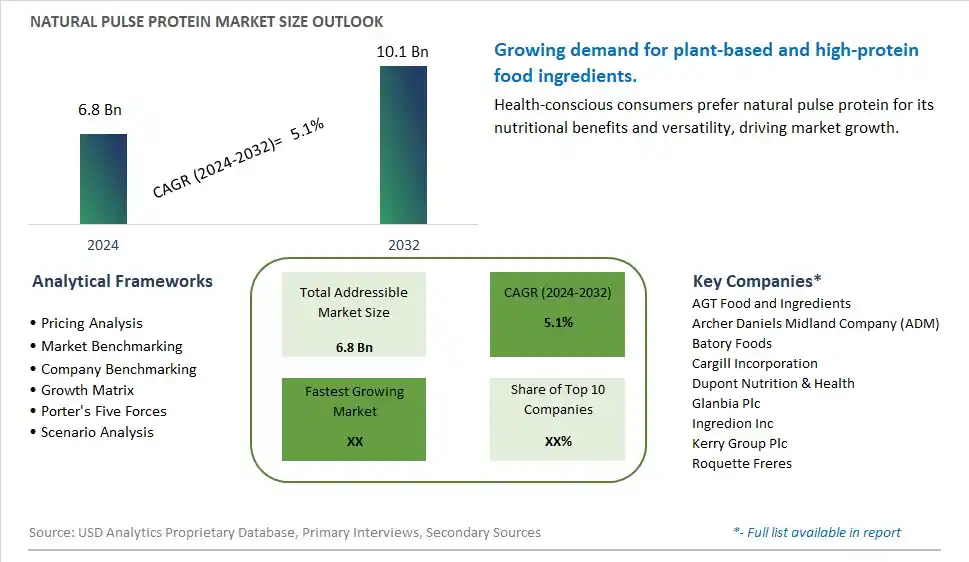
Global Natural Pulse Protein Market Size is valued at $6.8 Billion in 2024 and is forecast to register a growth rate (CAGR) of 5.1% to reach $10.1 Billion by 2032.
The global Natural Pulse Protein Market Comprehensive Study analyzes and forecasts the market size across 6 regions and 24 countries for diverse segments -By Type (Beans, Chickpeas, Yellow Peas, Lentils, Others), By Application (Food & Beverage, Dietary Supplements, Others)
An Introduction to Natural Pulse Protein Market
The Natural Pulse Protein Market involves the production and sale of protein derived from pulses such as peas, lentils, and chickpeas. These proteins cater to consumers seeking plant-based and sustainable protein sources. The market is driven by increasing demand for plant-based and vegan products, rising awareness about the benefits of pulse proteins, and growing applications in the food and beverage industry. Additionally, advancements in protein extraction technologies and the expansion of product applications support market growth.
Natural Pulse Protein Competitive Landscape
The market report analyses the leading companies in the industry including AGT Food and Ingredients, Archer Daniels Midland Company (ADM), Batory Foods, Cargill Incorporation, Dupont Nutrition & Health, Glanbia Plc, Ingredion Inc, Kerry Group Plc, Roquette Freres, and Others.
Natural Pulse Protein Market Dynamics
Natural Pulse Protein Market Trend: Increasing Use in Plant-Based Protein Products
The most prominent trend in the Natural Pulse Protein Market is the increasing use in plant-based protein products. Natural pulse proteins, derived from legumes such as peas, lentils, and chickpeas, are gaining popularity as a sustainable and nutritious alternative to animal-based proteins, driven by the demand for plant-based diets.
Natural Pulse Protein Market Driver: Health Consciousness and Environmental Concerns
A key driver in the Natural Pulse Protein Market is health consciousness and environmental concerns. As more individuals focus on improving their diet and reducing their environmental footprint, there is a rising demand for plant-based proteins that offer high nutritional value and sustainability, supporting market growth.
Natural Pulse Protein Market Opportunity: Innovation in Protein-Enriched Foods and Beverages
One significant opportunity in the Natural Pulse Protein Market lies in innovation in protein-enriched foods and beverages. Companies can develop new products that incorporate natural pulse proteins, such as protein bars, shakes, and meat alternatives, offering consumers diverse and health-focused options that cater to their dietary needs and preferences, driving market growth.
Natural Pulse Protein Market Share Analysis- Largest Segment by Type
In the Natural Pulse Protein Market, Yellow Peas emerge as the largest segment. Yellow peas are a dominant source of protein due to their high protein content and neutral flavor, which makes them highly versatile across various food products. They offer a well-balanced amino acid profile and are increasingly used in protein isolates and concentrates for their functional benefits, including solubility and emulsification properties. Their wide application in plant-based foods and snacks has led to a higher market share compared to other pulse types. Additionally, the established agricultural and processing infrastructure for yellow peas further supports their dominant position in the market.
Natural Pulse Protein Market Share Analysis- Fastest Growing Segment by Application
The Food & Beverage application segment is set to grow the fastest in the Natural Pulse Protein Market over the next five years. This growth is driven by the increasing demand for plant-based protein sources as consumers seek healthier and more sustainable alternatives to animal-based proteins. Pulse proteins are gaining traction due to their nutritional benefits, including high protein content and lower allergenic potential. The rise in plant-based diets, combined with innovations in food formulations incorporating pulse proteins for texture and functionality, fuels this rapid expansion. The food and beverage sector’s ongoing trend towards healthier and cleaner ingredient profiles accelerates the adoption of pulse proteins.
Natural Pulse Protein Market Segmentation
By Type
Beans
Chickpeas
Yellow Peas
Lentils
Others
By Application
Food & Beverage
Dietary Supplements
Others
Countries Analyzed
North America (US, Canada, Mexico)
Europe (Germany, UK, France, Spain, Italy, Russia, Rest of Europe)
Asia Pacific (China, India, Japan, South Korea, Australia, South East Asia, Rest of Asia)
South America (Brazil, Argentina, Rest of South America)
Middle East and Africa (Saudi Arabia, UAE, Rest of Middle East, South Africa, Egypt, Rest of Africa)
Natural Pulse Protein Companies Profiled in the Study
AGT Food and Ingredients
Archer Daniels Midland Company (ADM)
Batory Foods
Cargill Incorporation
Dupont Nutrition & Health
Glanbia Plc
Ingredion Inc
Kerry Group Plc
Roquette Freres
*- List Not Exhaustive
Chapter 1. TABLE OF CONTENTS
Chapter 2. Introduction to Natural Pulse Protein Market
2.1. Market Overview
2.2. Key Statistics and Report Highlights
2.3. Scope of the Comprehensive Study
2.3.1. Market Definition
2.3.2 Countries and Regions Covered
2.3.3 Research Objective
2.3.4 Units, Currency, and Conversions
2.3.5 Industry Value Chain
2.4. Key Market Segments
2.5. Key Companies
2.6. Study Period
Chapter 3. Strategic Analysis Review
3.1. Natural Pulse Protein Pricing Analysis and Forecast
3.2. Porter’s Five Forces
3.3. Market Ecosystem
3.4. SWOT Analysis
3.5. Regulatory Scenario
3.3. Effects of Inflation, Russia-Ukraine War, moderating economic growth, and other macroeconomic factors
Chapter 4. Competitive Landscape
4.1. Market Share Analysis
4.1.1. Global Natural Pulse Protein Market Share by Company, 2023
4.1.2. Product Offerings of Leading Natural Pulse Protein Companies
4.2. Market Entropy
4.2.1. New Product Launches in the Industry
4.2.2. Mergers, Acquisitions, Joint ventures, and Partnerships
4.3. Key Strategies and Best Practices
Chapter 5. Global Market Projections: Best, Reference, and Low Case Scenarios
5.1. Growth Analysis- Case Scenario Definitions
5.2. Low Growth Case Scenario Forecasts
5.3. Reference Growth Case Scenario Forecasts
5.4. High Growth Case Scenario Forecasts
Chapter 6. Market Dynamics
6.1. Natural Pulse Protein Market Drivers
6.2. Natural Pulse Protein Market Challenges
6.6. Natural Pulse Protein Market Opportunities
6.4. Natural Pulse Protein Market Trends
Chapter 7. Global Natural Pulse Protein Market Outlook Trends
7.1. Global Natural Pulse Protein Revenue (USD Million) and CAGR (%) by Type (2021-2032)
7.2. Global Natural Pulse Protein Revenue (USD Million) and CAGR (%) by Application (2021-2032)
7.3. Global Natural Pulse Protein Revenue (USD Million) and CAGR (%) by Product (2021-2032)
By Type
Beans
Chickpeas
Yellow Peas
Lentils
Others
By Application
Food & Beverage
Dietary Supplements
Others
Chapter 8. Global Natural Pulse Protein Regional Analysis and Outlook
8.1. Global Natural Pulse Protein Revenue (USD Million) By Regions (2021- 2032)
8.2. North America Natural Pulse Protein Revenue (USD Million) by Country (2021-2032)
8.2.1. United States Natural Pulse Protein Regional Analysis and Outlook
8.2.2. Canada Natural Pulse Protein Regional Analysis and Outlook
8.2.3. Mexico Natural Pulse Protein Regional Analysis and Outlook
8.3. Europe Natural Pulse Protein Revenue (USD Million), by Country (2021-2032)
8.3.1. Germany Natural Pulse Protein Regional Analysis and Outlook
8.3.2. France Natural Pulse Protein Regional Analysis and Outlook
8.3.3. United Kingdom Natural Pulse Protein Regional Analysis and Outlook
8.3.4. Spain Natural Pulse Protein Regional Analysis and Outlook
8.3.5. Italy Natural Pulse Protein Regional Analysis and Outlook
8.3.6. Russia Natural Pulse Protein Regional Analysis and Outlook
8.3.7. Rest of Europe Natural Pulse Protein Regional Analysis and Outlook
8.4. Asia Pacific Natural Pulse Protein Revenue (USD Million) by Country (2021-2032)
8.4.1. China Natural Pulse Protein Regional Analysis and Outlook
8.4.2. Japan Natural Pulse Protein Regional Analysis and Outlook
8.4.3. India Natural Pulse Protein Regional Analysis and Outlook
8.4.4. South Korea Natural Pulse Protein Regional Analysis and Outlook
8.4.5. Australia Natural Pulse Protein Regional Analysis and Outlook
8.4.6. South East Asia Natural Pulse Protein Regional Analysis and Outlook
8.4.7. Rest of Asia Pacific Natural Pulse Protein Regional Analysis and Outlook
8.5. South America Natural Pulse Protein Revenue (USD Million), by Country (2021-2032)
8.5.1. Brazil Natural Pulse Protein Regional Analysis and Outlook
8.5.2. Argentina Natural Pulse Protein Regional Analysis and Outlook
8.5.3. Rest of South America Natural Pulse Protein Regional Analysis and Outlook
8.6. Middle East and Africa Natural Pulse Protein Revenue (USD Million) by Country (2021-2032)
8.6.1. Middle East Natural Pulse Protein Regional Analysis and Outlook
8.6.2. Africa Natural Pulse Protein Regional Analysis and Outlook
Chapter 9. North America Natural Pulse Protein Analysis and Outlook
9.1. North America Natural Pulse Protein Revenue (USD Million) by Segments (2021-2032)
9.1.1. North America Natural Pulse Protein Revenue (USD Million) by Type (2021-2032)
9.1.2. North America Natural Pulse Protein Revenue (USD Million) by Application (2021-2032)
9.1.3. North America Natural Pulse Protein Revenue (USD Million) by Product (2021-2032)
By Type
Beans
Chickpeas
Yellow Peas
Lentils
Others
By Application
Food & Beverage
Dietary Supplements
Others
Chapter 10. Europe Natural Pulse Protein Analysis and Outlook
10.1. Europe Natural Pulse Protein Revenue (USD Million), by Segments (USD Million) (2021-2032)
10.1.1. Europe Natural Pulse Protein Revenue (USD Million) by Type (2021-2032)
10.1.2. Europe Natural Pulse Protein Revenue (USD Million) by Application (2021-2032)
10.1.3. Europe Natural Pulse Protein Revenue (USD Million) by Product (2021-2032)
By Type
Beans
Chickpeas
Yellow Peas
Lentils
Others
By Application
Food & Beverage
Dietary Supplements
Others
Chapter 11. Asia Pacific Natural Pulse Protein Analysis and Outlook
11.1. Asia Pacific Natural Pulse Protein Revenue (USD Million), and Revenue (USD Million) by Segments (2021-2032)
11.1.1. Asia Pacific Natural Pulse Protein Revenue (USD Million) by Type (2021-2032)
11.1.2. Asia Pacific Natural Pulse Protein Revenue (USD Million) by Application (2021-2032)
11.1.3. Asia Pacific Natural Pulse Protein Revenue (USD Million) by Product (2021-2032)
By Type
Beans
Chickpeas
Yellow Peas
Lentils
Others
By Application
Food & Beverage
Dietary Supplements
Others
Chapter 12. South America Natural Pulse Protein Analysis and Outlook
12.1. South America Natural Pulse Protein Revenue (USD Million), by Segments (2021-2032)
12.1.1. South America Natural Pulse Protein Revenue (USD Million) by Type (2021-2032)
12.1.2. South America Natural Pulse Protein Revenue (USD Million) by Application (2021-2032)
12.1.3. South America Natural Pulse Protein Revenue (USD Million) by Product (2021-2032)
By Type
Beans
Chickpeas
Yellow Peas
Lentils
Others
By Application
Food & Beverage
Dietary Supplements
Others
Chapter 13. Middle East and Africa Natural Pulse Protein Analysis and Outlook
13.1. Middle East and Africa Natural Pulse Protein Revenue (USD Million), by Segments (2021-2032)
13.1.1. Middle East and Africa Natural Pulse Protein Revenue (USD Million) by Type (2021-2032)
13.1.2. Middle East and Africa Natural Pulse Protein Revenue (USD Million) by Application (2021-2032)
13.1.3. Middle East and Africa Natural Pulse Protein Revenue (USD Million) by Product (2021-2032)
By Type
Beans
Chickpeas
Yellow Peas
Lentils
Others
By Application
Food & Beverage
Dietary Supplements
Others
Chapter 14. Natural Pulse Protein Company Profiles
14.1 Business Overview
14.2 Product Profiles
14.3 SWOT Profiles
14.5 Recent Developments
14.6 Financial Profile
List of Companies
AGT Food and Ingredients
Archer Daniels Midland Company (ADM)
Batory Foods
Cargill Incorporation
Dupont Nutrition & Health
Glanbia Plc
Ingredion Inc
Kerry Group Plc
Roquette Freres
15. Methodology and Data Sources
15.1 Customization Offerings
15.2 Subscription Services
15.3 Related Reports
15.4 Publisher Expertise
LIST OF TABLES
Table 1 Market Segmentation Analysis
Table 2 Global Natural Pulse Protein Market Share of Leading Companies, 2023
Table 3 Product Offerings of Leading Companies
Table 4 Low Growth Scenario Forecasts
Table 5 Reference Case Growth Scenario
Table 6 High Growth Case Scenario
Table 7 Global Natural Pulse Protein Revenue (USD Million) And CAGR (%) By Type (2021-2032)
Table 8 Global Natural Pulse Protein Revenue (USD Million) And CAGR (%) By Application (2021-2032)
Table 9 Global Natural Pulse Protein Revenue (USD Million) And CAGR (%) By Product (2021-2032)
Table 10 Global Natural Pulse Protein Market Revenue (USD Million) By Regions (2021-2032)
Table 11 Global Natural Pulse Protein Market Share (%) By Regions (2021-2032)
Table 12 North America Natural Pulse Protein Revenue (USD Million) By Country (2021-2032)
Table 13 Europe Natural Pulse Protein Revenue (USD Million) By Country (2021-2032)
Table 14 Asia Pacific Natural Pulse Protein Revenue (USD Million) By Country (2021-2032)
Table 15 South America Natural Pulse Protein Revenue (USD Million) By Country (2021-2032)
Table 16 Middle East and Africa Natural Pulse Protein Revenue (USD Million) By Region (2021-2032)
Table 17 North America Natural Pulse Protein Revenue (USD Million) By Type (2021-2032)
Table 18 North America Natural Pulse Protein Revenue (USD Million) By Application (2021-2032)
Table 19 North America Natural Pulse Protein Revenue (USD Million) By Product (2021-2032)
Table 20 Europe Natural Pulse Protein Revenue (USD Million) By Type (2021-2032)
Table 21 Europe Natural Pulse Protein Revenue (USD Million) By Application (2021-2032)
Table 22 Europe Natural Pulse Protein Revenue (USD Million) By Product (2021-2032)
Table 23 Asia Pacific Natural Pulse Protein Revenue (USD Million) By Type (2021-2032)
Table 24 Asia Pacific Natural Pulse Protein Revenue (USD Million) By Application (2021-2032)
Table 25 Asia Pacific Natural Pulse Protein Revenue (USD Million) By Product (2021-2032)
Table 26 South America Natural Pulse Protein Revenue (USD Million) By Type (2021-2032)
Table 27 South America Natural Pulse Protein Revenue (USD Million) By Application (2021-2032)
Table 28 South America Natural Pulse Protein Revenue (USD Million) By Product (2021-2032)
Table 29 Middle East and Africa Natural Pulse Protein Revenue (USD Million) By Type (2021-2032)
Table 30 Middle East and Africa Natural Pulse Protein Revenue (USD Million) By Application (2021-2032)
Table 31 Middle East and Africa Natural Pulse Protein Revenue (USD Million) By Product (2021-2032)
LIST OF FIGURES
Figure 1. Market Scope
Figure 2. Pricing Forecasts Per Unit, 2023- 2032
Figure 3. Porter’s Five Forces
Figure 4. Global Natural Pulse Protein Market Revenue (USD Million) By Regions (2021-2032)
Figure 5. Global Natural Pulse Protein Market Share (%) By Regions (2023)
Figure 6. North America Natural Pulse Protein Revenue (USD Million) By Country (2021-2032)
Figure 7. United States Natural Pulse Protein Revenue (USD Million) By Country (2021-2032)
Figure 8. Canada Natural Pulse Protein Revenue (USD Million) By Country (2021-2032)
Figure 9. Mexico Natural Pulse Protein Revenue (USD Million) By Country (2021-2032)
Figure 10. Europe Natural Pulse Protein Revenue (USD Million) By Country (2021-2032)
Figure 11. Germany Natural Pulse Protein Revenue (USD Million) By Country (2021-2032)
Figure 12. France Natural Pulse Protein Revenue (USD Million) By Country (2021-2032)
Figure 13. United Kingdom Natural Pulse Protein Revenue (USD Million) By Country (2021-2032)
Figure 14. Spain Natural Pulse Protein Revenue (USD Million) By Country (2021-2032)
Figure 15. Italy Natural Pulse Protein Revenue (USD Million) By Country (2021-2032)
Figure 16. Russia Natural Pulse Protein Revenue (USD Million) By Country (2021-2032)
Figure 17. Rest of Europe Natural Pulse Protein Revenue (USD Million) By Country (2021-2032)
Figure 11. Asia Pacific Natural Pulse Protein Revenue (USD Million) By Country (2021-2032)
Figure 12. China Natural Pulse Protein Revenue (USD Million) By Country (2021-2032)
Figure 13. Japan Natural Pulse Protein Revenue (USD Million) By Country (2021-2032)
Figure 14. India Natural Pulse Protein Revenue (USD Million) By Country (2021-2032)
Figure 15. South Korea Natural Pulse Protein Revenue (USD Million) By Country (2021-2032)
Figure 16. Australia Natural Pulse Protein Revenue (USD Million) By Country (2021-2032)
Figure 17. South East Asia Natural Pulse Protein Revenue (USD Million) By Country (2021-2032)
Figure 18. South America Natural Pulse Protein Revenue (USD Million) By Country (2021-2032)
Figure 19. Brazil Natural Pulse Protein Revenue (USD Million) By Country (2021-2032)
Figure 20. Argentina Natural Pulse Protein Revenue (USD Million) By Country (2021-2032)
Figure 21. Rest of Asia Pacific Natural Pulse Protein Revenue (USD Million) By Country (2021-2032)
Figure 22. Middle East and Africa Natural Pulse Protein Revenue (USD Million) By Region (2021-2032)
Figure 23. Saudi Arabia Natural Pulse Protein Revenue (USD Million) By Region (2021-2032)
Figure 24. The UAE Natural Pulse Protein Revenue (USD Million) By Region (2021-2032)
Figure 25. Rest of Middle East Natural Pulse Protein Revenue (USD Million) By Region (2021-2032)
Figure 26. South Africa Natural Pulse Protein Revenue (USD Million) By Region (2021-2032)
Figure 27. Africa Natural Pulse Protein Revenue (USD Million) By Region (2021-2032)
Figure 28. North America Natural Pulse Protein Revenue (USD Million) By Type (2021-2032)
Figure 29. North America Natural Pulse Protein Revenue (USD Million) By Application (2021-2032)
Figure 30. North America Natural Pulse Protein Revenue (USD Million) By Product (2021-2032)
Figure 31. Europe Natural Pulse Protein Revenue (USD Million) By Type (2021-2032)
Figure 32. Europe Natural Pulse Protein Revenue (USD Million) By Application (2021-2032)
Figure 33. Europe Natural Pulse Protein Revenue (USD Million) By Product (2021-2032)
Figure 34. Asia Pacific Natural Pulse Protein Revenue (USD Million) By Type (2021-2032)
Figure 35. Asia Pacific Natural Pulse Protein Revenue (USD Million) By Application (2021-2032)
Figure 36. Asia Pacific Natural Pulse Protein Revenue (USD Million) By Product (2021-2032)
Figure 37. South America Natural Pulse Protein Revenue (USD Million) By Type (2021-2032)
Figure 38. South America Natural Pulse Protein Revenue (USD Million) By Application (2021-2032)
Figure 39. South America Natural Pulse Protein Revenue (USD Million) By Product (2021-2032)
Figure 40. Middle East and Africa Natural Pulse Protein Revenue (USD Million) By Type (2021-2032)
Figure 41. Middle East and Africa Natural Pulse Protein Revenue (USD Million) By Application (2021-2032)
Figure 42. Middle East and Africa Natural Pulse Protein Revenue (USD Million) By Product (2021-2032)
By Type
Beans
Chickpeas
Yellow Peas
Lentils
Others
By Application
Food & Beverage
Dietary Supplements
Others
Countries Analyzed
North America (US, Canada, Mexico)
Europe (Germany, UK, France, Spain, Italy, Russia, Rest of Europe)
Asia Pacific (China, India, Japan, South Korea, Australia, South East Asia, Rest of Asia)
South America (Brazil, Argentina, Rest of South America)
Middle East and Africa (Saudi Arabia, UAE, Rest of Middle East, South Africa, Egypt, Rest of Africa)
