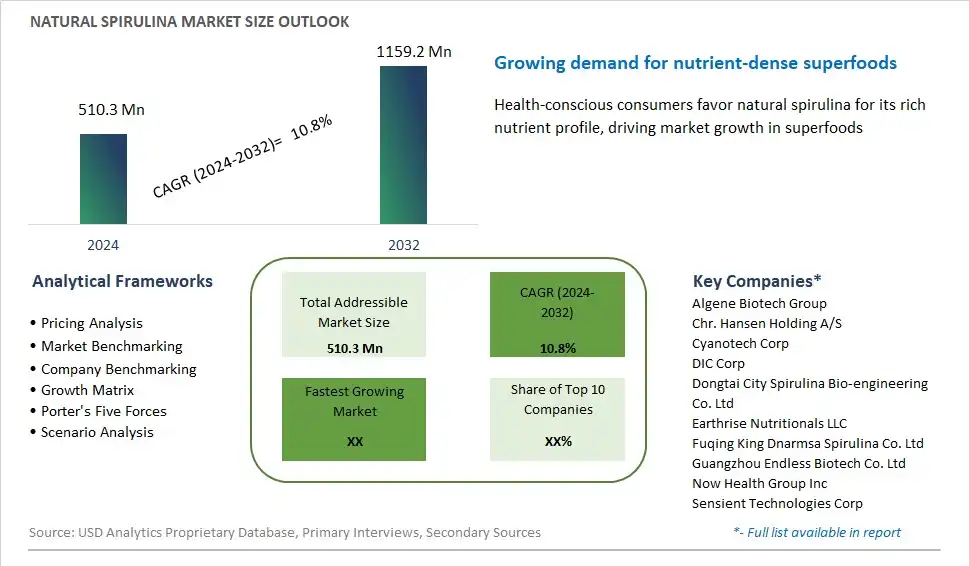
Global Natural Spirulina Market Size is valued at $510.3 Million in 2024 and is forecast to register a growth rate (CAGR) of 10.8% to reach $1159.2 Million by 2032.
The global Natural Spirulina Market Comprehensive Study analyzes and forecasts the market size across 6 regions and 24 countries for diverse segments -By Application (Food and Beverages, Nutraceuticals, Personal Care, Animal Feed), By Form (Powder, Tablets/Capsules), By Distribution Channel (Online, Offline)
An Introduction to Natural Spirulina Market
In 2024, the market for natural spirulina, a nutrient-rich cyanobacterium, is experiencing robust growth fueled by its reputation as a superfood and sustainable protein source. Spirulina's high protein content, essential amino acids, vitamins, and minerals make it a valuable ingredient in dietary supplements, functional foods, and plant-based alternatives. As consumers prioritize health and sustainability, spirulina's eco-friendly cultivation practices and low environmental footprint resonate with environmentally conscious consumers seeking ethical and nutritious food options. Moreover, ongoing research into spirulina's potential health benefits, including its immune-boosting properties, antioxidant activity, and role in managing metabolic disorders, is driving innovation and market adoption. With spirulina poised to play a pivotal role in addressing global food security and nutrition challenges, the market for natural spirulina is poised for sustained growth and diversification in the years ahead.
Natural Spirulina Competitive Landscape
The market report analyses the leading companies in the industry including Algene Biotech Group, Chr. Hansen Holding A/S, Cyanotech Corp, DIC Corp, Dongtai City Spirulina Bio-engineering Co. Ltd, Earthrise Nutritionals LLC, Fuqing King Dnarmsa Spirulina Co. Ltd, Guangzhou Endless Biotech Co. Ltd, Now Health Group Inc, Sensient Technologies Corp, and Others.
Natural Spirulina Market Dynamics
Natural Spirulina Market Trend: Increasing Demand for Plant-Based Superfoods
The market for natural spirulina is experiencing a significant upward trend due to the growing popularity of plant-based superfoods among health-conscious consumers. Spirulina, a type of blue-green algae, is renowned for its high nutritional content, including protein, vitamins, and antioxidants. As more consumers seek out nutritious and sustainable alternatives to animal products, spirulina has emerged as a sought-after ingredient in supplements, health foods, and functional beverages. This trend is driven by the perception of spirulina as a nutrient-dense superfood that offers various health benefits, including immune support, detoxification, and improved energy levels.
Market Driver: Rising Awareness of Health and Wellness Benefits
Increased awareness of the health and wellness benefits of natural spirulina is driving demand for this superfood in various consumer segments. Spirulina is known for its rich concentration of nutrients, including essential amino acids, vitamins, and minerals, making it a valuable addition to a healthy diet. As consumers become more proactive about their health and seek out natural solutions to support their well-being, there is a growing market for products containing spirulina as a key ingredient. This driver is fueling innovation in the development of spirulina-based products, including supplements, functional foods, and beverages, to meet the evolving needs and preferences of health-conscious consumers.
Market Opportunity: Diversification of Product Offerings and Applications
The market for natural spirulina presents significant opportunities for companies to diversify their product offerings and explore new applications in various industries. Beyond traditional supplements and health foods, spirulina has potential applications in cosmetics, animal feed, and aquaculture due to its nutrient-rich composition and sustainable production. Companies can capitalize on this opportunity by expanding their product portfolios to include spirulina-based ingredients and formulations tailored to different market segments. Additionally, partnerships with food manufacturers, cosmetics companies, and research institutions can facilitate the development of innovative products and technologies that leverage the unique properties of spirulina for enhanced health and sustainability. By tapping into new markets and applications, companies can unlock untapped growth potential in the natural spirulina market.
Natural Spirulina Market Share Analysis: Food and Beverages held the dominant market share in 2024
The "Food and Beverages" segment is the largest within the Natural Spirulina market, driven by the versatile applications and nutritional benefits of spirulina in the culinary and beverage industries. Spirulina, a nutrient-dense algae rich in protein, vitamins, and antioxidants, serves as a valuable ingredient in a wide range of food and beverage products, including health bars, smoothies, juices, and snacks. Its vibrant green color and neutral taste make it an ideal additive for enhancing the nutritional value and visual appeal of various food and beverage formulations. Further, as consumers increasingly prioritize plant-based and functional foods, spirulina's reputation as a superfood further bolsters its demand in the food and beverage sector. Additionally, spirulina's sustainable cultivation methods and eco-friendly profile align with the growing consumer preference for environmentally conscious products. With ongoing innovations and increasing consumer awareness of spirulina's health benefits, the food and beverages segment is expected to maintain its leading position in the Natural Spirulina market.
Natural Spirulina Market Share Analysis: Tablets/Capsules market is poised to register the fastest growth rae over the forecast period to 2032
The "Tablets/Capsules" segment is the fastest-growing within the Natural Spirulina market, driven by the increasing demand for convenient and portable nutritional supplements. Spirulina, renowned for its rich nutrient profile and numerous health benefits, is gaining popularity as a dietary supplement among health-conscious consumers seeking to bolster their overall well-being. Tablets and capsules offer a convenient and precise dosage of spirulina, making it easier for consumers to incorporate into their daily routines. Further, the compact and portable nature of tablets and capsules enhances their accessibility and on-the-go consumption, appealing to busy lifestyles. Additionally, the growing preference for plant-based and natural supplements further propels the demand for spirulina tablets and capsules as consumers seek clean label and sustainable options. With the rising awareness of spirulina's nutritional value and the convenience of tablets and capsules, this segment is poised to sustain its rapid growth trajectory, reshaping the landscape of the Natural Spirulina market.
Natural Spirulina Market Share Analysis: Online held the dominant market share in 2024
The "Online" segment is the largest within the Natural Spirulina market, driven by the convenience, accessibility, and expanding reach of e-commerce platforms. With the increasing prevalence of digitalization and the growing popularity of online shopping, consumers are increasingly turning to online channels to purchase health and wellness products like spirulina. Online platforms offer a diverse selection of spirulina products from various brands, allowing consumers to compare prices, read reviews, and make informed purchasing decisions from the comfort of their homes. Further, the ability to access a broader range of options, along with the convenience of doorstep delivery, contributes to the dominance of the online distribution channel. Additionally, the ongoing global health concerns, such as the COVID-19 pandemic, have further accelerated the shift towards online shopping as consumers prioritize safety and contactless transactions. With the continuous growth of e-commerce and the increasing demand for natural health supplements, the online segment is expected to maintain its leading position in the Natural Spirulina market.
Natural Spirulina Market Segmentation
By Application
Food and Beverages
Nutraceuticals
Personal Care
Animal Feed
By Form
Powder
Tablets/Capsules
By Distribution Channel
Online
Offline
Countries Analyzed
North America (US, Canada, Mexico)
Europe (Germany, UK, France, Spain, Italy, Russia, Rest of Europe)
Asia Pacific (China, India, Japan, South Korea, Australia, South East Asia, Rest of Asia)
South America (Brazil, Argentina, Rest of South America)
Middle East and Africa (Saudi Arabia, UAE, Rest of Middle East, South Africa, Egypt, Rest of Africa)
Natural Spirulina Companies Profiled in the Study
Algene Biotech Group
Chr. Hansen Holding A/S
Cyanotech Corp
DIC Corp
Dongtai City Spirulina Bio-engineering Co. Ltd
Earthrise Nutritionals LLC
Fuqing King Dnarmsa Spirulina Co. Ltd
Guangzhou Endless Biotech Co. Ltd
Now Health Group Inc
Sensient Technologies Corp
*- List Not Exhaustive
Chapter 1. TABLE OF CONTENTS
Chapter 2. Introduction to Natural Spirulina Market
2.1. Market Overview
2.2. Key Statistics and Report Highlights
2.3. Scope of the Comprehensive Study
2.3.1. Market Definition
2.3.2 Countries and Regions Covered
2.3.3 Research Objective
2.3.4 Units, Currency, and Conversions
2.3.5 Industry Value Chain
2.4. Key Market Segments
2.5. Key Companies
2.6. Study Period
Chapter 3. Strategic Analysis Review
3.1. Natural Spirulina Pricing Analysis and Forecast
3.2. Porter’s Five Forces
3.3. Market Ecosystem
3.4. SWOT Analysis
3.5. Regulatory Scenario
3.3. Effects of Inflation, Russia-Ukraine War, moderating economic growth, and other macroeconomic factors
Chapter 4. Competitive Landscape
4.1. Market Share Analysis
4.1.1. Global Natural Spirulina Market Share by Company, 2023
4.1.2. Product Offerings of Leading Natural Spirulina Companies
4.2. Market Entropy
4.2.1. New Product Launches in the Industry
4.2.2. Mergers, Acquisitions, Joint ventures, and Partnerships
4.3. Key Strategies and Best Practices
Chapter 5. Global Market Projections: Best, Reference, and Low Case Scenarios
5.1. Growth Analysis- Case Scenario Definitions
5.2. Low Growth Case Scenario Forecasts
5.3. Reference Growth Case Scenario Forecasts
5.4. High Growth Case Scenario Forecasts
Chapter 6. Market Dynamics
6.1. Natural Spirulina Market Drivers
6.2. Natural Spirulina Market Challenges
6.6. Natural Spirulina Market Opportunities
6.4. Natural Spirulina Market Trends
Chapter 7. Global Natural Spirulina Market Outlook Trends
7.1. Global Natural Spirulina Revenue (USD Million) and CAGR (%) by Type (2021-2032)
7.2. Global Natural Spirulina Revenue (USD Million) and CAGR (%) by Application (2021-2032)
7.3. Global Natural Spirulina Revenue (USD Million) and CAGR (%) by Product (2021-2032)
By Application
Food and Beverages
Nutraceuticals
Personal Care
Animal Feed
By Form
Powder
Tablets/Capsules
By Distribution Channel
Online
Offline
Chapter 8. Global Natural Spirulina Regional Analysis and Outlook
8.1. Global Natural Spirulina Revenue (USD Million) By Regions (2021- 2032)
8.2. North America Natural Spirulina Revenue (USD Million) by Country (2021-2032)
8.2.1. United States Natural Spirulina Regional Analysis and Outlook
8.2.2. Canada Natural Spirulina Regional Analysis and Outlook
8.2.3. Mexico Natural Spirulina Regional Analysis and Outlook
8.3. Europe Natural Spirulina Revenue (USD Million), by Country (2021-2032)
8.3.1. Germany Natural Spirulina Regional Analysis and Outlook
8.3.2. France Natural Spirulina Regional Analysis and Outlook
8.3.3. United Kingdom Natural Spirulina Regional Analysis and Outlook
8.3.4. Spain Natural Spirulina Regional Analysis and Outlook
8.3.5. Italy Natural Spirulina Regional Analysis and Outlook
8.3.6. Russia Natural Spirulina Regional Analysis and Outlook
8.3.7. Rest of Europe Natural Spirulina Regional Analysis and Outlook
8.4. Asia Pacific Natural Spirulina Revenue (USD Million) by Country (2021-2032)
8.4.1. China Natural Spirulina Regional Analysis and Outlook
8.4.2. Japan Natural Spirulina Regional Analysis and Outlook
8.4.3. India Natural Spirulina Regional Analysis and Outlook
8.4.4. South Korea Natural Spirulina Regional Analysis and Outlook
8.4.5. Australia Natural Spirulina Regional Analysis and Outlook
8.4.6. South East Asia Natural Spirulina Regional Analysis and Outlook
8.4.7. Rest of Asia Pacific Natural Spirulina Regional Analysis and Outlook
8.5. South America Natural Spirulina Revenue (USD Million), by Country (2021-2032)
8.5.1. Brazil Natural Spirulina Regional Analysis and Outlook
8.5.2. Argentina Natural Spirulina Regional Analysis and Outlook
8.5.3. Rest of South America Natural Spirulina Regional Analysis and Outlook
8.6. Middle East and Africa Natural Spirulina Revenue (USD Million) by Country (2021-2032)
8.6.1. Middle East Natural Spirulina Regional Analysis and Outlook
8.6.2. Africa Natural Spirulina Regional Analysis and Outlook
Chapter 9. North America Natural Spirulina Analysis and Outlook
9.1. North America Natural Spirulina Revenue (USD Million) by Segments (2021-2032)
9.1.1. North America Natural Spirulina Revenue (USD Million) by Type (2021-2032)
9.1.2. North America Natural Spirulina Revenue (USD Million) by Application (2021-2032)
9.1.3. North America Natural Spirulina Revenue (USD Million) by Product (2021-2032)
By Application
Food and Beverages
Nutraceuticals
Personal Care
Animal Feed
By Form
Powder
Tablets/Capsules
By Distribution Channel
Online
Offline
Chapter 10. Europe Natural Spirulina Analysis and Outlook
10.1. Europe Natural Spirulina Revenue (USD Million), by Segments (USD Million) (2021-2032)
10.1.1. Europe Natural Spirulina Revenue (USD Million) by Type (2021-2032)
10.1.2. Europe Natural Spirulina Revenue (USD Million) by Application (2021-2032)
10.1.3. Europe Natural Spirulina Revenue (USD Million) by Product (2021-2032)
By Application
Food and Beverages
Nutraceuticals
Personal Care
Animal Feed
By Form
Powder
Tablets/Capsules
By Distribution Channel
Online
Offline
Chapter 11. Asia Pacific Natural Spirulina Analysis and Outlook
11.1. Asia Pacific Natural Spirulina Revenue (USD Million), and Revenue (USD Million) by Segments (2021-2032)
11.1.1. Asia Pacific Natural Spirulina Revenue (USD Million) by Type (2021-2032)
11.1.2. Asia Pacific Natural Spirulina Revenue (USD Million) by Application (2021-2032)
11.1.3. Asia Pacific Natural Spirulina Revenue (USD Million) by Product (2021-2032)
By Application
Food and Beverages
Nutraceuticals
Personal Care
Animal Feed
By Form
Powder
Tablets/Capsules
By Distribution Channel
Online
Offline
Chapter 12. South America Natural Spirulina Analysis and Outlook
12.1. South America Natural Spirulina Revenue (USD Million), by Segments (2021-2032)
12.1.1. South America Natural Spirulina Revenue (USD Million) by Type (2021-2032)
12.1.2. South America Natural Spirulina Revenue (USD Million) by Application (2021-2032)
12.1.3. South America Natural Spirulina Revenue (USD Million) by Product (2021-2032)
By Application
Food and Beverages
Nutraceuticals
Personal Care
Animal Feed
By Form
Powder
Tablets/Capsules
By Distribution Channel
Online
Offline
Chapter 13. Middle East and Africa Natural Spirulina Analysis and Outlook
13.1. Middle East and Africa Natural Spirulina Revenue (USD Million), by Segments (2021-2032)
13.1.1. Middle East and Africa Natural Spirulina Revenue (USD Million) by Type (2021-2032)
13.1.2. Middle East and Africa Natural Spirulina Revenue (USD Million) by Application (2021-2032)
13.1.3. Middle East and Africa Natural Spirulina Revenue (USD Million) by Product (2021-2032)
By Application
Food and Beverages
Nutraceuticals
Personal Care
Animal Feed
By Form
Powder
Tablets/Capsules
By Distribution Channel
Online
Offline
Chapter 14. Natural Spirulina Company Profiles
14.1 Business Overview
14.2 Product Profiles
14.3 SWOT Profiles
14.5 Recent Developments
14.6 Financial Profile
List of Companies
Algene Biotech Group
Chr. Hansen Holding A/S
Cyanotech Corp
DIC Corp
Dongtai City Spirulina Bio-engineering Co. Ltd
Earthrise Nutritionals LLC
Fuqing King Dnarmsa Spirulina Co. Ltd
Guangzhou Endless Biotech Co. Ltd
Now Health Group Inc
Sensient Technologies Corp
15. Methodology and Data Sources
15.1 Customization Offerings
15.2 Subscription Services
15.3 Related Reports
15.4 Publisher Expertise
LIST OF TABLES
Table 1 Market Segmentation Analysis
Table 2 Global Natural Spirulina Market Share of Leading Companies, 2023
Table 3 Product Offerings of Leading Companies
Table 4 Low Growth Scenario Forecasts
Table 5 Reference Case Growth Scenario
Table 6 High Growth Case Scenario
Table 7 Global Natural Spirulina Revenue (USD Million) And CAGR (%) By Type (2021-2032)
Table 8 Global Natural Spirulina Revenue (USD Million) And CAGR (%) By Application (2021-2032)
Table 9 Global Natural Spirulina Revenue (USD Million) And CAGR (%) By Product (2021-2032)
Table 10 Global Natural Spirulina Market Revenue (USD Million) By Regions (2021-2032)
Table 11 Global Natural Spirulina Market Share (%) By Regions (2021-2032)
Table 12 North America Natural Spirulina Revenue (USD Million) By Country (2021-2032)
Table 13 Europe Natural Spirulina Revenue (USD Million) By Country (2021-2032)
Table 14 Asia Pacific Natural Spirulina Revenue (USD Million) By Country (2021-2032)
Table 15 South America Natural Spirulina Revenue (USD Million) By Country (2021-2032)
Table 16 Middle East and Africa Natural Spirulina Revenue (USD Million) By Region (2021-2032)
Table 17 North America Natural Spirulina Revenue (USD Million) By Type (2021-2032)
Table 18 North America Natural Spirulina Revenue (USD Million) By Application (2021-2032)
Table 19 North America Natural Spirulina Revenue (USD Million) By Product (2021-2032)
Table 20 Europe Natural Spirulina Revenue (USD Million) By Type (2021-2032)
Table 21 Europe Natural Spirulina Revenue (USD Million) By Application (2021-2032)
Table 22 Europe Natural Spirulina Revenue (USD Million) By Product (2021-2032)
Table 23 Asia Pacific Natural Spirulina Revenue (USD Million) By Type (2021-2032)
Table 24 Asia Pacific Natural Spirulina Revenue (USD Million) By Application (2021-2032)
Table 25 Asia Pacific Natural Spirulina Revenue (USD Million) By Product (2021-2032)
Table 26 South America Natural Spirulina Revenue (USD Million) By Type (2021-2032)
Table 27 South America Natural Spirulina Revenue (USD Million) By Application (2021-2032)
Table 28 South America Natural Spirulina Revenue (USD Million) By Product (2021-2032)
Table 29 Middle East and Africa Natural Spirulina Revenue (USD Million) By Type (2021-2032)
Table 30 Middle East and Africa Natural Spirulina Revenue (USD Million) By Application (2021-2032)
Table 31 Middle East and Africa Natural Spirulina Revenue (USD Million) By Product (2021-2032)
LIST OF FIGURES
Figure 1. Market Scope
Figure 2. Pricing Forecasts Per Unit, 2023- 2032
Figure 3. Porter’s Five Forces
Figure 4. Global Natural Spirulina Market Revenue (USD Million) By Regions (2021-2032)
Figure 5. Global Natural Spirulina Market Share (%) By Regions (2023)
Figure 6. North America Natural Spirulina Revenue (USD Million) By Country (2021-2032)
Figure 7. United States Natural Spirulina Revenue (USD Million) By Country (2021-2032)
Figure 8. Canada Natural Spirulina Revenue (USD Million) By Country (2021-2032)
Figure 9. Mexico Natural Spirulina Revenue (USD Million) By Country (2021-2032)
Figure 10. Europe Natural Spirulina Revenue (USD Million) By Country (2021-2032)
Figure 11. Germany Natural Spirulina Revenue (USD Million) By Country (2021-2032)
Figure 12. France Natural Spirulina Revenue (USD Million) By Country (2021-2032)
Figure 13. United Kingdom Natural Spirulina Revenue (USD Million) By Country (2021-2032)
Figure 14. Spain Natural Spirulina Revenue (USD Million) By Country (2021-2032)
Figure 15. Italy Natural Spirulina Revenue (USD Million) By Country (2021-2032)
Figure 16. Russia Natural Spirulina Revenue (USD Million) By Country (2021-2032)
Figure 17. Rest of Europe Natural Spirulina Revenue (USD Million) By Country (2021-2032)
Figure 11. Asia Pacific Natural Spirulina Revenue (USD Million) By Country (2021-2032)
Figure 12. China Natural Spirulina Revenue (USD Million) By Country (2021-2032)
Figure 13. Japan Natural Spirulina Revenue (USD Million) By Country (2021-2032)
Figure 14. India Natural Spirulina Revenue (USD Million) By Country (2021-2032)
Figure 15. South Korea Natural Spirulina Revenue (USD Million) By Country (2021-2032)
Figure 16. Australia Natural Spirulina Revenue (USD Million) By Country (2021-2032)
Figure 17. South East Asia Natural Spirulina Revenue (USD Million) By Country (2021-2032)
Figure 18. South America Natural Spirulina Revenue (USD Million) By Country (2021-2032)
Figure 19. Brazil Natural Spirulina Revenue (USD Million) By Country (2021-2032)
Figure 20. Argentina Natural Spirulina Revenue (USD Million) By Country (2021-2032)
Figure 21. Rest of Asia Pacific Natural Spirulina Revenue (USD Million) By Country (2021-2032)
Figure 22. Middle East and Africa Natural Spirulina Revenue (USD Million) By Region (2021-2032)
Figure 23. Saudi Arabia Natural Spirulina Revenue (USD Million) By Region (2021-2032)
Figure 24. The UAE Natural Spirulina Revenue (USD Million) By Region (2021-2032)
Figure 25. Rest of Middle East Natural Spirulina Revenue (USD Million) By Region (2021-2032)
Figure 26. South Africa Natural Spirulina Revenue (USD Million) By Region (2021-2032)
Figure 27. Africa Natural Spirulina Revenue (USD Million) By Region (2021-2032)
Figure 28. North America Natural Spirulina Revenue (USD Million) By Type (2021-2032)
Figure 29. North America Natural Spirulina Revenue (USD Million) By Application (2021-2032)
Figure 30. North America Natural Spirulina Revenue (USD Million) By Product (2021-2032)
Figure 31. Europe Natural Spirulina Revenue (USD Million) By Type (2021-2032)
Figure 32. Europe Natural Spirulina Revenue (USD Million) By Application (2021-2032)
Figure 33. Europe Natural Spirulina Revenue (USD Million) By Product (2021-2032)
Figure 34. Asia Pacific Natural Spirulina Revenue (USD Million) By Type (2021-2032)
Figure 35. Asia Pacific Natural Spirulina Revenue (USD Million) By Application (2021-2032)
Figure 36. Asia Pacific Natural Spirulina Revenue (USD Million) By Product (2021-2032)
Figure 37. South America Natural Spirulina Revenue (USD Million) By Type (2021-2032)
Figure 38. South America Natural Spirulina Revenue (USD Million) By Application (2021-2032)
Figure 39. South America Natural Spirulina Revenue (USD Million) By Product (2021-2032)
Figure 40. Middle East and Africa Natural Spirulina Revenue (USD Million) By Type (2021-2032)
Figure 41. Middle East and Africa Natural Spirulina Revenue (USD Million) By Application (2021-2032)
Figure 42. Middle East and Africa Natural Spirulina Revenue (USD Million) By Product (2021-2032)
By Application
Food and Beverages
Nutraceuticals
Personal Care
Animal Feed
By Form
Powder
Tablets/Capsules
By Distribution Channel
Online
Offline
Countries Analyzed
North America (US, Canada, Mexico)
Europe (Germany, UK, France, Spain, Italy, Russia, Rest of Europe)
Asia Pacific (China, India, Japan, South Korea, Australia, South East Asia, Rest of Asia)
South America (Brazil, Argentina, Rest of South America)
Middle East and Africa (Saudi Arabia, UAE, Rest of Middle East, South Africa, Egypt, Rest of Africa)
