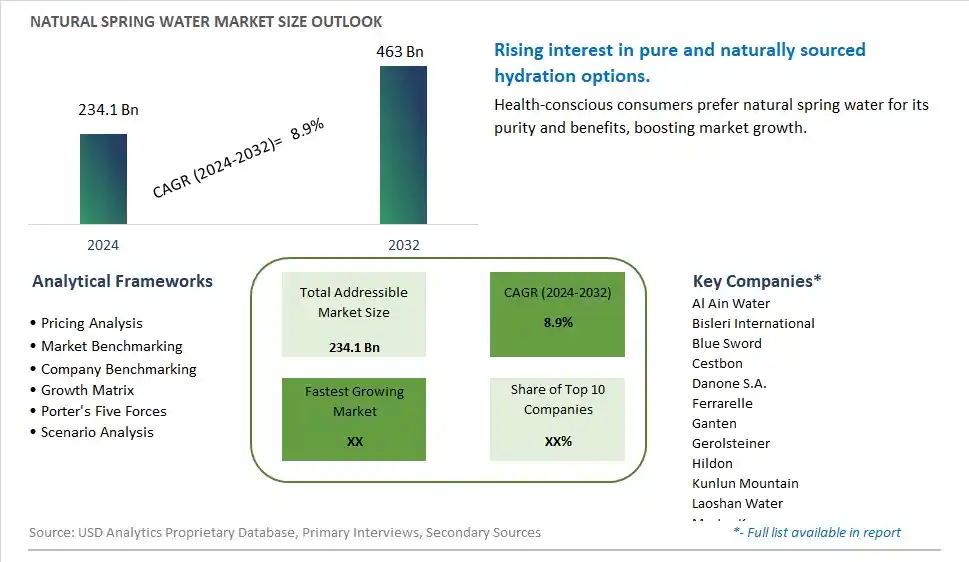
Global Natural Spring Water Market Size is valued at $234.1 Billion in 2024 and is forecast to register a growth rate (CAGR) of 8.9% to reach $463 Billion by 2032.
The global Natural Spring Water Market Comprehensive Study analyzes and forecasts the market size across 6 regions and 24 countries for diverse segments -By Type (Low Mineralized (<500mg/L), Medium Mineralized (500-1500mg/L), Highly Mineralized (>1500mg/L)), By Application (Supermarkets/Hypermarkets, Convenience Stores, Grocery Stores, Online Retail, Others)
An Introduction to Natural Spring Water Market
The Natural Spring Water Market involves the production and sale of bottled water sourced from natural springs, catering to consumers seeking pure and high-quality hydration options. The market is driven by increasing health consciousness, rising demand for natural and unprocessed beverages, and growing awareness about the benefits of natural spring water. Additionally, advancements in bottling technologies and the expansion of distribution channels support market growth.
Natural Spring Water Competitive Landscape
The market report analyses the leading companies in the industry including Al Ain Water, Bisleri International, Blue Sword, Cestbon, Danone S.A., Ferrarelle, Ganten, Gerolsteiner, Hildon, Kunlun Mountain, Laoshan Water, Master Kong, Nestlé SA, NEVIOT, Nongfu Spring, Rayyan Mineral Water Co, Suntory Water Group, The Coca-Cola Company, Tynant, Wahaha, and Others.
Natural Spring Water Market Dynamics
Natural Spring Water Market Trend: Increasing Demand for Premium and Natural Spring Waters
The most prominent trend in the Natural Spring Water Market is the increasing demand for premium and natural spring waters. Consumers are seeking bottled waters that offer natural purity and a refreshing taste, driven by the desire for healthier and more hydrating beverage options.
Natural Spring Water Market Driver: Health Consciousness and Preference for Natural Products
A key driver in the Natural Spring Water Market is health consciousness and the preference for natural products. As more individuals focus on staying hydrated and improving their overall health, there is a rising demand for natural spring water that provides essential minerals and supports well-being, supporting market growth.
Natural Spring Water Market Opportunity: Innovation in Functional and Flavored Waters
One significant opportunity in the Natural Spring Water Market lies in the expansion into functional and flavored waters. Companies can innovate by creating natural spring water products that incorporate additional health benefits, such as added electrolytes, vitamins, and natural flavors, offering consumers a variety of tasty and nutritious hydration options, driving market growth.
Natural Spring Water Market Share Analysis- Largest Segment by Type
In the Natural Spring Water Market, the Medium Mineralized (500-1500mg/L) type is the largest segment. Medium mineralized spring water is preferred for its balanced mineral content, which provides a desirable taste and potential health benefits without being too high in minerals. This type of spring water offers a compromise between the subtle flavor of low mineralized water and the robust taste of highly mineralized water. Its broad appeal to consumers and its versatility in both still and sparkling water formats contribute to its dominance in the market.
Natural Spring Water Market Share Analysis- Fastest Growing Segment by Application
The Online Retail application segment is poised to grow the fastest in the Natural Spring Water Market over the next five years. The rise of e-commerce and direct-to-consumer sales channels has significantly impacted the natural spring water market. Consumers are increasingly purchasing bottled water online due to the convenience of home delivery and the ability to access a wider range of products. Additionally, online retailers offer subscription services and bulk purchasing options, which are becoming more popular as consumers seek ease of access and better value. This shift towards online purchasing is driving rapid growth in this segment.
Natural Spring Water Market Segmentation
By Type
Low Mineralized (<500mg/L)
Medium Mineralized (500-1500mg/L)
Highly Mineralized (>1500mg/L)
By Application
Supermarkets/Hypermarkets
Convenience Stores
Grocery Stores
Online Retail
Others
Countries Analyzed
North America (US, Canada, Mexico)
Europe (Germany, UK, France, Spain, Italy, Russia, Rest of Europe)
Asia Pacific (China, India, Japan, South Korea, Australia, South East Asia, Rest of Asia)
South America (Brazil, Argentina, Rest of South America)
Middle East and Africa (Saudi Arabia, UAE, Rest of Middle East, South Africa, Egypt, Rest of Africa)
Natural Spring Water Companies Profiled in the Study
Al Ain Water
Bisleri International
Blue Sword
Cestbon
Danone S.A.
Ferrarelle
Ganten
Gerolsteiner
Hildon
Kunlun Mountain
Laoshan Water
Master Kong
Nestlé SA
NEVIOT
Nongfu Spring
Rayyan Mineral Water Co
Suntory Water Group
The Coca-Cola Company
Tynant
Wahaha
*- List Not Exhaustive
Chapter 1. TABLE OF CONTENTS
Chapter 2. Introduction to Natural Spring Water Market
2.1. Market Overview
2.2. Key Statistics and Report Highlights
2.3. Scope of the Comprehensive Study
2.3.1. Market Definition
2.3.2 Countries and Regions Covered
2.3.3 Research Objective
2.3.4 Units, Currency, and Conversions
2.3.5 Industry Value Chain
2.4. Key Market Segments
2.5. Key Companies
2.6. Study Period
Chapter 3. Strategic Analysis Review
3.1. Natural Spring Water Pricing Analysis and Forecast
3.2. Porter’s Five Forces
3.3. Market Ecosystem
3.4. SWOT Analysis
3.5. Regulatory Scenario
3.3. Effects of Inflation, Russia-Ukraine War, moderating economic growth, and other macroeconomic factors
Chapter 4. Competitive Landscape
4.1. Market Share Analysis
4.1.1. Global Natural Spring Water Market Share by Company, 2023
4.1.2. Product Offerings of Leading Natural Spring Water Companies
4.2. Market Entropy
4.2.1. New Product Launches in the Industry
4.2.2. Mergers, Acquisitions, Joint ventures, and Partnerships
4.3. Key Strategies and Best Practices
Chapter 5. Global Market Projections: Best, Reference, and Low Case Scenarios
5.1. Growth Analysis- Case Scenario Definitions
5.2. Low Growth Case Scenario Forecasts
5.3. Reference Growth Case Scenario Forecasts
5.4. High Growth Case Scenario Forecasts
Chapter 6. Market Dynamics
6.1. Natural Spring Water Market Drivers
6.2. Natural Spring Water Market Challenges
6.6. Natural Spring Water Market Opportunities
6.4. Natural Spring Water Market Trends
Chapter 7. Global Natural Spring Water Market Outlook Trends
7.1. Global Natural Spring Water Revenue (USD Million) and CAGR (%) by Type (2021-2032)
7.2. Global Natural Spring Water Revenue (USD Million) and CAGR (%) by Application (2021-2032)
7.3. Global Natural Spring Water Revenue (USD Million) and CAGR (%) by Product (2021-2032)
By Type
Low Mineralized (<500mg/L)
Medium Mineralized (500-1500mg/L)
Highly Mineralized (>1500mg/L)
By Application
Supermarkets/Hypermarkets
Convenience Stores
Grocery Stores
Online Retail
Others
Chapter 8. Global Natural Spring Water Regional Analysis and Outlook
8.1. Global Natural Spring Water Revenue (USD Million) By Regions (2021- 2032)
8.2. North America Natural Spring Water Revenue (USD Million) by Country (2021-2032)
8.2.1. United States Natural Spring Water Regional Analysis and Outlook
8.2.2. Canada Natural Spring Water Regional Analysis and Outlook
8.2.3. Mexico Natural Spring Water Regional Analysis and Outlook
8.3. Europe Natural Spring Water Revenue (USD Million), by Country (2021-2032)
8.3.1. Germany Natural Spring Water Regional Analysis and Outlook
8.3.2. France Natural Spring Water Regional Analysis and Outlook
8.3.3. United Kingdom Natural Spring Water Regional Analysis and Outlook
8.3.4. Spain Natural Spring Water Regional Analysis and Outlook
8.3.5. Italy Natural Spring Water Regional Analysis and Outlook
8.3.6. Russia Natural Spring Water Regional Analysis and Outlook
8.3.7. Rest of Europe Natural Spring Water Regional Analysis and Outlook
8.4. Asia Pacific Natural Spring Water Revenue (USD Million) by Country (2021-2032)
8.4.1. China Natural Spring Water Regional Analysis and Outlook
8.4.2. Japan Natural Spring Water Regional Analysis and Outlook
8.4.3. India Natural Spring Water Regional Analysis and Outlook
8.4.4. South Korea Natural Spring Water Regional Analysis and Outlook
8.4.5. Australia Natural Spring Water Regional Analysis and Outlook
8.4.6. South East Asia Natural Spring Water Regional Analysis and Outlook
8.4.7. Rest of Asia Pacific Natural Spring Water Regional Analysis and Outlook
8.5. South America Natural Spring Water Revenue (USD Million), by Country (2021-2032)
8.5.1. Brazil Natural Spring Water Regional Analysis and Outlook
8.5.2. Argentina Natural Spring Water Regional Analysis and Outlook
8.5.3. Rest of South America Natural Spring Water Regional Analysis and Outlook
8.6. Middle East and Africa Natural Spring Water Revenue (USD Million) by Country (2021-2032)
8.6.1. Middle East Natural Spring Water Regional Analysis and Outlook
8.6.2. Africa Natural Spring Water Regional Analysis and Outlook
Chapter 9. North America Natural Spring Water Analysis and Outlook
9.1. North America Natural Spring Water Revenue (USD Million) by Segments (2021-2032)
9.1.1. North America Natural Spring Water Revenue (USD Million) by Type (2021-2032)
9.1.2. North America Natural Spring Water Revenue (USD Million) by Application (2021-2032)
9.1.3. North America Natural Spring Water Revenue (USD Million) by Product (2021-2032)
By Type
Low Mineralized (<500mg/L)
Medium Mineralized (500-1500mg/L)
Highly Mineralized (>1500mg/L)
By Application
Supermarkets/Hypermarkets
Convenience Stores
Grocery Stores
Online Retail
Others
Chapter 10. Europe Natural Spring Water Analysis and Outlook
10.1. Europe Natural Spring Water Revenue (USD Million), by Segments (USD Million) (2021-2032)
10.1.1. Europe Natural Spring Water Revenue (USD Million) by Type (2021-2032)
10.1.2. Europe Natural Spring Water Revenue (USD Million) by Application (2021-2032)
10.1.3. Europe Natural Spring Water Revenue (USD Million) by Product (2021-2032)
By Type
Low Mineralized (<500mg/L)
Medium Mineralized (500-1500mg/L)
Highly Mineralized (>1500mg/L)
By Application
Supermarkets/Hypermarkets
Convenience Stores
Grocery Stores
Online Retail
Others
Chapter 11. Asia Pacific Natural Spring Water Analysis and Outlook
11.1. Asia Pacific Natural Spring Water Revenue (USD Million), and Revenue (USD Million) by Segments (2021-2032)
11.1.1. Asia Pacific Natural Spring Water Revenue (USD Million) by Type (2021-2032)
11.1.2. Asia Pacific Natural Spring Water Revenue (USD Million) by Application (2021-2032)
11.1.3. Asia Pacific Natural Spring Water Revenue (USD Million) by Product (2021-2032)
By Type
Low Mineralized (<500mg/L)
Medium Mineralized (500-1500mg/L)
Highly Mineralized (>1500mg/L)
By Application
Supermarkets/Hypermarkets
Convenience Stores
Grocery Stores
Online Retail
Others
Chapter 12. South America Natural Spring Water Analysis and Outlook
12.1. South America Natural Spring Water Revenue (USD Million), by Segments (2021-2032)
12.1.1. South America Natural Spring Water Revenue (USD Million) by Type (2021-2032)
12.1.2. South America Natural Spring Water Revenue (USD Million) by Application (2021-2032)
12.1.3. South America Natural Spring Water Revenue (USD Million) by Product (2021-2032)
By Type
Low Mineralized (<500mg/L)
Medium Mineralized (500-1500mg/L)
Highly Mineralized (>1500mg/L)
By Application
Supermarkets/Hypermarkets
Convenience Stores
Grocery Stores
Online Retail
Others
Chapter 13. Middle East and Africa Natural Spring Water Analysis and Outlook
13.1. Middle East and Africa Natural Spring Water Revenue (USD Million), by Segments (2021-2032)
13.1.1. Middle East and Africa Natural Spring Water Revenue (USD Million) by Type (2021-2032)
13.1.2. Middle East and Africa Natural Spring Water Revenue (USD Million) by Application (2021-2032)
13.1.3. Middle East and Africa Natural Spring Water Revenue (USD Million) by Product (2021-2032)
By Type
Low Mineralized (<500mg/L)
Medium Mineralized (500-1500mg/L)
Highly Mineralized (>1500mg/L)
By Application
Supermarkets/Hypermarkets
Convenience Stores
Grocery Stores
Online Retail
Others
Chapter 14. Natural Spring Water Company Profiles
14.1 Business Overview
14.2 Product Profiles
14.3 SWOT Profiles
14.5 Recent Developments
14.6 Financial Profile
List of Companies
Al Ain Water
Bisleri International
Blue Sword
Cestbon
Danone S.A.
Ferrarelle
Ganten
Gerolsteiner
Hildon
Kunlun Mountain
Laoshan Water
Master Kong
Nestlé SA
NEVIOT
Nongfu Spring
Rayyan Mineral Water Co
Suntory Water Group
The Coca-Cola Company
Tynant
Wahaha
15. Methodology and Data Sources
15.1 Customization Offerings
15.2 Subscription Services
15.3 Related Reports
15.4 Publisher Expertise
LIST OF TABLES
Table 1 Market Segmentation Analysis
Table 2 Global Natural Spring Water Market Share of Leading Companies, 2023
Table 3 Product Offerings of Leading Companies
Table 4 Low Growth Scenario Forecasts
Table 5 Reference Case Growth Scenario
Table 6 High Growth Case Scenario
Table 7 Global Natural Spring Water Revenue (USD Million) And CAGR (%) By Type (2021-2032)
Table 8 Global Natural Spring Water Revenue (USD Million) And CAGR (%) By Application (2021-2032)
Table 9 Global Natural Spring Water Revenue (USD Million) And CAGR (%) By Product (2021-2032)
Table 10 Global Natural Spring Water Market Revenue (USD Million) By Regions (2021-2032)
Table 11 Global Natural Spring Water Market Share (%) By Regions (2021-2032)
Table 12 North America Natural Spring Water Revenue (USD Million) By Country (2021-2032)
Table 13 Europe Natural Spring Water Revenue (USD Million) By Country (2021-2032)
Table 14 Asia Pacific Natural Spring Water Revenue (USD Million) By Country (2021-2032)
Table 15 South America Natural Spring Water Revenue (USD Million) By Country (2021-2032)
Table 16 Middle East and Africa Natural Spring Water Revenue (USD Million) By Region (2021-2032)
Table 17 North America Natural Spring Water Revenue (USD Million) By Type (2021-2032)
Table 18 North America Natural Spring Water Revenue (USD Million) By Application (2021-2032)
Table 19 North America Natural Spring Water Revenue (USD Million) By Product (2021-2032)
Table 20 Europe Natural Spring Water Revenue (USD Million) By Type (2021-2032)
Table 21 Europe Natural Spring Water Revenue (USD Million) By Application (2021-2032)
Table 22 Europe Natural Spring Water Revenue (USD Million) By Product (2021-2032)
Table 23 Asia Pacific Natural Spring Water Revenue (USD Million) By Type (2021-2032)
Table 24 Asia Pacific Natural Spring Water Revenue (USD Million) By Application (2021-2032)
Table 25 Asia Pacific Natural Spring Water Revenue (USD Million) By Product (2021-2032)
Table 26 South America Natural Spring Water Revenue (USD Million) By Type (2021-2032)
Table 27 South America Natural Spring Water Revenue (USD Million) By Application (2021-2032)
Table 28 South America Natural Spring Water Revenue (USD Million) By Product (2021-2032)
Table 29 Middle East and Africa Natural Spring Water Revenue (USD Million) By Type (2021-2032)
Table 30 Middle East and Africa Natural Spring Water Revenue (USD Million) By Application (2021-2032)
Table 31 Middle East and Africa Natural Spring Water Revenue (USD Million) By Product (2021-2032)
LIST OF FIGURES
Figure 1. Market Scope
Figure 2. Pricing Forecasts Per Unit, 2023- 2032
Figure 3. Porter’s Five Forces
Figure 4. Global Natural Spring Water Market Revenue (USD Million) By Regions (2021-2032)
Figure 5. Global Natural Spring Water Market Share (%) By Regions (2023)
Figure 6. North America Natural Spring Water Revenue (USD Million) By Country (2021-2032)
Figure 7. United States Natural Spring Water Revenue (USD Million) By Country (2021-2032)
Figure 8. Canada Natural Spring Water Revenue (USD Million) By Country (2021-2032)
Figure 9. Mexico Natural Spring Water Revenue (USD Million) By Country (2021-2032)
Figure 10. Europe Natural Spring Water Revenue (USD Million) By Country (2021-2032)
Figure 11. Germany Natural Spring Water Revenue (USD Million) By Country (2021-2032)
Figure 12. France Natural Spring Water Revenue (USD Million) By Country (2021-2032)
Figure 13. United Kingdom Natural Spring Water Revenue (USD Million) By Country (2021-2032)
Figure 14. Spain Natural Spring Water Revenue (USD Million) By Country (2021-2032)
Figure 15. Italy Natural Spring Water Revenue (USD Million) By Country (2021-2032)
Figure 16. Russia Natural Spring Water Revenue (USD Million) By Country (2021-2032)
Figure 17. Rest of Europe Natural Spring Water Revenue (USD Million) By Country (2021-2032)
Figure 11. Asia Pacific Natural Spring Water Revenue (USD Million) By Country (2021-2032)
Figure 12. China Natural Spring Water Revenue (USD Million) By Country (2021-2032)
Figure 13. Japan Natural Spring Water Revenue (USD Million) By Country (2021-2032)
Figure 14. India Natural Spring Water Revenue (USD Million) By Country (2021-2032)
Figure 15. South Korea Natural Spring Water Revenue (USD Million) By Country (2021-2032)
Figure 16. Australia Natural Spring Water Revenue (USD Million) By Country (2021-2032)
Figure 17. South East Asia Natural Spring Water Revenue (USD Million) By Country (2021-2032)
Figure 18. South America Natural Spring Water Revenue (USD Million) By Country (2021-2032)
Figure 19. Brazil Natural Spring Water Revenue (USD Million) By Country (2021-2032)
Figure 20. Argentina Natural Spring Water Revenue (USD Million) By Country (2021-2032)
Figure 21. Rest of Asia Pacific Natural Spring Water Revenue (USD Million) By Country (2021-2032)
Figure 22. Middle East and Africa Natural Spring Water Revenue (USD Million) By Region (2021-2032)
Figure 23. Saudi Arabia Natural Spring Water Revenue (USD Million) By Region (2021-2032)
Figure 24. The UAE Natural Spring Water Revenue (USD Million) By Region (2021-2032)
Figure 25. Rest of Middle East Natural Spring Water Revenue (USD Million) By Region (2021-2032)
Figure 26. South Africa Natural Spring Water Revenue (USD Million) By Region (2021-2032)
Figure 27. Africa Natural Spring Water Revenue (USD Million) By Region (2021-2032)
Figure 28. North America Natural Spring Water Revenue (USD Million) By Type (2021-2032)
Figure 29. North America Natural Spring Water Revenue (USD Million) By Application (2021-2032)
Figure 30. North America Natural Spring Water Revenue (USD Million) By Product (2021-2032)
Figure 31. Europe Natural Spring Water Revenue (USD Million) By Type (2021-2032)
Figure 32. Europe Natural Spring Water Revenue (USD Million) By Application (2021-2032)
Figure 33. Europe Natural Spring Water Revenue (USD Million) By Product (2021-2032)
Figure 34. Asia Pacific Natural Spring Water Revenue (USD Million) By Type (2021-2032)
Figure 35. Asia Pacific Natural Spring Water Revenue (USD Million) By Application (2021-2032)
Figure 36. Asia Pacific Natural Spring Water Revenue (USD Million) By Product (2021-2032)
Figure 37. South America Natural Spring Water Revenue (USD Million) By Type (2021-2032)
Figure 38. South America Natural Spring Water Revenue (USD Million) By Application (2021-2032)
Figure 39. South America Natural Spring Water Revenue (USD Million) By Product (2021-2032)
Figure 40. Middle East and Africa Natural Spring Water Revenue (USD Million) By Type (2021-2032)
Figure 41. Middle East and Africa Natural Spring Water Revenue (USD Million) By Application (2021-2032)
Figure 42. Middle East and Africa Natural Spring Water Revenue (USD Million) By Product (2021-2032)
By Type
Low Mineralized (<500mg/L)
Medium Mineralized (500-1500mg/L)
Highly Mineralized (>1500mg/L)
By Application
Supermarkets/Hypermarkets
Convenience Stores
Grocery Stores
Online Retail
Others
Countries Analyzed
North America (US, Canada, Mexico)
Europe (Germany, UK, France, Spain, Italy, Russia, Rest of Europe)
Asia Pacific (China, India, Japan, South Korea, Australia, South East Asia, Rest of Asia)
South America (Brazil, Argentina, Rest of South America)
Middle East and Africa (Saudi Arabia, UAE, Rest of Middle East, South Africa, Egypt, Rest of Africa)
