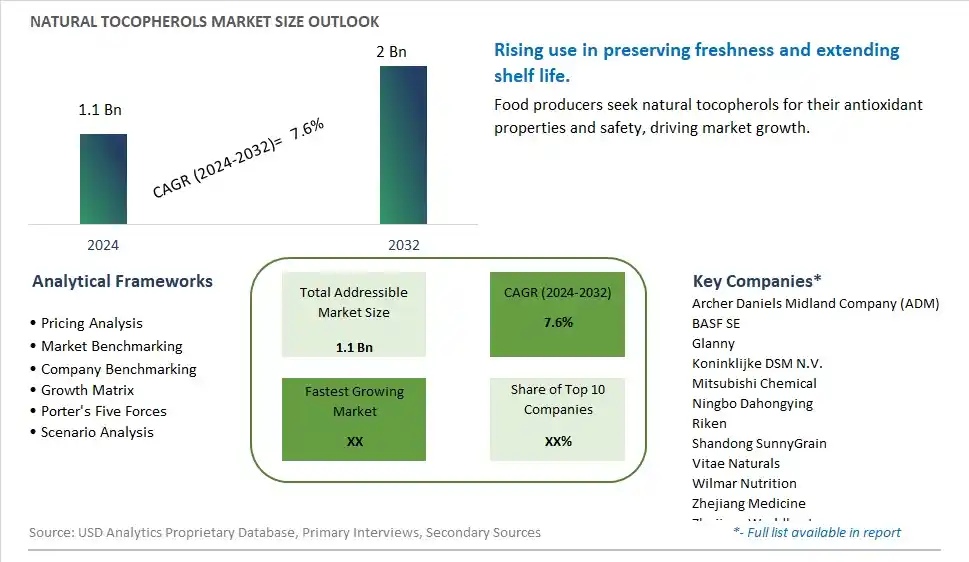
Global Natural Tocopherols Market Size is valued at $1.1 Billion in 2024 and is forecast to register a growth rate (CAGR) of 7.6% to reach $2 Billion by 2032.
The global Natural Tocopherols Market Comprehensive Study analyzes and forecasts the market size across 6 regions and 24 countries for diverse segments -By Type (Below 50% Tocopherols, 50 to 90% Tocopherols, Above 90% Tocopherols), By Application (Dietary Supplements, Food & Beverage, Cosmetics)
An Introduction to Natural Tocopherols Market
The Natural Tocopherols Market focuses on the production and sale of tocopherols, a type of vitamin E, derived from natural sources. These tocopherols are used as antioxidants in food, pharmaceuticals, and cosmetics. The market is driven by increasing demand for natural and clean label ingredients, rising awareness about the benefits of tocopherols for health and preservation, and growing applications in various industries. Additionally, advancements in tocopherol extraction technologies and the expansion of product applications support market growth.
Natural Tocopherols Competitive Landscape
The market report analyses the leading companies in the industry including Archer Daniels Midland Company (ADM), BASF SE, Glanny, Koninklijke DSM N.V., Mitsubishi Chemical, Ningbo Dahongying, Riken, Shandong SunnyGrain, Vitae Naturals, Wilmar Nutrition, Zhejiang Medicine, Zhejiang Worldbestve, and Others.
Natural Tocopherols Market Dynamics
Natural Tocopherols Market Trend: Increasing Use in Natural Food Preservation
The most prominent trend in the Natural Tocopherols Market is the increasing use in natural food preservation. Natural tocopherols, known for their antioxidant properties, are widely used to extend the shelf life of food products and improve their nutritional profile, driven by the demand for natural preservation methods.
Natural Tocopherols Market Driver: Growth of the Clean Label Food Movement
A key driver in the Natural Tocopherols Market is the growth of the clean label food movement. As more consumers seek foods made with natural and recognizable ingredients, there is a rising demand for natural tocopherols that align with clean label standards and ensure product quality and safety, supporting market expansion.
Natural Tocopherols Market Opportunity: Expansion into Health and Wellness Products
One significant opportunity in the Natural Tocopherols Market lies in the expansion into health and wellness products. Companies can innovate by incorporating natural tocopherols into products such as dietary supplements, skincare, and functional foods, leveraging their antioxidant benefits to attract health-conscious consumers, driving market growth.
Natural Tocopherols Market Share Analysis- Largest Segment by Type
In the Natural Tocopherols Market, the 50 to 90% Tocopherols segment is the largest. This concentration range offers a balanced profile of tocopherols (vitamin E) that provides both effective antioxidant properties and cost efficiency. Tocopherols in this range are widely used in dietary supplements and food products for their ability to protect against oxidative damage and extend shelf life. Their effectiveness and affordability make them the preferred choice among manufacturers, contributing to their dominance in the market.
Natural Tocopherols Market Share Analysis- Fastest Growing Segment by Application
The Dietary Supplements application segment is expected to grow the fastest in the Natural Tocopherols Market over the next five years. This growth is driven by the increasing consumer awareness of the health benefits of vitamin E, including its antioxidant properties and role in immune support. The rising demand for natural and functional supplements, along with growing health and wellness trends, propels the expansion of this segment. Additionally, advancements in supplement formulations that utilize tocopherols for enhanced health benefits contribute to the rapid growth.
Natural Tocopherols Market Segmentation
By Type
Below 50% Tocopherols
50 to 90% Tocopherols
Above 90% Tocopherols
By Application
Dietary Supplements
Food & Beverage
Cosmetics
Countries Analyzed
North America (US, Canada, Mexico)
Europe (Germany, UK, France, Spain, Italy, Russia, Rest of Europe)
Asia Pacific (China, India, Japan, South Korea, Australia, South East Asia, Rest of Asia)
South America (Brazil, Argentina, Rest of South America)
Middle East and Africa (Saudi Arabia, UAE, Rest of Middle East, South Africa, Egypt, Rest of Africa)
Natural Tocopherols Companies Profiled in the Study
Archer Daniels Midland Company (ADM)
BASF SE
Glanny
Koninklijke DSM N.V.
Mitsubishi Chemical
Ningbo Dahongying
Riken
Shandong SunnyGrain
Vitae Naturals
Wilmar Nutrition
Zhejiang Medicine
Zhejiang Worldbestve
*- List Not Exhaustive
Chapter 1. TABLE OF CONTENTS
Chapter 2. Introduction to Natural Tocopherols Market
2.1. Market Overview
2.2. Key Statistics and Report Highlights
2.3. Scope of the Comprehensive Study
2.3.1. Market Definition
2.3.2 Countries and Regions Covered
2.3.3 Research Objective
2.3.4 Units, Currency, and Conversions
2.3.5 Industry Value Chain
2.4. Key Market Segments
2.5. Key Companies
2.6. Study Period
Chapter 3. Strategic Analysis Review
3.1. Natural Tocopherols Pricing Analysis and Forecast
3.2. Porter’s Five Forces
3.3. Market Ecosystem
3.4. SWOT Analysis
3.5. Regulatory Scenario
3.3. Effects of Inflation, Russia-Ukraine War, moderating economic growth, and other macroeconomic factors
Chapter 4. Competitive Landscape
4.1. Market Share Analysis
4.1.1. Global Natural Tocopherols Market Share by Company, 2023
4.1.2. Product Offerings of Leading Natural Tocopherols Companies
4.2. Market Entropy
4.2.1. New Product Launches in the Industry
4.2.2. Mergers, Acquisitions, Joint ventures, and Partnerships
4.3. Key Strategies and Best Practices
Chapter 5. Global Market Projections: Best, Reference, and Low Case Scenarios
5.1. Growth Analysis- Case Scenario Definitions
5.2. Low Growth Case Scenario Forecasts
5.3. Reference Growth Case Scenario Forecasts
5.4. High Growth Case Scenario Forecasts
Chapter 6. Market Dynamics
6.1. Natural Tocopherols Market Drivers
6.2. Natural Tocopherols Market Challenges
6.6. Natural Tocopherols Market Opportunities
6.4. Natural Tocopherols Market Trends
Chapter 7. Global Natural Tocopherols Market Outlook Trends
7.1. Global Natural Tocopherols Revenue (USD Million) and CAGR (%) by Type (2021-2032)
7.2. Global Natural Tocopherols Revenue (USD Million) and CAGR (%) by Application (2021-2032)
7.3. Global Natural Tocopherols Revenue (USD Million) and CAGR (%) by Product (2021-2032)
By Type
Below 50% Tocopherols
50 to 90% Tocopherols
Above 90% Tocopherols
By Application
Dietary Supplements
Food & Beverage
Cosmetics
Chapter 8. Global Natural Tocopherols Regional Analysis and Outlook
8.1. Global Natural Tocopherols Revenue (USD Million) By Regions (2021- 2032)
8.2. North America Natural Tocopherols Revenue (USD Million) by Country (2021-2032)
8.2.1. United States Natural Tocopherols Regional Analysis and Outlook
8.2.2. Canada Natural Tocopherols Regional Analysis and Outlook
8.2.3. Mexico Natural Tocopherols Regional Analysis and Outlook
8.3. Europe Natural Tocopherols Revenue (USD Million), by Country (2021-2032)
8.3.1. Germany Natural Tocopherols Regional Analysis and Outlook
8.3.2. France Natural Tocopherols Regional Analysis and Outlook
8.3.3. United Kingdom Natural Tocopherols Regional Analysis and Outlook
8.3.4. Spain Natural Tocopherols Regional Analysis and Outlook
8.3.5. Italy Natural Tocopherols Regional Analysis and Outlook
8.3.6. Russia Natural Tocopherols Regional Analysis and Outlook
8.3.7. Rest of Europe Natural Tocopherols Regional Analysis and Outlook
8.4. Asia Pacific Natural Tocopherols Revenue (USD Million) by Country (2021-2032)
8.4.1. China Natural Tocopherols Regional Analysis and Outlook
8.4.2. Japan Natural Tocopherols Regional Analysis and Outlook
8.4.3. India Natural Tocopherols Regional Analysis and Outlook
8.4.4. South Korea Natural Tocopherols Regional Analysis and Outlook
8.4.5. Australia Natural Tocopherols Regional Analysis and Outlook
8.4.6. South East Asia Natural Tocopherols Regional Analysis and Outlook
8.4.7. Rest of Asia Pacific Natural Tocopherols Regional Analysis and Outlook
8.5. South America Natural Tocopherols Revenue (USD Million), by Country (2021-2032)
8.5.1. Brazil Natural Tocopherols Regional Analysis and Outlook
8.5.2. Argentina Natural Tocopherols Regional Analysis and Outlook
8.5.3. Rest of South America Natural Tocopherols Regional Analysis and Outlook
8.6. Middle East and Africa Natural Tocopherols Revenue (USD Million) by Country (2021-2032)
8.6.1. Middle East Natural Tocopherols Regional Analysis and Outlook
8.6.2. Africa Natural Tocopherols Regional Analysis and Outlook
Chapter 9. North America Natural Tocopherols Analysis and Outlook
9.1. North America Natural Tocopherols Revenue (USD Million) by Segments (2021-2032)
9.1.1. North America Natural Tocopherols Revenue (USD Million) by Type (2021-2032)
9.1.2. North America Natural Tocopherols Revenue (USD Million) by Application (2021-2032)
9.1.3. North America Natural Tocopherols Revenue (USD Million) by Product (2021-2032)
By Type
Below 50% Tocopherols
50 to 90% Tocopherols
Above 90% Tocopherols
By Application
Dietary Supplements
Food & Beverage
Cosmetics
Chapter 10. Europe Natural Tocopherols Analysis and Outlook
10.1. Europe Natural Tocopherols Revenue (USD Million), by Segments (USD Million) (2021-2032)
10.1.1. Europe Natural Tocopherols Revenue (USD Million) by Type (2021-2032)
10.1.2. Europe Natural Tocopherols Revenue (USD Million) by Application (2021-2032)
10.1.3. Europe Natural Tocopherols Revenue (USD Million) by Product (2021-2032)
By Type
Below 50% Tocopherols
50 to 90% Tocopherols
Above 90% Tocopherols
By Application
Dietary Supplements
Food & Beverage
Cosmetics
Chapter 11. Asia Pacific Natural Tocopherols Analysis and Outlook
11.1. Asia Pacific Natural Tocopherols Revenue (USD Million), and Revenue (USD Million) by Segments (2021-2032)
11.1.1. Asia Pacific Natural Tocopherols Revenue (USD Million) by Type (2021-2032)
11.1.2. Asia Pacific Natural Tocopherols Revenue (USD Million) by Application (2021-2032)
11.1.3. Asia Pacific Natural Tocopherols Revenue (USD Million) by Product (2021-2032)
By Type
Below 50% Tocopherols
50 to 90% Tocopherols
Above 90% Tocopherols
By Application
Dietary Supplements
Food & Beverage
Cosmetics
Chapter 12. South America Natural Tocopherols Analysis and Outlook
12.1. South America Natural Tocopherols Revenue (USD Million), by Segments (2021-2032)
12.1.1. South America Natural Tocopherols Revenue (USD Million) by Type (2021-2032)
12.1.2. South America Natural Tocopherols Revenue (USD Million) by Application (2021-2032)
12.1.3. South America Natural Tocopherols Revenue (USD Million) by Product (2021-2032)
By Type
Below 50% Tocopherols
50 to 90% Tocopherols
Above 90% Tocopherols
By Application
Dietary Supplements
Food & Beverage
Cosmetics
Chapter 13. Middle East and Africa Natural Tocopherols Analysis and Outlook
13.1. Middle East and Africa Natural Tocopherols Revenue (USD Million), by Segments (2021-2032)
13.1.1. Middle East and Africa Natural Tocopherols Revenue (USD Million) by Type (2021-2032)
13.1.2. Middle East and Africa Natural Tocopherols Revenue (USD Million) by Application (2021-2032)
13.1.3. Middle East and Africa Natural Tocopherols Revenue (USD Million) by Product (2021-2032)
By Type
Below 50% Tocopherols
50 to 90% Tocopherols
Above 90% Tocopherols
By Application
Dietary Supplements
Food & Beverage
Cosmetics
Chapter 14. Natural Tocopherols Company Profiles
14.1 Business Overview
14.2 Product Profiles
14.3 SWOT Profiles
14.5 Recent Developments
14.6 Financial Profile
List of Companies
Archer Daniels Midland Company (ADM)
BASF SE
Glanny
Koninklijke DSM N.V.
Mitsubishi Chemical
Ningbo Dahongying
Riken
Shandong SunnyGrain
Vitae Naturals
Wilmar Nutrition
Zhejiang Medicine
Zhejiang Worldbestve
15. Methodology and Data Sources
15.1 Customization Offerings
15.2 Subscription Services
15.3 Related Reports
15.4 Publisher Expertise
LIST OF TABLES
Table 1 Market Segmentation Analysis
Table 2 Global Natural Tocopherols Market Share of Leading Companies, 2023
Table 3 Product Offerings of Leading Companies
Table 4 Low Growth Scenario Forecasts
Table 5 Reference Case Growth Scenario
Table 6 High Growth Case Scenario
Table 7 Global Natural Tocopherols Revenue (USD Million) And CAGR (%) By Type (2021-2032)
Table 8 Global Natural Tocopherols Revenue (USD Million) And CAGR (%) By Application (2021-2032)
Table 9 Global Natural Tocopherols Revenue (USD Million) And CAGR (%) By Product (2021-2032)
Table 10 Global Natural Tocopherols Market Revenue (USD Million) By Regions (2021-2032)
Table 11 Global Natural Tocopherols Market Share (%) By Regions (2021-2032)
Table 12 North America Natural Tocopherols Revenue (USD Million) By Country (2021-2032)
Table 13 Europe Natural Tocopherols Revenue (USD Million) By Country (2021-2032)
Table 14 Asia Pacific Natural Tocopherols Revenue (USD Million) By Country (2021-2032)
Table 15 South America Natural Tocopherols Revenue (USD Million) By Country (2021-2032)
Table 16 Middle East and Africa Natural Tocopherols Revenue (USD Million) By Region (2021-2032)
Table 17 North America Natural Tocopherols Revenue (USD Million) By Type (2021-2032)
Table 18 North America Natural Tocopherols Revenue (USD Million) By Application (2021-2032)
Table 19 North America Natural Tocopherols Revenue (USD Million) By Product (2021-2032)
Table 20 Europe Natural Tocopherols Revenue (USD Million) By Type (2021-2032)
Table 21 Europe Natural Tocopherols Revenue (USD Million) By Application (2021-2032)
Table 22 Europe Natural Tocopherols Revenue (USD Million) By Product (2021-2032)
Table 23 Asia Pacific Natural Tocopherols Revenue (USD Million) By Type (2021-2032)
Table 24 Asia Pacific Natural Tocopherols Revenue (USD Million) By Application (2021-2032)
Table 25 Asia Pacific Natural Tocopherols Revenue (USD Million) By Product (2021-2032)
Table 26 South America Natural Tocopherols Revenue (USD Million) By Type (2021-2032)
Table 27 South America Natural Tocopherols Revenue (USD Million) By Application (2021-2032)
Table 28 South America Natural Tocopherols Revenue (USD Million) By Product (2021-2032)
Table 29 Middle East and Africa Natural Tocopherols Revenue (USD Million) By Type (2021-2032)
Table 30 Middle East and Africa Natural Tocopherols Revenue (USD Million) By Application (2021-2032)
Table 31 Middle East and Africa Natural Tocopherols Revenue (USD Million) By Product (2021-2032)
LIST OF FIGURES
Figure 1. Market Scope
Figure 2. Pricing Forecasts Per Unit, 2023- 2032
Figure 3. Porter’s Five Forces
Figure 4. Global Natural Tocopherols Market Revenue (USD Million) By Regions (2021-2032)
Figure 5. Global Natural Tocopherols Market Share (%) By Regions (2023)
Figure 6. North America Natural Tocopherols Revenue (USD Million) By Country (2021-2032)
Figure 7. United States Natural Tocopherols Revenue (USD Million) By Country (2021-2032)
Figure 8. Canada Natural Tocopherols Revenue (USD Million) By Country (2021-2032)
Figure 9. Mexico Natural Tocopherols Revenue (USD Million) By Country (2021-2032)
Figure 10. Europe Natural Tocopherols Revenue (USD Million) By Country (2021-2032)
Figure 11. Germany Natural Tocopherols Revenue (USD Million) By Country (2021-2032)
Figure 12. France Natural Tocopherols Revenue (USD Million) By Country (2021-2032)
Figure 13. United Kingdom Natural Tocopherols Revenue (USD Million) By Country (2021-2032)
Figure 14. Spain Natural Tocopherols Revenue (USD Million) By Country (2021-2032)
Figure 15. Italy Natural Tocopherols Revenue (USD Million) By Country (2021-2032)
Figure 16. Russia Natural Tocopherols Revenue (USD Million) By Country (2021-2032)
Figure 17. Rest of Europe Natural Tocopherols Revenue (USD Million) By Country (2021-2032)
Figure 11. Asia Pacific Natural Tocopherols Revenue (USD Million) By Country (2021-2032)
Figure 12. China Natural Tocopherols Revenue (USD Million) By Country (2021-2032)
Figure 13. Japan Natural Tocopherols Revenue (USD Million) By Country (2021-2032)
Figure 14. India Natural Tocopherols Revenue (USD Million) By Country (2021-2032)
Figure 15. South Korea Natural Tocopherols Revenue (USD Million) By Country (2021-2032)
Figure 16. Australia Natural Tocopherols Revenue (USD Million) By Country (2021-2032)
Figure 17. South East Asia Natural Tocopherols Revenue (USD Million) By Country (2021-2032)
Figure 18. South America Natural Tocopherols Revenue (USD Million) By Country (2021-2032)
Figure 19. Brazil Natural Tocopherols Revenue (USD Million) By Country (2021-2032)
Figure 20. Argentina Natural Tocopherols Revenue (USD Million) By Country (2021-2032)
Figure 21. Rest of Asia Pacific Natural Tocopherols Revenue (USD Million) By Country (2021-2032)
Figure 22. Middle East and Africa Natural Tocopherols Revenue (USD Million) By Region (2021-2032)
Figure 23. Saudi Arabia Natural Tocopherols Revenue (USD Million) By Region (2021-2032)
Figure 24. The UAE Natural Tocopherols Revenue (USD Million) By Region (2021-2032)
Figure 25. Rest of Middle East Natural Tocopherols Revenue (USD Million) By Region (2021-2032)
Figure 26. South Africa Natural Tocopherols Revenue (USD Million) By Region (2021-2032)
Figure 27. Africa Natural Tocopherols Revenue (USD Million) By Region (2021-2032)
Figure 28. North America Natural Tocopherols Revenue (USD Million) By Type (2021-2032)
Figure 29. North America Natural Tocopherols Revenue (USD Million) By Application (2021-2032)
Figure 30. North America Natural Tocopherols Revenue (USD Million) By Product (2021-2032)
Figure 31. Europe Natural Tocopherols Revenue (USD Million) By Type (2021-2032)
Figure 32. Europe Natural Tocopherols Revenue (USD Million) By Application (2021-2032)
Figure 33. Europe Natural Tocopherols Revenue (USD Million) By Product (2021-2032)
Figure 34. Asia Pacific Natural Tocopherols Revenue (USD Million) By Type (2021-2032)
Figure 35. Asia Pacific Natural Tocopherols Revenue (USD Million) By Application (2021-2032)
Figure 36. Asia Pacific Natural Tocopherols Revenue (USD Million) By Product (2021-2032)
Figure 37. South America Natural Tocopherols Revenue (USD Million) By Type (2021-2032)
Figure 38. South America Natural Tocopherols Revenue (USD Million) By Application (2021-2032)
Figure 39. South America Natural Tocopherols Revenue (USD Million) By Product (2021-2032)
Figure 40. Middle East and Africa Natural Tocopherols Revenue (USD Million) By Type (2021-2032)
Figure 41. Middle East and Africa Natural Tocopherols Revenue (USD Million) By Application (2021-2032)
Figure 42. Middle East and Africa Natural Tocopherols Revenue (USD Million) By Product (2021-2032)
By Type
Below 50% Tocopherols
50 to 90% Tocopherols
Above 90% Tocopherols
By Application
Dietary Supplements
Food & Beverage
Cosmetics
Countries Analyzed
North America (US, Canada, Mexico)
Europe (Germany, UK, France, Spain, Italy, Russia, Rest of Europe)
Asia Pacific (China, India, Japan, South Korea, Australia, South East Asia, Rest of Asia)
South America (Brazil, Argentina, Rest of South America)
Middle East and Africa (Saudi Arabia, UAE, Rest of Middle East, South Africa, Egypt, Rest of Africa)
