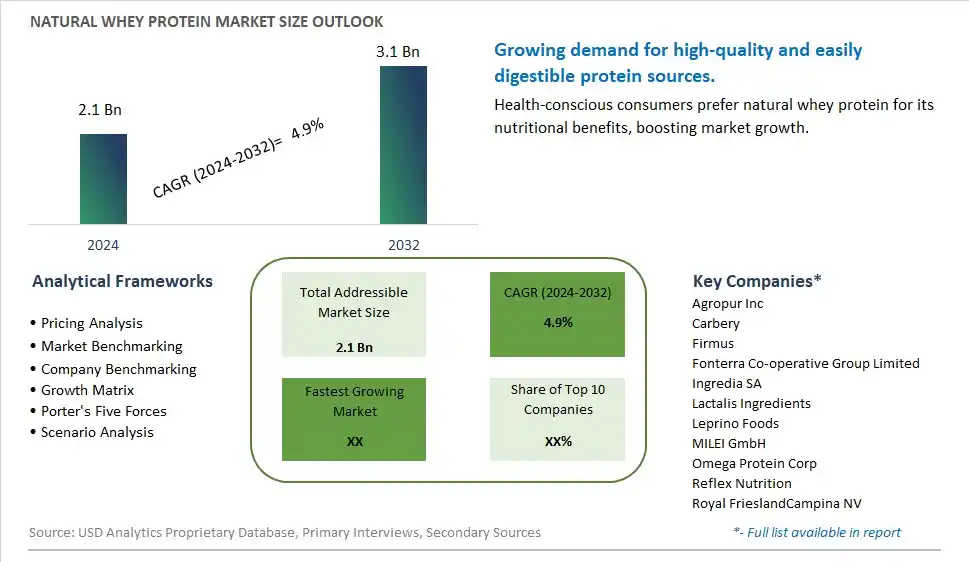
Global Natural Whey Protein Market Size is valued at $2.1 Billion in 2024 and is forecast to register a growth rate (CAGR) of 4.9% to reach $3.1 Billion by 2032.
The global Natural Whey Protein Market Comprehensive Study analyzes and forecasts the market size across 6 regions and 24 countries for diverse segments -By Type (Concentrate Form, Isolate Form), By Application (Food &Beverages, Pharmaceuticals, Others)
An Introduction to Natural Whey Protein Market
The Natural Whey Protein Market involves the production and sale of whey protein derived from natural sources, catering to consumers seeking high-quality and clean label protein supplements. The market is driven by increasing demand for natural and minimally processed protein products, rising popularity of fitness and bodybuilding, and growing awareness about the benefits of whey protein for muscle growth and recovery. Additionally, advancements in whey protein extraction technologies and the expansion of product applications support market growth.
Natural Whey Protein Competitive Landscape
The market report analyses the leading companies in the industry including Agropur Inc, Carbery, Firmus, Fonterra Co-operative Group Limited, Ingredia SA, Lactalis Ingredients, Leprino Foods, MILEI GmbH, Omega Protein Corp, Reflex Nutrition, Royal FrieslandCampina NV, and Others.
Natural Whey Protein Market Dynamics
Natural Whey Protein Market Trend: Rising Demand for Clean Label Protein Supplements
The most prominent trend in the Natural Whey Protein Market is the rising demand for clean label protein supplements. Natural whey protein, known for its high-quality and minimal processing, is increasingly used in health and fitness products, driven by consumer preference for clean and transparent labeling.
Natural Whey Protein Market Driver: Growth of the Sports Nutrition Industry
A key driver in the Natural Whey Protein Market is the growth of the sports nutrition industry. As more individuals engage in fitness and sports activities, there is a rising demand for high-quality protein supplements that support muscle growth and recovery, boosting the market for natural whey protein.
Natural Whey Protein Market Opportunity: Innovation in Protein-Enhanced Foods
One significant opportunity in the Natural Whey Protein Market lies in innovation in protein-enhanced foods. Companies can develop new products that incorporate natural whey protein, such as protein bars, shakes, and baked goods, offering consumers convenient and nutritious options that cater to their active lifestyles and dietary preferences, driving market growth.
Natural Whey Protein Market Share Analysis- Largest Segment by Type
In the Natural Whey Protein Market, Concentrate Form is the largest segment. Whey protein concentrate is favored for its cost-effectiveness, higher protein content compared to other protein forms, and additional beneficial nutrients such as immunoglobulins and lactoferrin. It is widely used in sports nutrition products, weight management supplements, and functional foods due to its favorable nutritional profile and functional properties. The lower cost of concentrate compared to isolate, combined with its broad application, supports its leading position in the market.
Natural Whey Protein Market Share Analysis- Fastest Growing Segment by Application
The Food & Beverages application segment is poised to grow the fastest in the Natural Whey Protein Market over the next five years. This growth is driven by the increasing incorporation of whey protein in various food and beverage products due to its health benefits, such as supporting muscle recovery and satiety. The trend towards healthier and protein-enriched foods, including protein bars, smoothies, and fortified beverages, fuels this rapid expansion. Additionally, innovations in product formulations and the rising popularity of high-protein diets contribute to the growth of this segment.
Natural Whey Protein Market Segmentation
By Type
Concentrate Form
Isolate Form
By Application
Food &Beverages
Pharmaceuticals
Others
Countries Analyzed
North America (US, Canada, Mexico)
Europe (Germany, UK, France, Spain, Italy, Russia, Rest of Europe)
Asia Pacific (China, India, Japan, South Korea, Australia, South East Asia, Rest of Asia)
South America (Brazil, Argentina, Rest of South America)
Middle East and Africa (Saudi Arabia, UAE, Rest of Middle East, South Africa, Egypt, Rest of Africa)
Natural Whey Protein Companies Profiled in the Study
Agropur Inc
Carbery
Firmus
Fonterra Co-operative Group Limited
Ingredia SA
Lactalis Ingredients
Leprino Foods
MILEI GmbH
Omega Protein Corp
Reflex Nutrition
Royal FrieslandCampina NV
*- List Not Exhaustive
Chapter 1. TABLE OF CONTENTS
Chapter 2. Introduction to Natural Whey Protein Market
2.1. Market Overview
2.2. Key Statistics and Report Highlights
2.3. Scope of the Comprehensive Study
2.3.1. Market Definition
2.3.2 Countries and Regions Covered
2.3.3 Research Objective
2.3.4 Units, Currency, and Conversions
2.3.5 Industry Value Chain
2.4. Key Market Segments
2.5. Key Companies
2.6. Study Period
Chapter 3. Strategic Analysis Review
3.1. Natural Whey Protein Pricing Analysis and Forecast
3.2. Porter’s Five Forces
3.3. Market Ecosystem
3.4. SWOT Analysis
3.5. Regulatory Scenario
3.3. Effects of Inflation, Russia-Ukraine War, moderating economic growth, and other macroeconomic factors
Chapter 4. Competitive Landscape
4.1. Market Share Analysis
4.1.1. Global Natural Whey Protein Market Share by Company, 2023
4.1.2. Product Offerings of Leading Natural Whey Protein Companies
4.2. Market Entropy
4.2.1. New Product Launches in the Industry
4.2.2. Mergers, Acquisitions, Joint ventures, and Partnerships
4.3. Key Strategies and Best Practices
Chapter 5. Global Market Projections: Best, Reference, and Low Case Scenarios
5.1. Growth Analysis- Case Scenario Definitions
5.2. Low Growth Case Scenario Forecasts
5.3. Reference Growth Case Scenario Forecasts
5.4. High Growth Case Scenario Forecasts
Chapter 6. Market Dynamics
6.1. Natural Whey Protein Market Drivers
6.2. Natural Whey Protein Market Challenges
6.6. Natural Whey Protein Market Opportunities
6.4. Natural Whey Protein Market Trends
Chapter 7. Global Natural Whey Protein Market Outlook Trends
7.1. Global Natural Whey Protein Revenue (USD Million) and CAGR (%) by Type (2021-2032)
7.2. Global Natural Whey Protein Revenue (USD Million) and CAGR (%) by Application (2021-2032)
7.3. Global Natural Whey Protein Revenue (USD Million) and CAGR (%) by Product (2021-2032)
By Type
Concentrate Form
Isolate Form
By Application
Food &Beverages
Pharmaceuticals
Others
Chapter 8. Global Natural Whey Protein Regional Analysis and Outlook
8.1. Global Natural Whey Protein Revenue (USD Million) By Regions (2021- 2032)
8.2. North America Natural Whey Protein Revenue (USD Million) by Country (2021-2032)
8.2.1. United States Natural Whey Protein Regional Analysis and Outlook
8.2.2. Canada Natural Whey Protein Regional Analysis and Outlook
8.2.3. Mexico Natural Whey Protein Regional Analysis and Outlook
8.3. Europe Natural Whey Protein Revenue (USD Million), by Country (2021-2032)
8.3.1. Germany Natural Whey Protein Regional Analysis and Outlook
8.3.2. France Natural Whey Protein Regional Analysis and Outlook
8.3.3. United Kingdom Natural Whey Protein Regional Analysis and Outlook
8.3.4. Spain Natural Whey Protein Regional Analysis and Outlook
8.3.5. Italy Natural Whey Protein Regional Analysis and Outlook
8.3.6. Russia Natural Whey Protein Regional Analysis and Outlook
8.3.7. Rest of Europe Natural Whey Protein Regional Analysis and Outlook
8.4. Asia Pacific Natural Whey Protein Revenue (USD Million) by Country (2021-2032)
8.4.1. China Natural Whey Protein Regional Analysis and Outlook
8.4.2. Japan Natural Whey Protein Regional Analysis and Outlook
8.4.3. India Natural Whey Protein Regional Analysis and Outlook
8.4.4. South Korea Natural Whey Protein Regional Analysis and Outlook
8.4.5. Australia Natural Whey Protein Regional Analysis and Outlook
8.4.6. South East Asia Natural Whey Protein Regional Analysis and Outlook
8.4.7. Rest of Asia Pacific Natural Whey Protein Regional Analysis and Outlook
8.5. South America Natural Whey Protein Revenue (USD Million), by Country (2021-2032)
8.5.1. Brazil Natural Whey Protein Regional Analysis and Outlook
8.5.2. Argentina Natural Whey Protein Regional Analysis and Outlook
8.5.3. Rest of South America Natural Whey Protein Regional Analysis and Outlook
8.6. Middle East and Africa Natural Whey Protein Revenue (USD Million) by Country (2021-2032)
8.6.1. Middle East Natural Whey Protein Regional Analysis and Outlook
8.6.2. Africa Natural Whey Protein Regional Analysis and Outlook
Chapter 9. North America Natural Whey Protein Analysis and Outlook
9.1. North America Natural Whey Protein Revenue (USD Million) by Segments (2021-2032)
9.1.1. North America Natural Whey Protein Revenue (USD Million) by Type (2021-2032)
9.1.2. North America Natural Whey Protein Revenue (USD Million) by Application (2021-2032)
9.1.3. North America Natural Whey Protein Revenue (USD Million) by Product (2021-2032)
By Type
Concentrate Form
Isolate Form
By Application
Food &Beverages
Pharmaceuticals
Others
Chapter 10. Europe Natural Whey Protein Analysis and Outlook
10.1. Europe Natural Whey Protein Revenue (USD Million), by Segments (USD Million) (2021-2032)
10.1.1. Europe Natural Whey Protein Revenue (USD Million) by Type (2021-2032)
10.1.2. Europe Natural Whey Protein Revenue (USD Million) by Application (2021-2032)
10.1.3. Europe Natural Whey Protein Revenue (USD Million) by Product (2021-2032)
By Type
Concentrate Form
Isolate Form
By Application
Food &Beverages
Pharmaceuticals
Others
Chapter 11. Asia Pacific Natural Whey Protein Analysis and Outlook
11.1. Asia Pacific Natural Whey Protein Revenue (USD Million), and Revenue (USD Million) by Segments (2021-2032)
11.1.1. Asia Pacific Natural Whey Protein Revenue (USD Million) by Type (2021-2032)
11.1.2. Asia Pacific Natural Whey Protein Revenue (USD Million) by Application (2021-2032)
11.1.3. Asia Pacific Natural Whey Protein Revenue (USD Million) by Product (2021-2032)
By Type
Concentrate Form
Isolate Form
By Application
Food &Beverages
Pharmaceuticals
Others
Chapter 12. South America Natural Whey Protein Analysis and Outlook
12.1. South America Natural Whey Protein Revenue (USD Million), by Segments (2021-2032)
12.1.1. South America Natural Whey Protein Revenue (USD Million) by Type (2021-2032)
12.1.2. South America Natural Whey Protein Revenue (USD Million) by Application (2021-2032)
12.1.3. South America Natural Whey Protein Revenue (USD Million) by Product (2021-2032)
By Type
Concentrate Form
Isolate Form
By Application
Food &Beverages
Pharmaceuticals
Others
Chapter 13. Middle East and Africa Natural Whey Protein Analysis and Outlook
13.1. Middle East and Africa Natural Whey Protein Revenue (USD Million), by Segments (2021-2032)
13.1.1. Middle East and Africa Natural Whey Protein Revenue (USD Million) by Type (2021-2032)
13.1.2. Middle East and Africa Natural Whey Protein Revenue (USD Million) by Application (2021-2032)
13.1.3. Middle East and Africa Natural Whey Protein Revenue (USD Million) by Product (2021-2032)
By Type
Concentrate Form
Isolate Form
By Application
Food &Beverages
Pharmaceuticals
Others
Chapter 14. Natural Whey Protein Company Profiles
14.1 Business Overview
14.2 Product Profiles
14.3 SWOT Profiles
14.5 Recent Developments
14.6 Financial Profile
List of Companies
Agropur Inc
Carbery
Firmus
Fonterra Co-operative Group Limited
Ingredia SA
Lactalis Ingredients
Leprino Foods
MILEI GmbH
Omega Protein Corp
Reflex Nutrition
Royal FrieslandCampina NV
15. Methodology and Data Sources
15.1 Customization Offerings
15.2 Subscription Services
15.3 Related Reports
15.4 Publisher Expertise
LIST OF TABLES
Table 1 Market Segmentation Analysis
Table 2 Global Natural Whey Protein Market Share of Leading Companies, 2023
Table 3 Product Offerings of Leading Companies
Table 4 Low Growth Scenario Forecasts
Table 5 Reference Case Growth Scenario
Table 6 High Growth Case Scenario
Table 7 Global Natural Whey Protein Revenue (USD Million) And CAGR (%) By Type (2021-2032)
Table 8 Global Natural Whey Protein Revenue (USD Million) And CAGR (%) By Application (2021-2032)
Table 9 Global Natural Whey Protein Revenue (USD Million) And CAGR (%) By Product (2021-2032)
Table 10 Global Natural Whey Protein Market Revenue (USD Million) By Regions (2021-2032)
Table 11 Global Natural Whey Protein Market Share (%) By Regions (2021-2032)
Table 12 North America Natural Whey Protein Revenue (USD Million) By Country (2021-2032)
Table 13 Europe Natural Whey Protein Revenue (USD Million) By Country (2021-2032)
Table 14 Asia Pacific Natural Whey Protein Revenue (USD Million) By Country (2021-2032)
Table 15 South America Natural Whey Protein Revenue (USD Million) By Country (2021-2032)
Table 16 Middle East and Africa Natural Whey Protein Revenue (USD Million) By Region (2021-2032)
Table 17 North America Natural Whey Protein Revenue (USD Million) By Type (2021-2032)
Table 18 North America Natural Whey Protein Revenue (USD Million) By Application (2021-2032)
Table 19 North America Natural Whey Protein Revenue (USD Million) By Product (2021-2032)
Table 20 Europe Natural Whey Protein Revenue (USD Million) By Type (2021-2032)
Table 21 Europe Natural Whey Protein Revenue (USD Million) By Application (2021-2032)
Table 22 Europe Natural Whey Protein Revenue (USD Million) By Product (2021-2032)
Table 23 Asia Pacific Natural Whey Protein Revenue (USD Million) By Type (2021-2032)
Table 24 Asia Pacific Natural Whey Protein Revenue (USD Million) By Application (2021-2032)
Table 25 Asia Pacific Natural Whey Protein Revenue (USD Million) By Product (2021-2032)
Table 26 South America Natural Whey Protein Revenue (USD Million) By Type (2021-2032)
Table 27 South America Natural Whey Protein Revenue (USD Million) By Application (2021-2032)
Table 28 South America Natural Whey Protein Revenue (USD Million) By Product (2021-2032)
Table 29 Middle East and Africa Natural Whey Protein Revenue (USD Million) By Type (2021-2032)
Table 30 Middle East and Africa Natural Whey Protein Revenue (USD Million) By Application (2021-2032)
Table 31 Middle East and Africa Natural Whey Protein Revenue (USD Million) By Product (2021-2032)
LIST OF FIGURES
Figure 1. Market Scope
Figure 2. Pricing Forecasts Per Unit, 2023- 2032
Figure 3. Porter’s Five Forces
Figure 4. Global Natural Whey Protein Market Revenue (USD Million) By Regions (2021-2032)
Figure 5. Global Natural Whey Protein Market Share (%) By Regions (2023)
Figure 6. North America Natural Whey Protein Revenue (USD Million) By Country (2021-2032)
Figure 7. United States Natural Whey Protein Revenue (USD Million) By Country (2021-2032)
Figure 8. Canada Natural Whey Protein Revenue (USD Million) By Country (2021-2032)
Figure 9. Mexico Natural Whey Protein Revenue (USD Million) By Country (2021-2032)
Figure 10. Europe Natural Whey Protein Revenue (USD Million) By Country (2021-2032)
Figure 11. Germany Natural Whey Protein Revenue (USD Million) By Country (2021-2032)
Figure 12. France Natural Whey Protein Revenue (USD Million) By Country (2021-2032)
Figure 13. United Kingdom Natural Whey Protein Revenue (USD Million) By Country (2021-2032)
Figure 14. Spain Natural Whey Protein Revenue (USD Million) By Country (2021-2032)
Figure 15. Italy Natural Whey Protein Revenue (USD Million) By Country (2021-2032)
Figure 16. Russia Natural Whey Protein Revenue (USD Million) By Country (2021-2032)
Figure 17. Rest of Europe Natural Whey Protein Revenue (USD Million) By Country (2021-2032)
Figure 11. Asia Pacific Natural Whey Protein Revenue (USD Million) By Country (2021-2032)
Figure 12. China Natural Whey Protein Revenue (USD Million) By Country (2021-2032)
Figure 13. Japan Natural Whey Protein Revenue (USD Million) By Country (2021-2032)
Figure 14. India Natural Whey Protein Revenue (USD Million) By Country (2021-2032)
Figure 15. South Korea Natural Whey Protein Revenue (USD Million) By Country (2021-2032)
Figure 16. Australia Natural Whey Protein Revenue (USD Million) By Country (2021-2032)
Figure 17. South East Asia Natural Whey Protein Revenue (USD Million) By Country (2021-2032)
Figure 18. South America Natural Whey Protein Revenue (USD Million) By Country (2021-2032)
Figure 19. Brazil Natural Whey Protein Revenue (USD Million) By Country (2021-2032)
Figure 20. Argentina Natural Whey Protein Revenue (USD Million) By Country (2021-2032)
Figure 21. Rest of Asia Pacific Natural Whey Protein Revenue (USD Million) By Country (2021-2032)
Figure 22. Middle East and Africa Natural Whey Protein Revenue (USD Million) By Region (2021-2032)
Figure 23. Saudi Arabia Natural Whey Protein Revenue (USD Million) By Region (2021-2032)
Figure 24. The UAE Natural Whey Protein Revenue (USD Million) By Region (2021-2032)
Figure 25. Rest of Middle East Natural Whey Protein Revenue (USD Million) By Region (2021-2032)
Figure 26. South Africa Natural Whey Protein Revenue (USD Million) By Region (2021-2032)
Figure 27. Africa Natural Whey Protein Revenue (USD Million) By Region (2021-2032)
Figure 28. North America Natural Whey Protein Revenue (USD Million) By Type (2021-2032)
Figure 29. North America Natural Whey Protein Revenue (USD Million) By Application (2021-2032)
Figure 30. North America Natural Whey Protein Revenue (USD Million) By Product (2021-2032)
Figure 31. Europe Natural Whey Protein Revenue (USD Million) By Type (2021-2032)
Figure 32. Europe Natural Whey Protein Revenue (USD Million) By Application (2021-2032)
Figure 33. Europe Natural Whey Protein Revenue (USD Million) By Product (2021-2032)
Figure 34. Asia Pacific Natural Whey Protein Revenue (USD Million) By Type (2021-2032)
Figure 35. Asia Pacific Natural Whey Protein Revenue (USD Million) By Application (2021-2032)
Figure 36. Asia Pacific Natural Whey Protein Revenue (USD Million) By Product (2021-2032)
Figure 37. South America Natural Whey Protein Revenue (USD Million) By Type (2021-2032)
Figure 38. South America Natural Whey Protein Revenue (USD Million) By Application (2021-2032)
Figure 39. South America Natural Whey Protein Revenue (USD Million) By Product (2021-2032)
Figure 40. Middle East and Africa Natural Whey Protein Revenue (USD Million) By Type (2021-2032)
Figure 41. Middle East and Africa Natural Whey Protein Revenue (USD Million) By Application (2021-2032)
Figure 42. Middle East and Africa Natural Whey Protein Revenue (USD Million) By Product (2021-2032)
By Type
Concentrate Form
Isolate Form
By Application
Food &Beverages
Pharmaceuticals
Others
Countries Analyzed
North America (US, Canada, Mexico)
Europe (Germany, UK, France, Spain, Italy, Russia, Rest of Europe)
Asia Pacific (China, India, Japan, South Korea, Australia, South East Asia, Rest of Asia)
South America (Brazil, Argentina, Rest of South America)
Middle East and Africa (Saudi Arabia, UAE, Rest of Middle East, South Africa, Egypt, Rest of Africa)
