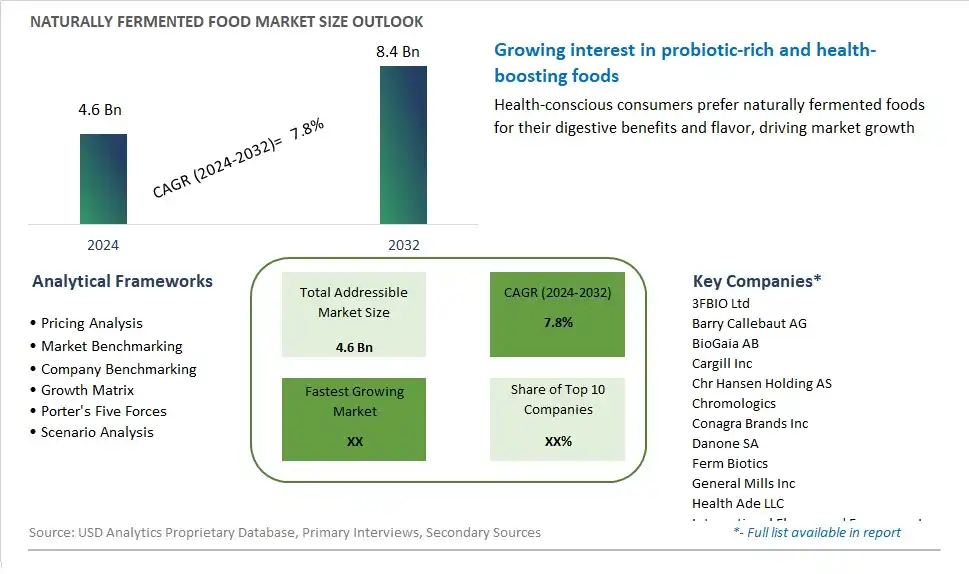
Global Naturally Fermented Food Market Size is valued at $4.6 Billion in 2024 and is forecast to register a growth rate (CAGR) of 7.8% to reach $8.4 Billion by 2032.
The global Naturally Fermented Food Market Comprehensive Study analyzes and forecasts the market size across 6 regions and 24 countries for diverse segments -By Product (Dairy, bakery, Others), By Application (Supermarkets/Hypermarkets, Convenience Store, Online, Others)
An Introduction to Naturally Fermented Food Market
In 2024, the market for naturally fermented food is experiencing a resurgence as consumers rediscover the health benefits and culinary delights of fermented foods and beverages. Naturally fermented foods are produced through the metabolic action of beneficial bacteria and yeast, which convert sugars and starches into organic acids and gases, resulting in unique flavors, textures, and nutritional profiles. From kimchi and sauerkraut to kombucha, kefir, and miso, fermented foods offer a rich array of probiotics, enzymes, vitamins, and antioxidants that support digestive health, immune function, and overall well-being. With growing interest in gut health, microbiome diversity, and functional foods, consumers are incorporating fermented foods into their diets as a natural and delicious way to promote digestive balance and optimize nutrient absorption. Moreover, the versatility of fermented ingredients allows for creative experimentation in culinary applications, including marinades, dressings, condiments, and baked goods, reflecting a growing appreciation for traditional fermentation techniques and artisanal food craftsmanship. As the market for naturally fermented foods expands, expect to see continued innovation in flavor profiles, packaging formats, and educational initiatives that celebrate the cultural heritage and health benefits of fermented foods from around the world.
Naturally Fermented Food Competitive Landscape
The market report analyses the leading companies in the industry including 3FBIO Ltd, Barry Callebaut AG, BioGaia AB, Cargill Inc, Chr Hansen Holding AS, Chromologics, Conagra Brands Inc, Danone SA, Ferm Biotics, General Mills Inc, Health Ade LLC, International Flavors and Fragrances Inc, Kingdom Supercultures, Koninklijke DSM NV, Lifeway Foods Inc, Nestle SA, Perfect Day Inc, Probitat, Tetra Pak Group, The Kraft Heinz Co., and Others.
Naturally Fermented Food Market Dynamics
Naturally Fermented Food Market Trend: Growing Interest in Gut Health and Probiotics
A significant trend in the naturally fermented food market is the growing interest in gut health and probiotics among consumers. With increasing awareness of the gut microbiome's role in overall health and well-being, there's a surge in demand for naturally fermented foods rich in beneficial bacteria and probiotics. Consumers are seeking out fermented foods such as yogurt, kefir, kimchi, sauerkraut, and kombucha, which are naturally fermented through the action of beneficial microorganisms like lactobacilli and bifidobacteria. This trend is driven by a desire to maintain digestive health, support immune function, and improve overall wellness through the consumption of probiotic-rich foods that promote a healthy gut microbiota.
Market Driver: Preference for Clean Label and Functional Foods
A key driver for the naturally fermented food market is the preference for clean label and functional foods among health-conscious consumers. As people become more mindful of their dietary choices and seek out foods with minimal processing and natural ingredients, there's a growing demand for naturally fermented foods that offer functional health benefits. These foods are perceived as wholesome, nutritious, and beneficial for digestion, immune support, and overall vitality. This driver is reinforced by factors such as the rising prevalence of digestive disorders, food sensitivities, and chronic health conditions, as well as the increasing popularity of diets such as the Mediterranean diet and traditional Asian diets that include naturally fermented foods as staples.
Market Opportunity: Diversification and Innovation in Fermented Products
An opportunity for the naturally fermented food market lies in diversification and innovation in fermented products to cater to evolving consumer preferences and culinary trends. Companies can capitalize on this opportunity by expanding their product offerings to include a wider variety of naturally fermented foods and beverages, such as plant-based yogurts, non-dairy kefir, fermented vegetables, tempeh, miso, and sourdough bread. Moreover, there's potential to innovate with new flavors, textures, and formulations to appeal to diverse tastes and preferences, as well as to introduce fermented products tailored to specific dietary needs and lifestyles, such as gluten-free, vegan, and low-sugar options. By embracing innovation and diversification, companies can tap into new market segments, differentiate their products, and drive growth in the naturally fermented food market.
Naturally Fermented Food Market Share Analysis: Dairy held the dominant market share in 2024
Within the Naturally Fermented Food market segmented by product, the Dairy category is the largest segment, driven by the rich tradition of fermented dairy products across cultures and the growing consumer preference for probiotic-rich foods. Dairy products such as yogurt, kefir, and cheese undergo fermentation processes that not only enhance their flavor and texture but also imbue them with beneficial bacteria known to promote gut health and digestion. With increasing awareness of the importance of gut health and the gut microbiome, there is a rising demand for naturally fermented dairy products as a convenient and delicious way to incorporate probiotics into daily diets. Further, the versatility of dairy-based fermentation allows for the creation of a diverse range of products, appealing to different tastes and dietary preferences. As a result, the Dairy segment commands a significant share of the Naturally Fermented Food market, reflecting the enduring popularity and nutritional benefits of fermented dairy products among consumers.
Naturally Fermented Food Market Share Analysis: Online market is poised to register the fastest growth rae over the forecast period to 2032
In the Naturally Fermented Food market segmented by application, the Online segment is the fastest-growing, fueled by the rapid digitalization of consumer shopping habits and the convenience of purchasing fermented foods from e-commerce platforms. Online channels offer consumers a wide selection of naturally fermented products from various brands and regions, providing access to niche and specialty items that may not be readily available in local supermarkets or convenience stores. Further, the ease of comparison shopping, access to product reviews, and the ability to explore a diverse range of fermented foods contribute to the growing popularity of online purchases. Additionally, the COVID-19 pandemic has accelerated the shift towards online shopping as consumers seek contactless shopping alternatives, further driving the growth of the online segment in the Naturally Fermented Food market. As a result, the Online segment emerges as a key driver of growth, reflecting the evolving preferences and shopping behaviors of consumers seeking convenient and accessible options for purchasing fermented foods.
Naturally Fermented Food Market Segmentation
By Product
Dairy
bakery
Others
By Application
Supermarkets/Hypermarkets
Convenience Store
Online
Others
Countries Analyzed
North America (US, Canada, Mexico)
Europe (Germany, UK, France, Spain, Italy, Russia, Rest of Europe)
Asia Pacific (China, India, Japan, South Korea, Australia, South East Asia, Rest of Asia)
South America (Brazil, Argentina, Rest of South America)
Middle East and Africa (Saudi Arabia, UAE, Rest of Middle East, South Africa, Egypt, Rest of Africa)
Naturally Fermented Food Companies Profiled in the Study
3FBIO Ltd
Barry Callebaut AG
BioGaia AB
Cargill Inc
Chr Hansen Holding AS
Chromologics
Conagra Brands Inc
Danone SA
Ferm Biotics
General Mills Inc
Health Ade LLC
International Flavors and Fragrances Inc
Kingdom Supercultures
Koninklijke DSM NV
Lifeway Foods Inc
Nestle SA
Perfect Day Inc
Probitat
Tetra Pak Group
The Kraft Heinz Co.
*- List Not Exhaustive
Chapter 1. TABLE OF CONTENTS
Chapter 2. Introduction to Naturally Fermented Food Market
2.1. Market Overview
2.2. Key Statistics and Report Highlights
2.3. Scope of the Comprehensive Study
2.3.1. Market Definition
2.3.2 Countries and Regions Covered
2.3.3 Research Objective
2.3.4 Units, Currency, and Conversions
2.3.5 Industry Value Chain
2.4. Key Market Segments
2.5. Key Companies
2.6. Study Period
Chapter 3. Strategic Analysis Review
3.1. Naturally Fermented Food Pricing Analysis and Forecast
3.2. Porter’s Five Forces
3.3. Market Ecosystem
3.4. SWOT Analysis
3.5. Regulatory Scenario
3.3. Effects of Inflation, Russia-Ukraine War, moderating economic growth, and other macroeconomic factors
Chapter 4. Competitive Landscape
4.1. Market Share Analysis
4.1.1. Global Naturally Fermented Food Market Share by Company, 2023
4.1.2. Product Offerings of Leading Naturally Fermented Food Companies
4.2. Market Entropy
4.2.1. New Product Launches in the Industry
4.2.2. Mergers, Acquisitions, Joint ventures, and Partnerships
4.3. Key Strategies and Best Practices
Chapter 5. Global Market Projections: Best, Reference, and Low Case Scenarios
5.1. Growth Analysis- Case Scenario Definitions
5.2. Low Growth Case Scenario Forecasts
5.3. Reference Growth Case Scenario Forecasts
5.4. High Growth Case Scenario Forecasts
Chapter 6. Market Dynamics
6.1. Naturally Fermented Food Market Drivers
6.2. Naturally Fermented Food Market Challenges
6.6. Naturally Fermented Food Market Opportunities
6.4. Naturally Fermented Food Market Trends
Chapter 7. Global Naturally Fermented Food Market Outlook Trends
7.1. Global Naturally Fermented Food Revenue (USD Million) and CAGR (%) by Type (2021-2032)
7.2. Global Naturally Fermented Food Revenue (USD Million) and CAGR (%) by Application (2021-2032)
7.3. Global Naturally Fermented Food Revenue (USD Million) and CAGR (%) by Product (2021-2032)
By Product
Dairy
bakery
Others
By Application
Supermarkets/Hypermarkets
Convenience Store
Online
Others
Chapter 8. Global Naturally Fermented Food Regional Analysis and Outlook
8.1. Global Naturally Fermented Food Revenue (USD Million) By Regions (2021- 2032)
8.2. North America Naturally Fermented Food Revenue (USD Million) by Country (2021-2032)
8.2.1. United States Naturally Fermented Food Regional Analysis and Outlook
8.2.2. Canada Naturally Fermented Food Regional Analysis and Outlook
8.2.3. Mexico Naturally Fermented Food Regional Analysis and Outlook
8.3. Europe Naturally Fermented Food Revenue (USD Million), by Country (2021-2032)
8.3.1. Germany Naturally Fermented Food Regional Analysis and Outlook
8.3.2. France Naturally Fermented Food Regional Analysis and Outlook
8.3.3. United Kingdom Naturally Fermented Food Regional Analysis and Outlook
8.3.4. Spain Naturally Fermented Food Regional Analysis and Outlook
8.3.5. Italy Naturally Fermented Food Regional Analysis and Outlook
8.3.6. Russia Naturally Fermented Food Regional Analysis and Outlook
8.3.7. Rest of Europe Naturally Fermented Food Regional Analysis and Outlook
8.4. Asia Pacific Naturally Fermented Food Revenue (USD Million) by Country (2021-2032)
8.4.1. China Naturally Fermented Food Regional Analysis and Outlook
8.4.2. Japan Naturally Fermented Food Regional Analysis and Outlook
8.4.3. India Naturally Fermented Food Regional Analysis and Outlook
8.4.4. South Korea Naturally Fermented Food Regional Analysis and Outlook
8.4.5. Australia Naturally Fermented Food Regional Analysis and Outlook
8.4.6. South East Asia Naturally Fermented Food Regional Analysis and Outlook
8.4.7. Rest of Asia Pacific Naturally Fermented Food Regional Analysis and Outlook
8.5. South America Naturally Fermented Food Revenue (USD Million), by Country (2021-2032)
8.5.1. Brazil Naturally Fermented Food Regional Analysis and Outlook
8.5.2. Argentina Naturally Fermented Food Regional Analysis and Outlook
8.5.3. Rest of South America Naturally Fermented Food Regional Analysis and Outlook
8.6. Middle East and Africa Naturally Fermented Food Revenue (USD Million) by Country (2021-2032)
8.6.1. Middle East Naturally Fermented Food Regional Analysis and Outlook
8.6.2. Africa Naturally Fermented Food Regional Analysis and Outlook
Chapter 9. North America Naturally Fermented Food Analysis and Outlook
9.1. North America Naturally Fermented Food Revenue (USD Million) by Segments (2021-2032)
9.1.1. North America Naturally Fermented Food Revenue (USD Million) by Type (2021-2032)
9.1.2. North America Naturally Fermented Food Revenue (USD Million) by Application (2021-2032)
9.1.3. North America Naturally Fermented Food Revenue (USD Million) by Product (2021-2032)
By Product
Dairy
bakery
Others
By Application
Supermarkets/Hypermarkets
Convenience Store
Online
Others
Chapter 10. Europe Naturally Fermented Food Analysis and Outlook
10.1. Europe Naturally Fermented Food Revenue (USD Million), by Segments (USD Million) (2021-2032)
10.1.1. Europe Naturally Fermented Food Revenue (USD Million) by Type (2021-2032)
10.1.2. Europe Naturally Fermented Food Revenue (USD Million) by Application (2021-2032)
10.1.3. Europe Naturally Fermented Food Revenue (USD Million) by Product (2021-2032)
By Product
Dairy
bakery
Others
By Application
Supermarkets/Hypermarkets
Convenience Store
Online
Others
Chapter 11. Asia Pacific Naturally Fermented Food Analysis and Outlook
11.1. Asia Pacific Naturally Fermented Food Revenue (USD Million), and Revenue (USD Million) by Segments (2021-2032)
11.1.1. Asia Pacific Naturally Fermented Food Revenue (USD Million) by Type (2021-2032)
11.1.2. Asia Pacific Naturally Fermented Food Revenue (USD Million) by Application (2021-2032)
11.1.3. Asia Pacific Naturally Fermented Food Revenue (USD Million) by Product (2021-2032)
By Product
Dairy
bakery
Others
By Application
Supermarkets/Hypermarkets
Convenience Store
Online
Others
Chapter 12. South America Naturally Fermented Food Analysis and Outlook
12.1. South America Naturally Fermented Food Revenue (USD Million), by Segments (2021-2032)
12.1.1. South America Naturally Fermented Food Revenue (USD Million) by Type (2021-2032)
12.1.2. South America Naturally Fermented Food Revenue (USD Million) by Application (2021-2032)
12.1.3. South America Naturally Fermented Food Revenue (USD Million) by Product (2021-2032)
By Product
Dairy
bakery
Others
By Application
Supermarkets/Hypermarkets
Convenience Store
Online
Others
Chapter 13. Middle East and Africa Naturally Fermented Food Analysis and Outlook
13.1. Middle East and Africa Naturally Fermented Food Revenue (USD Million), by Segments (2021-2032)
13.1.1. Middle East and Africa Naturally Fermented Food Revenue (USD Million) by Type (2021-2032)
13.1.2. Middle East and Africa Naturally Fermented Food Revenue (USD Million) by Application (2021-2032)
13.1.3. Middle East and Africa Naturally Fermented Food Revenue (USD Million) by Product (2021-2032)
By Product
Dairy
bakery
Others
By Application
Supermarkets/Hypermarkets
Convenience Store
Online
Others
Chapter 14. Naturally Fermented Food Company Profiles
14.1 Business Overview
14.2 Product Profiles
14.3 SWOT Profiles
14.5 Recent Developments
14.6 Financial Profile
List of Companies
3FBIO Ltd
Barry Callebaut AG
BioGaia AB
Cargill Inc
Chr Hansen Holding AS
Chromologics
Conagra Brands Inc
Danone SA
Ferm Biotics
General Mills Inc
Health Ade LLC
International Flavors and Fragrances Inc
Kingdom Supercultures
Koninklijke DSM NV
Lifeway Foods Inc
Nestle SA
Perfect Day Inc
Probitat
Tetra Pak Group
The Kraft Heinz Co.
15. Methodology and Data Sources
15.1 Customization Offerings
15.2 Subscription Services
15.3 Related Reports
15.4 Publisher Expertise
LIST OF TABLES
Table 1 Market Segmentation Analysis
Table 2 Global Naturally Fermented Food Market Share of Leading Companies, 2023
Table 3 Product Offerings of Leading Companies
Table 4 Low Growth Scenario Forecasts
Table 5 Reference Case Growth Scenario
Table 6 High Growth Case Scenario
Table 7 Global Naturally Fermented Food Revenue (USD Million) And CAGR (%) By Type (2021-2032)
Table 8 Global Naturally Fermented Food Revenue (USD Million) And CAGR (%) By Application (2021-2032)
Table 9 Global Naturally Fermented Food Revenue (USD Million) And CAGR (%) By Product (2021-2032)
Table 10 Global Naturally Fermented Food Market Revenue (USD Million) By Regions (2021-2032)
Table 11 Global Naturally Fermented Food Market Share (%) By Regions (2021-2032)
Table 12 North America Naturally Fermented Food Revenue (USD Million) By Country (2021-2032)
Table 13 Europe Naturally Fermented Food Revenue (USD Million) By Country (2021-2032)
Table 14 Asia Pacific Naturally Fermented Food Revenue (USD Million) By Country (2021-2032)
Table 15 South America Naturally Fermented Food Revenue (USD Million) By Country (2021-2032)
Table 16 Middle East and Africa Naturally Fermented Food Revenue (USD Million) By Region (2021-2032)
Table 17 North America Naturally Fermented Food Revenue (USD Million) By Type (2021-2032)
Table 18 North America Naturally Fermented Food Revenue (USD Million) By Application (2021-2032)
Table 19 North America Naturally Fermented Food Revenue (USD Million) By Product (2021-2032)
Table 20 Europe Naturally Fermented Food Revenue (USD Million) By Type (2021-2032)
Table 21 Europe Naturally Fermented Food Revenue (USD Million) By Application (2021-2032)
Table 22 Europe Naturally Fermented Food Revenue (USD Million) By Product (2021-2032)
Table 23 Asia Pacific Naturally Fermented Food Revenue (USD Million) By Type (2021-2032)
Table 24 Asia Pacific Naturally Fermented Food Revenue (USD Million) By Application (2021-2032)
Table 25 Asia Pacific Naturally Fermented Food Revenue (USD Million) By Product (2021-2032)
Table 26 South America Naturally Fermented Food Revenue (USD Million) By Type (2021-2032)
Table 27 South America Naturally Fermented Food Revenue (USD Million) By Application (2021-2032)
Table 28 South America Naturally Fermented Food Revenue (USD Million) By Product (2021-2032)
Table 29 Middle East and Africa Naturally Fermented Food Revenue (USD Million) By Type (2021-2032)
Table 30 Middle East and Africa Naturally Fermented Food Revenue (USD Million) By Application (2021-2032)
Table 31 Middle East and Africa Naturally Fermented Food Revenue (USD Million) By Product (2021-2032)
LIST OF FIGURES
Figure 1. Market Scope
Figure 2. Pricing Forecasts Per Unit, 2023- 2032
Figure 3. Porter’s Five Forces
Figure 4. Global Naturally Fermented Food Market Revenue (USD Million) By Regions (2021-2032)
Figure 5. Global Naturally Fermented Food Market Share (%) By Regions (2023)
Figure 6. North America Naturally Fermented Food Revenue (USD Million) By Country (2021-2032)
Figure 7. United States Naturally Fermented Food Revenue (USD Million) By Country (2021-2032)
Figure 8. Canada Naturally Fermented Food Revenue (USD Million) By Country (2021-2032)
Figure 9. Mexico Naturally Fermented Food Revenue (USD Million) By Country (2021-2032)
Figure 10. Europe Naturally Fermented Food Revenue (USD Million) By Country (2021-2032)
Figure 11. Germany Naturally Fermented Food Revenue (USD Million) By Country (2021-2032)
Figure 12. France Naturally Fermented Food Revenue (USD Million) By Country (2021-2032)
Figure 13. United Kingdom Naturally Fermented Food Revenue (USD Million) By Country (2021-2032)
Figure 14. Spain Naturally Fermented Food Revenue (USD Million) By Country (2021-2032)
Figure 15. Italy Naturally Fermented Food Revenue (USD Million) By Country (2021-2032)
Figure 16. Russia Naturally Fermented Food Revenue (USD Million) By Country (2021-2032)
Figure 17. Rest of Europe Naturally Fermented Food Revenue (USD Million) By Country (2021-2032)
Figure 11. Asia Pacific Naturally Fermented Food Revenue (USD Million) By Country (2021-2032)
Figure 12. China Naturally Fermented Food Revenue (USD Million) By Country (2021-2032)
Figure 13. Japan Naturally Fermented Food Revenue (USD Million) By Country (2021-2032)
Figure 14. India Naturally Fermented Food Revenue (USD Million) By Country (2021-2032)
Figure 15. South Korea Naturally Fermented Food Revenue (USD Million) By Country (2021-2032)
Figure 16. Australia Naturally Fermented Food Revenue (USD Million) By Country (2021-2032)
Figure 17. South East Asia Naturally Fermented Food Revenue (USD Million) By Country (2021-2032)
Figure 18. South America Naturally Fermented Food Revenue (USD Million) By Country (2021-2032)
Figure 19. Brazil Naturally Fermented Food Revenue (USD Million) By Country (2021-2032)
Figure 20. Argentina Naturally Fermented Food Revenue (USD Million) By Country (2021-2032)
Figure 21. Rest of Asia Pacific Naturally Fermented Food Revenue (USD Million) By Country (2021-2032)
Figure 22. Middle East and Africa Naturally Fermented Food Revenue (USD Million) By Region (2021-2032)
Figure 23. Saudi Arabia Naturally Fermented Food Revenue (USD Million) By Region (2021-2032)
Figure 24. The UAE Naturally Fermented Food Revenue (USD Million) By Region (2021-2032)
Figure 25. Rest of Middle East Naturally Fermented Food Revenue (USD Million) By Region (2021-2032)
Figure 26. South Africa Naturally Fermented Food Revenue (USD Million) By Region (2021-2032)
Figure 27. Africa Naturally Fermented Food Revenue (USD Million) By Region (2021-2032)
Figure 28. North America Naturally Fermented Food Revenue (USD Million) By Type (2021-2032)
Figure 29. North America Naturally Fermented Food Revenue (USD Million) By Application (2021-2032)
Figure 30. North America Naturally Fermented Food Revenue (USD Million) By Product (2021-2032)
Figure 31. Europe Naturally Fermented Food Revenue (USD Million) By Type (2021-2032)
Figure 32. Europe Naturally Fermented Food Revenue (USD Million) By Application (2021-2032)
Figure 33. Europe Naturally Fermented Food Revenue (USD Million) By Product (2021-2032)
Figure 34. Asia Pacific Naturally Fermented Food Revenue (USD Million) By Type (2021-2032)
Figure 35. Asia Pacific Naturally Fermented Food Revenue (USD Million) By Application (2021-2032)
Figure 36. Asia Pacific Naturally Fermented Food Revenue (USD Million) By Product (2021-2032)
Figure 37. South America Naturally Fermented Food Revenue (USD Million) By Type (2021-2032)
Figure 38. South America Naturally Fermented Food Revenue (USD Million) By Application (2021-2032)
Figure 39. South America Naturally Fermented Food Revenue (USD Million) By Product (2021-2032)
Figure 40. Middle East and Africa Naturally Fermented Food Revenue (USD Million) By Type (2021-2032)
Figure 41. Middle East and Africa Naturally Fermented Food Revenue (USD Million) By Application (2021-2032)
Figure 42. Middle East and Africa Naturally Fermented Food Revenue (USD Million) By Product (2021-2032)
By Product
Dairy
bakery
Others
By Application
Supermarkets/Hypermarkets
Convenience Store
Online
Others
Countries Analyzed
North America (US, Canada, Mexico)
Europe (Germany, UK, France, Spain, Italy, Russia, Rest of Europe)
Asia Pacific (China, India, Japan, South Korea, Australia, South East Asia, Rest of Asia)
South America (Brazil, Argentina, Rest of South America)
Middle East and Africa (Saudi Arabia, UAE, Rest of Middle East, South Africa, Egypt, Rest of Africa)
