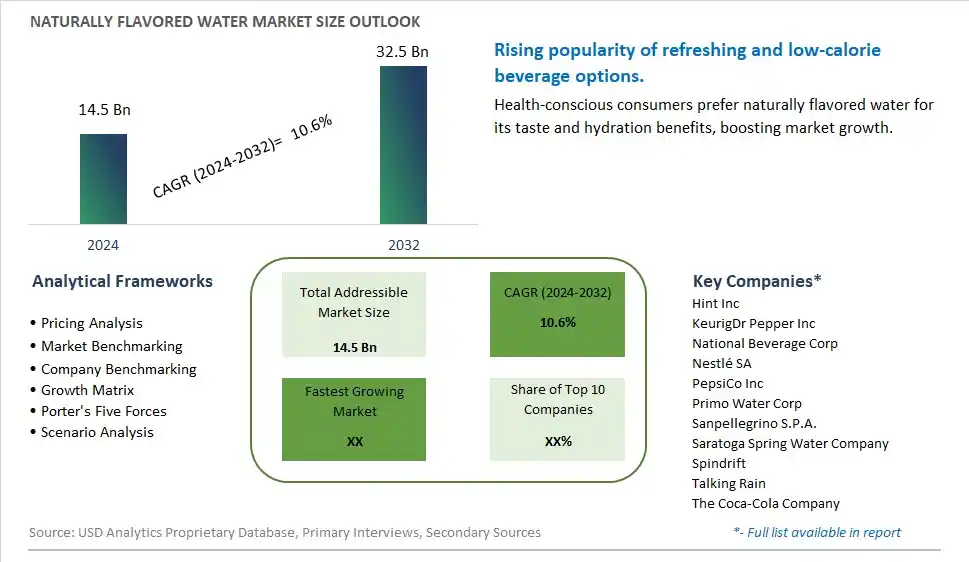
Global Naturally Flavored Water Market Size is valued at $14.5 Billion in 2024 and is forecast to register a growth rate (CAGR) of 10.6% to reach $32.5 Billion by 2032.
The global Naturally Flavored Water Market Comprehensive Study analyzes and forecasts the market size across 6 regions and 24 countries for diverse segments -By Type (Sparkling, Still), By Application (Supermarkets/ Hypermarkets, Convenience Stores, Specialty Stores, Online Retail, Others)
An Introduction to Naturally Flavored Water Market
The Naturally Flavored Water Market involves the production and sale of water infused with natural flavors from fruits, herbs, and botanicals. These beverages cater to consumers seeking healthy and refreshing drink options without added sugars or artificial ingredients. The market is driven by increasing health consciousness, rising demand for natural and clean label beverages, and growing popularity of flavored waters as a healthy alternative to sugary drinks. Additionally, innovations in flavor infusion technologies and the expansion of product offerings support market growth.
Naturally Flavored Water Competitive Landscape
The market report analyses the leading companies in the industry including Hint Inc, KeurigDr Pepper Inc, National Beverage Corp, Nestlé SA, PepsiCo Inc, Primo Water Corp, Sanpellegrino S.P.A., Saratoga Spring Water Company, Spindrift, Talking Rain, The Coca-Cola Company, and Others.
Naturally Flavored Water Market Dynamics
Naturally Flavored Water Market Trend: Growing Popularity of Flavored Waters as Healthy Alternatives
The most prominent trend in the Naturally Flavored Water Market is the growing popularity of flavored waters as healthy alternatives to sugary drinks. Consumers are seeking beverages that offer refreshing flavors without added sugars or artificial ingredients, driven by the desire for healthier and more hydrating options.
Naturally Flavored Water Market Driver: Health Consciousness and Demand for Natural Ingredients
A key driver in the Naturally Flavored Water Market is health consciousness and the demand for natural ingredients. As more individuals focus on improving their diet and avoiding artificial additives, there is a rising demand for naturally flavored waters that provide a tasty and natural hydration solution, supporting market growth.
Naturally Flavored Water Market Opportunity: Expansion into Functional and Enhanced Waters
One significant opportunity in the Naturally Flavored Water Market lies in the expansion into functional and enhanced waters. Companies can innovate by creating naturally flavored waters that incorporate additional health benefits, such as added electrolytes, vitamins, and antioxidants, offering consumers a variety of tasty and nutritious hydration options, driving market growth.
Naturally Flavored Water Market Share Analysis- Largest Segment by Type
In the Naturally Flavored Water Market, Still water is the largest segment. Still water's dominance is due to its broad appeal and the growing consumer preference for simple, hydration-focused beverages without the carbonation found in sparkling water. The health-conscious trend driving the demand for low-calorie, naturally flavored options favors still water, which is often perceived as a cleaner and more versatile choice. Its extensive use in various applications, including daily hydration and as a mixer in beverages, underpins its market leadership.
Naturally Flavored Water Market Share Analysis- Fastest Growing Segment by Application
Online Retail is set to grow the fastest in the Naturally Flavored Water Market over the next five years. The shift towards digital shopping platforms is accelerating due to the convenience and variety they offer. Online retail enables consumers to easily access a diverse range of naturally flavored water products, including those not available in local stores. The ability to compare prices, read reviews, and benefit from home delivery services makes online retail an increasingly popular channel for purchasing these products.
Naturally Flavored Water Market Segmentation
By Type
Sparkling
Still
By Application
Supermarkets/ Hypermarkets
Convenience Stores
Specialty Stores
Online Retail
Others
Countries Analyzed
North America (US, Canada, Mexico)
Europe (Germany, UK, France, Spain, Italy, Russia, Rest of Europe)
Asia Pacific (China, India, Japan, South Korea, Australia, South East Asia, Rest of Asia)
South America (Brazil, Argentina, Rest of South America)
Middle East and Africa (Saudi Arabia, UAE, Rest of Middle East, South Africa, Egypt, Rest of Africa)
Naturally Flavored Water Companies Profiled in the Study
Hint Inc
KeurigDr Pepper Inc
National Beverage Corp
Nestlé SA
PepsiCo Inc
Primo Water Corp
Sanpellegrino S.P.A.
Saratoga Spring Water Company
Spindrift
Talking Rain
The Coca-Cola Company
*- List Not Exhaustive
Chapter 1. TABLE OF CONTENTS
Chapter 2. Introduction to Naturally Flavored Water Market
2.1. Market Overview
2.2. Key Statistics and Report Highlights
2.3. Scope of the Comprehensive Study
2.3.1. Market Definition
2.3.2 Countries and Regions Covered
2.3.3 Research Objective
2.3.4 Units, Currency, and Conversions
2.3.5 Industry Value Chain
2.4. Key Market Segments
2.5. Key Companies
2.6. Study Period
Chapter 3. Strategic Analysis Review
3.1. Naturally Flavored Water Pricing Analysis and Forecast
3.2. Porter’s Five Forces
3.3. Market Ecosystem
3.4. SWOT Analysis
3.5. Regulatory Scenario
3.3. Effects of Inflation, Russia-Ukraine War, moderating economic growth, and other macroeconomic factors
Chapter 4. Competitive Landscape
4.1. Market Share Analysis
4.1.1. Global Naturally Flavored Water Market Share by Company, 2023
4.1.2. Product Offerings of Leading Naturally Flavored Water Companies
4.2. Market Entropy
4.2.1. New Product Launches in the Industry
4.2.2. Mergers, Acquisitions, Joint ventures, and Partnerships
4.3. Key Strategies and Best Practices
Chapter 5. Global Market Projections: Best, Reference, and Low Case Scenarios
5.1. Growth Analysis- Case Scenario Definitions
5.2. Low Growth Case Scenario Forecasts
5.3. Reference Growth Case Scenario Forecasts
5.4. High Growth Case Scenario Forecasts
Chapter 6. Market Dynamics
6.1. Naturally Flavored Water Market Drivers
6.2. Naturally Flavored Water Market Challenges
6.6. Naturally Flavored Water Market Opportunities
6.4. Naturally Flavored Water Market Trends
Chapter 7. Global Naturally Flavored Water Market Outlook Trends
7.1. Global Naturally Flavored Water Revenue (USD Million) and CAGR (%) by Type (2021-2032)
7.2. Global Naturally Flavored Water Revenue (USD Million) and CAGR (%) by Application (2021-2032)
7.3. Global Naturally Flavored Water Revenue (USD Million) and CAGR (%) by Product (2021-2032)
By Type
Sparkling
Still
By Application
Supermarkets/ Hypermarkets
Convenience Stores
Specialty Stores
Online Retail
Others
Chapter 8. Global Naturally Flavored Water Regional Analysis and Outlook
8.1. Global Naturally Flavored Water Revenue (USD Million) By Regions (2021- 2032)
8.2. North America Naturally Flavored Water Revenue (USD Million) by Country (2021-2032)
8.2.1. United States Naturally Flavored Water Regional Analysis and Outlook
8.2.2. Canada Naturally Flavored Water Regional Analysis and Outlook
8.2.3. Mexico Naturally Flavored Water Regional Analysis and Outlook
8.3. Europe Naturally Flavored Water Revenue (USD Million), by Country (2021-2032)
8.3.1. Germany Naturally Flavored Water Regional Analysis and Outlook
8.3.2. France Naturally Flavored Water Regional Analysis and Outlook
8.3.3. United Kingdom Naturally Flavored Water Regional Analysis and Outlook
8.3.4. Spain Naturally Flavored Water Regional Analysis and Outlook
8.3.5. Italy Naturally Flavored Water Regional Analysis and Outlook
8.3.6. Russia Naturally Flavored Water Regional Analysis and Outlook
8.3.7. Rest of Europe Naturally Flavored Water Regional Analysis and Outlook
8.4. Asia Pacific Naturally Flavored Water Revenue (USD Million) by Country (2021-2032)
8.4.1. China Naturally Flavored Water Regional Analysis and Outlook
8.4.2. Japan Naturally Flavored Water Regional Analysis and Outlook
8.4.3. India Naturally Flavored Water Regional Analysis and Outlook
8.4.4. South Korea Naturally Flavored Water Regional Analysis and Outlook
8.4.5. Australia Naturally Flavored Water Regional Analysis and Outlook
8.4.6. South East Asia Naturally Flavored Water Regional Analysis and Outlook
8.4.7. Rest of Asia Pacific Naturally Flavored Water Regional Analysis and Outlook
8.5. South America Naturally Flavored Water Revenue (USD Million), by Country (2021-2032)
8.5.1. Brazil Naturally Flavored Water Regional Analysis and Outlook
8.5.2. Argentina Naturally Flavored Water Regional Analysis and Outlook
8.5.3. Rest of South America Naturally Flavored Water Regional Analysis and Outlook
8.6. Middle East and Africa Naturally Flavored Water Revenue (USD Million) by Country (2021-2032)
8.6.1. Middle East Naturally Flavored Water Regional Analysis and Outlook
8.6.2. Africa Naturally Flavored Water Regional Analysis and Outlook
Chapter 9. North America Naturally Flavored Water Analysis and Outlook
9.1. North America Naturally Flavored Water Revenue (USD Million) by Segments (2021-2032)
9.1.1. North America Naturally Flavored Water Revenue (USD Million) by Type (2021-2032)
9.1.2. North America Naturally Flavored Water Revenue (USD Million) by Application (2021-2032)
9.1.3. North America Naturally Flavored Water Revenue (USD Million) by Product (2021-2032)
By Type
Sparkling
Still
By Application
Supermarkets/ Hypermarkets
Convenience Stores
Specialty Stores
Online Retail
Others
Chapter 10. Europe Naturally Flavored Water Analysis and Outlook
10.1. Europe Naturally Flavored Water Revenue (USD Million), by Segments (USD Million) (2021-2032)
10.1.1. Europe Naturally Flavored Water Revenue (USD Million) by Type (2021-2032)
10.1.2. Europe Naturally Flavored Water Revenue (USD Million) by Application (2021-2032)
10.1.3. Europe Naturally Flavored Water Revenue (USD Million) by Product (2021-2032)
By Type
Sparkling
Still
By Application
Supermarkets/ Hypermarkets
Convenience Stores
Specialty Stores
Online Retail
Others
Chapter 11. Asia Pacific Naturally Flavored Water Analysis and Outlook
11.1. Asia Pacific Naturally Flavored Water Revenue (USD Million), and Revenue (USD Million) by Segments (2021-2032)
11.1.1. Asia Pacific Naturally Flavored Water Revenue (USD Million) by Type (2021-2032)
11.1.2. Asia Pacific Naturally Flavored Water Revenue (USD Million) by Application (2021-2032)
11.1.3. Asia Pacific Naturally Flavored Water Revenue (USD Million) by Product (2021-2032)
By Type
Sparkling
Still
By Application
Supermarkets/ Hypermarkets
Convenience Stores
Specialty Stores
Online Retail
Others
Chapter 12. South America Naturally Flavored Water Analysis and Outlook
12.1. South America Naturally Flavored Water Revenue (USD Million), by Segments (2021-2032)
12.1.1. South America Naturally Flavored Water Revenue (USD Million) by Type (2021-2032)
12.1.2. South America Naturally Flavored Water Revenue (USD Million) by Application (2021-2032)
12.1.3. South America Naturally Flavored Water Revenue (USD Million) by Product (2021-2032)
By Type
Sparkling
Still
By Application
Supermarkets/ Hypermarkets
Convenience Stores
Specialty Stores
Online Retail
Others
Chapter 13. Middle East and Africa Naturally Flavored Water Analysis and Outlook
13.1. Middle East and Africa Naturally Flavored Water Revenue (USD Million), by Segments (2021-2032)
13.1.1. Middle East and Africa Naturally Flavored Water Revenue (USD Million) by Type (2021-2032)
13.1.2. Middle East and Africa Naturally Flavored Water Revenue (USD Million) by Application (2021-2032)
13.1.3. Middle East and Africa Naturally Flavored Water Revenue (USD Million) by Product (2021-2032)
By Type
Sparkling
Still
By Application
Supermarkets/ Hypermarkets
Convenience Stores
Specialty Stores
Online Retail
Others
Chapter 14. Naturally Flavored Water Company Profiles
14.1 Business Overview
14.2 Product Profiles
14.3 SWOT Profiles
14.5 Recent Developments
14.6 Financial Profile
List of Companies
Hint Inc
KeurigDr Pepper Inc
National Beverage Corp
Nestlé SA
PepsiCo Inc
Primo Water Corp
Sanpellegrino S.P.A.
Saratoga Spring Water Company
Spindrift
Talking Rain
The Coca-Cola Company
15. Methodology and Data Sources
15.1 Customization Offerings
15.2 Subscription Services
15.3 Related Reports
15.4 Publisher Expertise
LIST OF TABLES
Table 1 Market Segmentation Analysis
Table 2 Global Naturally Flavored Water Market Share of Leading Companies, 2023
Table 3 Product Offerings of Leading Companies
Table 4 Low Growth Scenario Forecasts
Table 5 Reference Case Growth Scenario
Table 6 High Growth Case Scenario
Table 7 Global Naturally Flavored Water Revenue (USD Million) And CAGR (%) By Type (2021-2032)
Table 8 Global Naturally Flavored Water Revenue (USD Million) And CAGR (%) By Application (2021-2032)
Table 9 Global Naturally Flavored Water Revenue (USD Million) And CAGR (%) By Product (2021-2032)
Table 10 Global Naturally Flavored Water Market Revenue (USD Million) By Regions (2021-2032)
Table 11 Global Naturally Flavored Water Market Share (%) By Regions (2021-2032)
Table 12 North America Naturally Flavored Water Revenue (USD Million) By Country (2021-2032)
Table 13 Europe Naturally Flavored Water Revenue (USD Million) By Country (2021-2032)
Table 14 Asia Pacific Naturally Flavored Water Revenue (USD Million) By Country (2021-2032)
Table 15 South America Naturally Flavored Water Revenue (USD Million) By Country (2021-2032)
Table 16 Middle East and Africa Naturally Flavored Water Revenue (USD Million) By Region (2021-2032)
Table 17 North America Naturally Flavored Water Revenue (USD Million) By Type (2021-2032)
Table 18 North America Naturally Flavored Water Revenue (USD Million) By Application (2021-2032)
Table 19 North America Naturally Flavored Water Revenue (USD Million) By Product (2021-2032)
Table 20 Europe Naturally Flavored Water Revenue (USD Million) By Type (2021-2032)
Table 21 Europe Naturally Flavored Water Revenue (USD Million) By Application (2021-2032)
Table 22 Europe Naturally Flavored Water Revenue (USD Million) By Product (2021-2032)
Table 23 Asia Pacific Naturally Flavored Water Revenue (USD Million) By Type (2021-2032)
Table 24 Asia Pacific Naturally Flavored Water Revenue (USD Million) By Application (2021-2032)
Table 25 Asia Pacific Naturally Flavored Water Revenue (USD Million) By Product (2021-2032)
Table 26 South America Naturally Flavored Water Revenue (USD Million) By Type (2021-2032)
Table 27 South America Naturally Flavored Water Revenue (USD Million) By Application (2021-2032)
Table 28 South America Naturally Flavored Water Revenue (USD Million) By Product (2021-2032)
Table 29 Middle East and Africa Naturally Flavored Water Revenue (USD Million) By Type (2021-2032)
Table 30 Middle East and Africa Naturally Flavored Water Revenue (USD Million) By Application (2021-2032)
Table 31 Middle East and Africa Naturally Flavored Water Revenue (USD Million) By Product (2021-2032)
LIST OF FIGURES
Figure 1. Market Scope
Figure 2. Pricing Forecasts Per Unit, 2023- 2032
Figure 3. Porter’s Five Forces
Figure 4. Global Naturally Flavored Water Market Revenue (USD Million) By Regions (2021-2032)
Figure 5. Global Naturally Flavored Water Market Share (%) By Regions (2023)
Figure 6. North America Naturally Flavored Water Revenue (USD Million) By Country (2021-2032)
Figure 7. United States Naturally Flavored Water Revenue (USD Million) By Country (2021-2032)
Figure 8. Canada Naturally Flavored Water Revenue (USD Million) By Country (2021-2032)
Figure 9. Mexico Naturally Flavored Water Revenue (USD Million) By Country (2021-2032)
Figure 10. Europe Naturally Flavored Water Revenue (USD Million) By Country (2021-2032)
Figure 11. Germany Naturally Flavored Water Revenue (USD Million) By Country (2021-2032)
Figure 12. France Naturally Flavored Water Revenue (USD Million) By Country (2021-2032)
Figure 13. United Kingdom Naturally Flavored Water Revenue (USD Million) By Country (2021-2032)
Figure 14. Spain Naturally Flavored Water Revenue (USD Million) By Country (2021-2032)
Figure 15. Italy Naturally Flavored Water Revenue (USD Million) By Country (2021-2032)
Figure 16. Russia Naturally Flavored Water Revenue (USD Million) By Country (2021-2032)
Figure 17. Rest of Europe Naturally Flavored Water Revenue (USD Million) By Country (2021-2032)
Figure 11. Asia Pacific Naturally Flavored Water Revenue (USD Million) By Country (2021-2032)
Figure 12. China Naturally Flavored Water Revenue (USD Million) By Country (2021-2032)
Figure 13. Japan Naturally Flavored Water Revenue (USD Million) By Country (2021-2032)
Figure 14. India Naturally Flavored Water Revenue (USD Million) By Country (2021-2032)
Figure 15. South Korea Naturally Flavored Water Revenue (USD Million) By Country (2021-2032)
Figure 16. Australia Naturally Flavored Water Revenue (USD Million) By Country (2021-2032)
Figure 17. South East Asia Naturally Flavored Water Revenue (USD Million) By Country (2021-2032)
Figure 18. South America Naturally Flavored Water Revenue (USD Million) By Country (2021-2032)
Figure 19. Brazil Naturally Flavored Water Revenue (USD Million) By Country (2021-2032)
Figure 20. Argentina Naturally Flavored Water Revenue (USD Million) By Country (2021-2032)
Figure 21. Rest of Asia Pacific Naturally Flavored Water Revenue (USD Million) By Country (2021-2032)
Figure 22. Middle East and Africa Naturally Flavored Water Revenue (USD Million) By Region (2021-2032)
Figure 23. Saudi Arabia Naturally Flavored Water Revenue (USD Million) By Region (2021-2032)
Figure 24. The UAE Naturally Flavored Water Revenue (USD Million) By Region (2021-2032)
Figure 25. Rest of Middle East Naturally Flavored Water Revenue (USD Million) By Region (2021-2032)
Figure 26. South Africa Naturally Flavored Water Revenue (USD Million) By Region (2021-2032)
Figure 27. Africa Naturally Flavored Water Revenue (USD Million) By Region (2021-2032)
Figure 28. North America Naturally Flavored Water Revenue (USD Million) By Type (2021-2032)
Figure 29. North America Naturally Flavored Water Revenue (USD Million) By Application (2021-2032)
Figure 30. North America Naturally Flavored Water Revenue (USD Million) By Product (2021-2032)
Figure 31. Europe Naturally Flavored Water Revenue (USD Million) By Type (2021-2032)
Figure 32. Europe Naturally Flavored Water Revenue (USD Million) By Application (2021-2032)
Figure 33. Europe Naturally Flavored Water Revenue (USD Million) By Product (2021-2032)
Figure 34. Asia Pacific Naturally Flavored Water Revenue (USD Million) By Type (2021-2032)
Figure 35. Asia Pacific Naturally Flavored Water Revenue (USD Million) By Application (2021-2032)
Figure 36. Asia Pacific Naturally Flavored Water Revenue (USD Million) By Product (2021-2032)
Figure 37. South America Naturally Flavored Water Revenue (USD Million) By Type (2021-2032)
Figure 38. South America Naturally Flavored Water Revenue (USD Million) By Application (2021-2032)
Figure 39. South America Naturally Flavored Water Revenue (USD Million) By Product (2021-2032)
Figure 40. Middle East and Africa Naturally Flavored Water Revenue (USD Million) By Type (2021-2032)
Figure 41. Middle East and Africa Naturally Flavored Water Revenue (USD Million) By Application (2021-2032)
Figure 42. Middle East and Africa Naturally Flavored Water Revenue (USD Million) By Product (2021-2032)
By Type
Sparkling
Still
By Application
Supermarkets/ Hypermarkets
Convenience Stores
Specialty Stores
Online Retail
Others
Countries Analyzed
North America (US, Canada, Mexico)
Europe (Germany, UK, France, Spain, Italy, Russia, Rest of Europe)
Asia Pacific (China, India, Japan, South Korea, Australia, South East Asia, Rest of Asia)
South America (Brazil, Argentina, Rest of South America)
Middle East and Africa (Saudi Arabia, UAE, Rest of Middle East, South Africa, Egypt, Rest of Africa)
